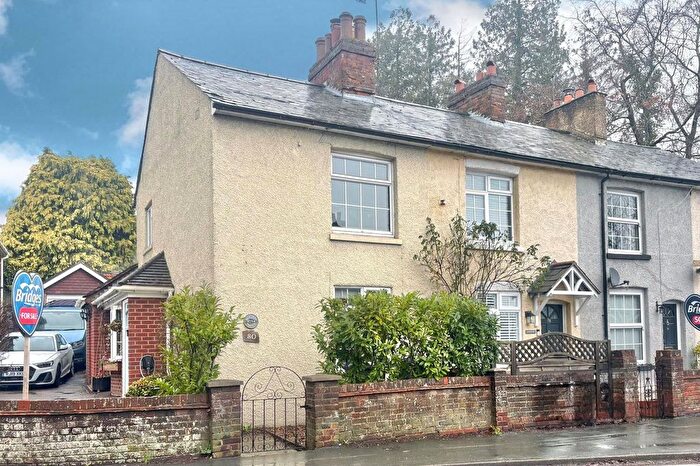
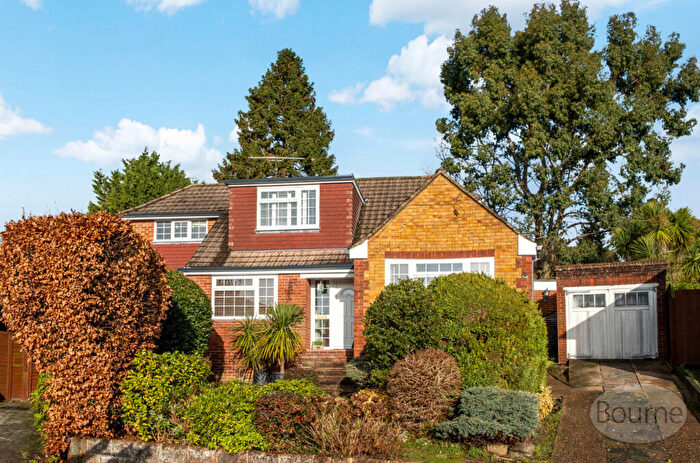
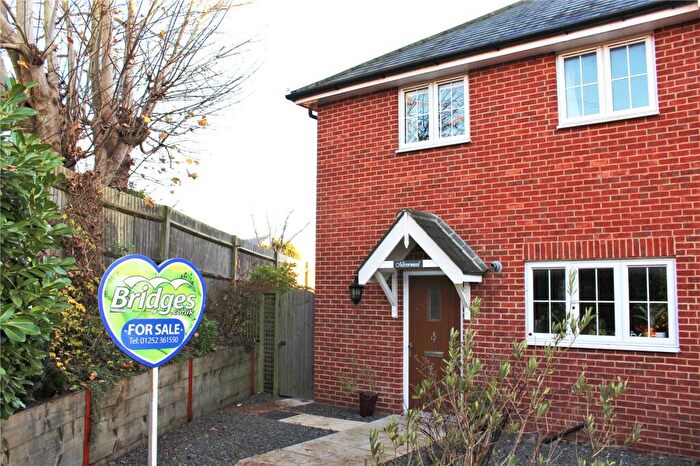
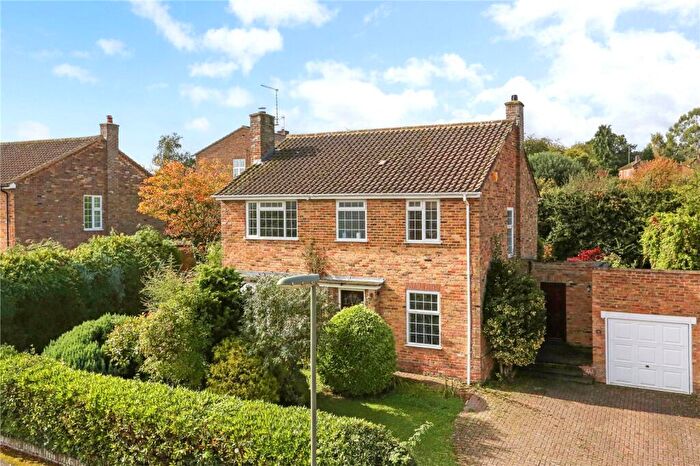
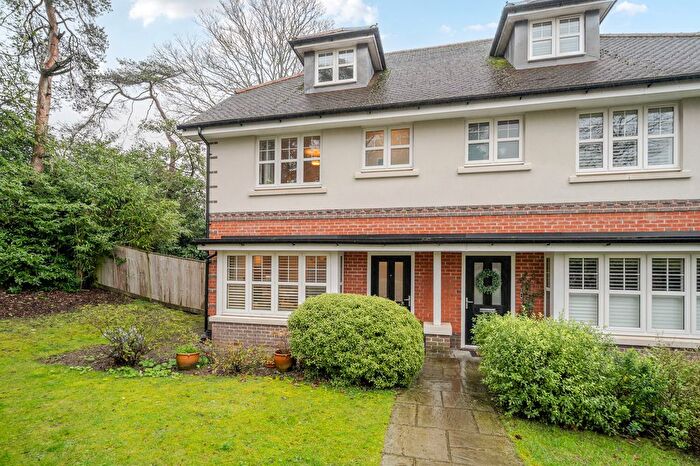
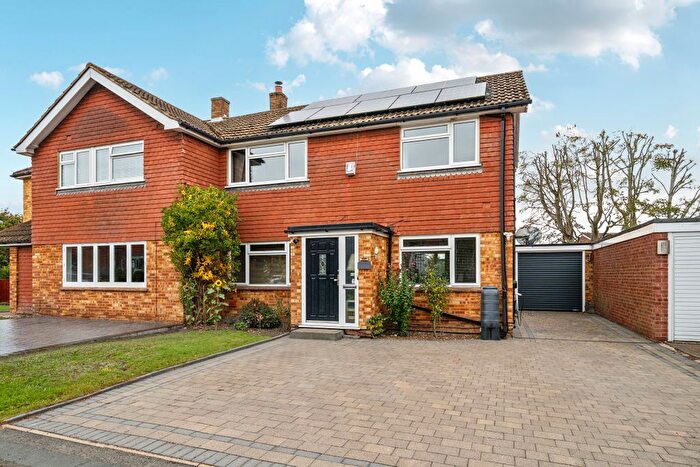
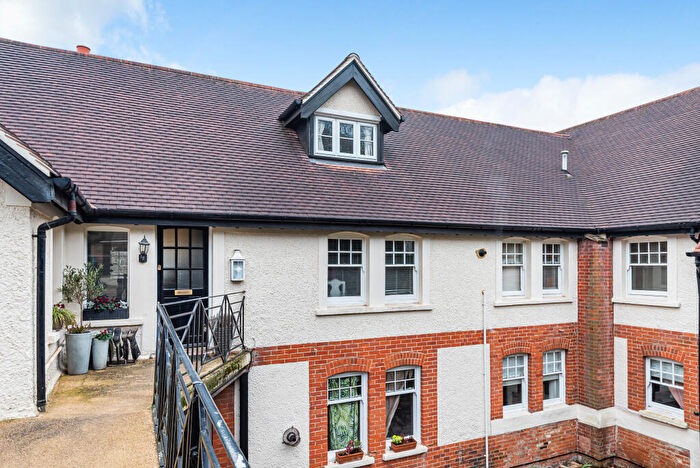
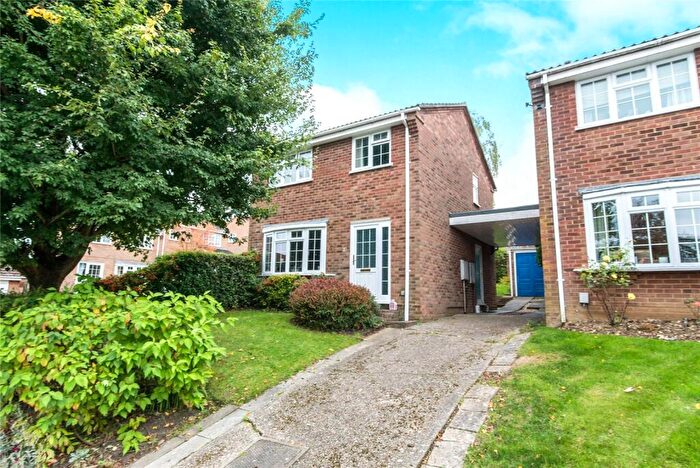
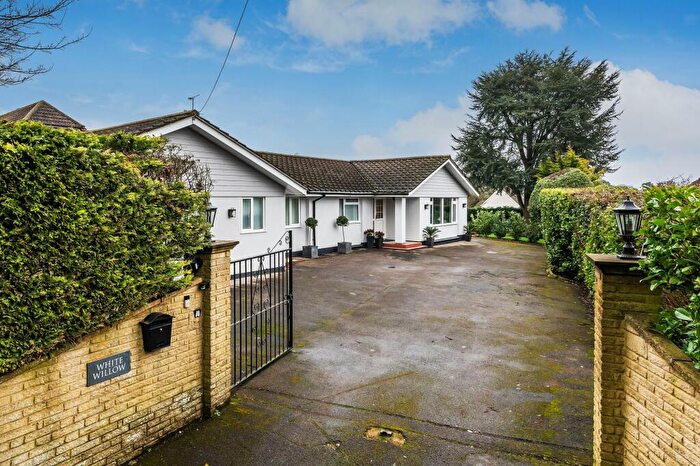
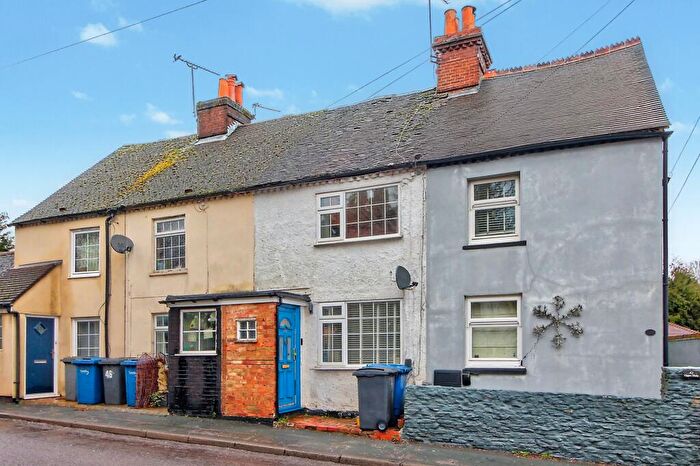
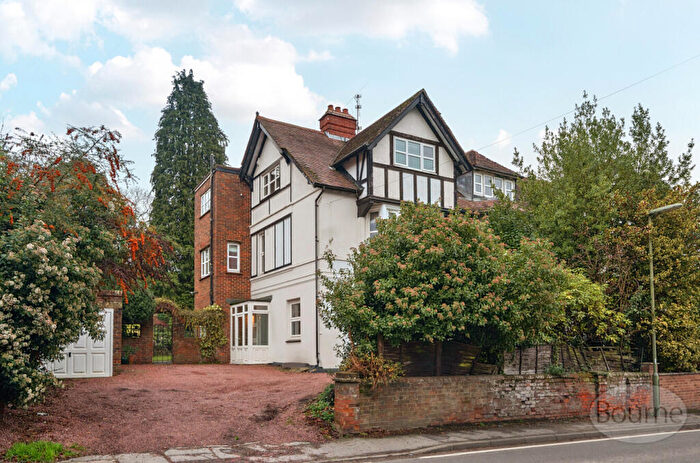
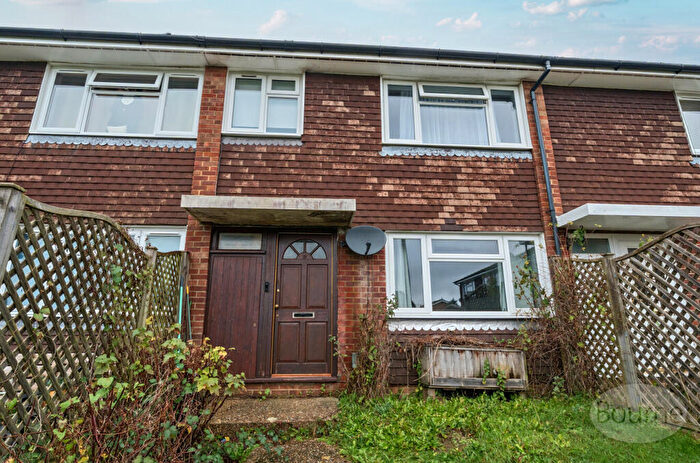
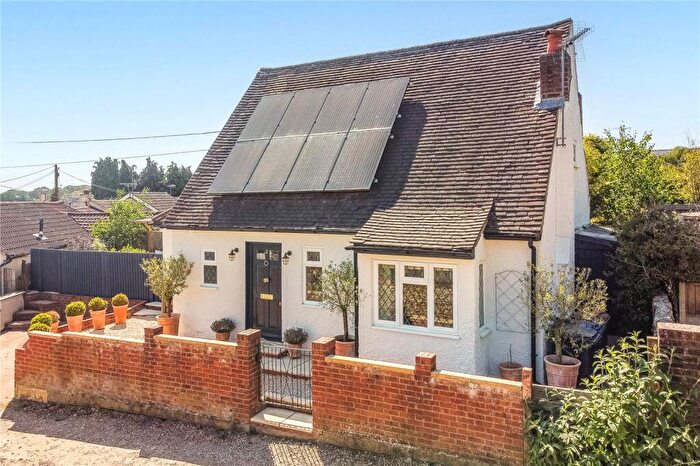
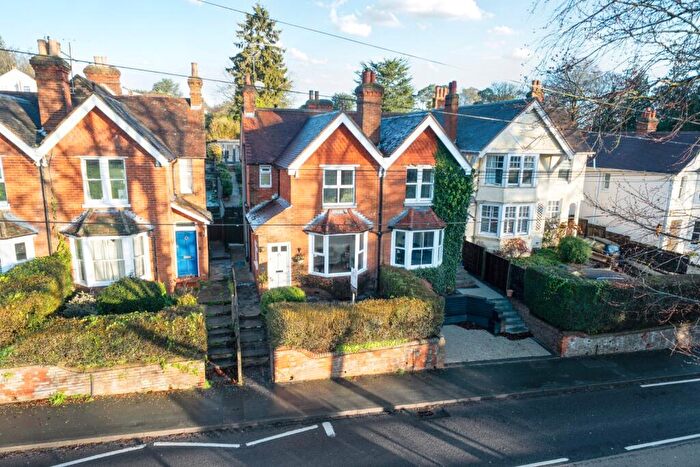
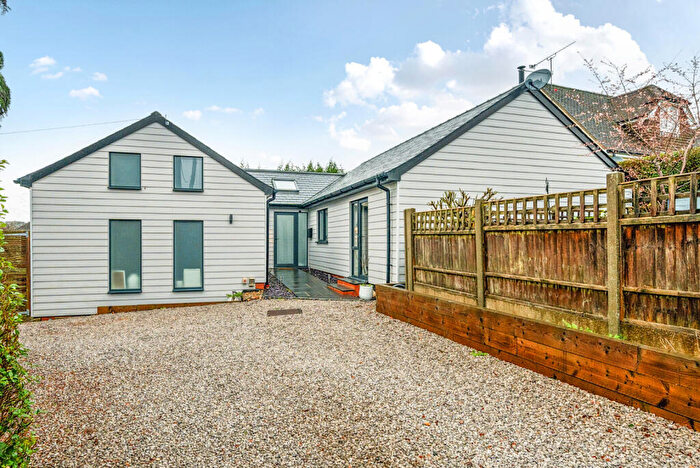
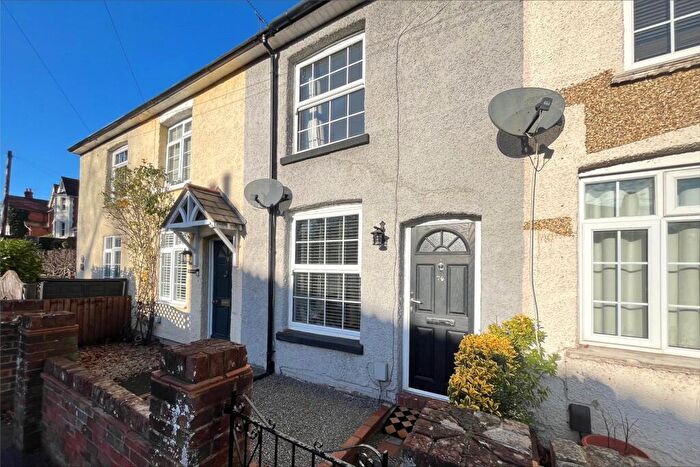
Houses for sale & to rent in Farnham Upper Hale, Farnham
House Prices in Farnham Upper Hale
Properties in Farnham Upper Hale have an average house price of £479,045.00 and had 130 Property Transactions within the last 3 years¹.
Farnham Upper Hale is an area in Farnham, Surrey with 1,687 households², where the most expensive property was sold for £1,409,000.00.
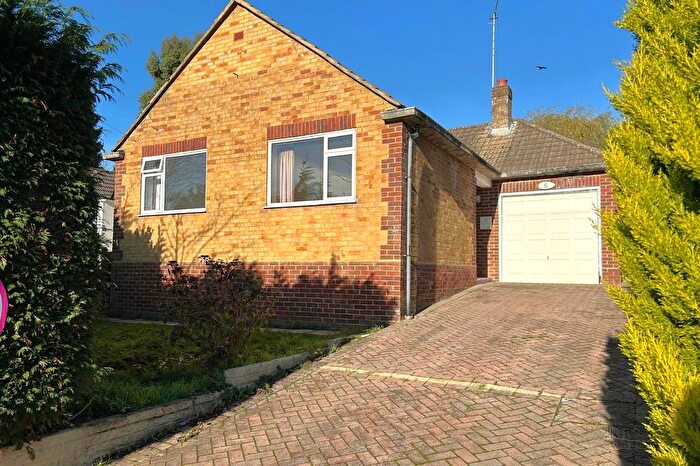
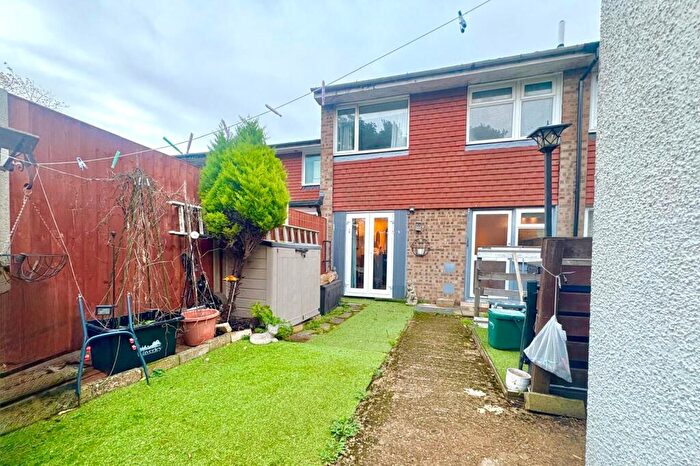
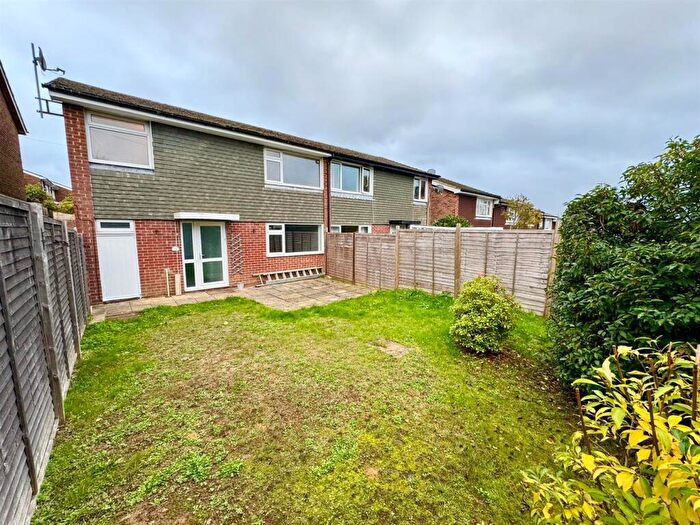
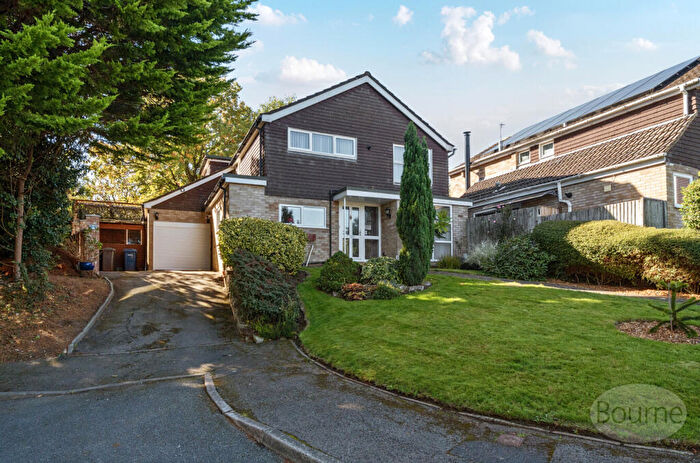
Properties for sale in Farnham Upper Hale
Previously listed properties in Farnham Upper Hale
Roads and Postcodes in Farnham Upper Hale
Navigate through our locations to find the location of your next house in Farnham Upper Hale, Farnham for sale or to rent.
| Streets | Postcodes |
|---|---|
| Alma Lane | GU9 0LP GU9 0LR GU9 0LT |
| Alwin Place | GU9 0RW |
| Ambleside Crescent | GU9 0RZ |
| Ball & Wicket Lane | GU9 0PD |
| Balmoral Crescent | GU9 0DN |
| Barrie Road | GU9 0DU |
| Beck Gardens | GU9 0SE |
| Bishop Sumner Drive | GU9 0HQ |
| Bishops Road | GU9 0JA |
| Blackheath Road | GU9 0DY GU9 0DZ |
| Blenheim Crescent | GU9 0DG |
| Brougham Place | GU9 0EB GU9 0ED |
| Chatsworth Grove | GU9 0DJ |
| Coniston Drive | GU9 0DA GU9 0DB |
| Derwent Close | GU9 0DD |
| Dukes Close | GU9 0DR |
| Dukes Walk | GU9 0BA |
| Ennerdale Grove | GU9 0RX |
| Eton Place | GU9 0EF GU9 0EG |
| Farnham Park Close | GU9 0HT |
| Farnham Park Drive | GU9 0HS |
| Fernhill Close | GU9 0JL |
| Fernhill Drive | GU9 0HR |
| Fernhill Lane | GU9 0JJ |
| Folly Hill | GU9 0AY GU9 0AZ GU9 0BB GU9 0BD GU9 0BH GU9 0BJ GU9 0BP GU9 0AX |
| Folly Lane North | GU9 0HU GU9 0HX |
| Folly Lane South | GU9 0BZ |
| Grasmere Road | GU9 0RU |
| Gravel Road | GU9 0JB GU9 0JT |
| Hampton Road | GU9 0DF GU9 0DL GU9 0DQ |
| Heathyfields Road | GU9 0BN GU9 0BW |
| Hereford Lane | GU9 0JQ |
| High Copse | GU9 0BL |
| Hillbrook Rise | GU9 0SF |
| Hoghatch Lane | GU9 0BY |
| Hope Lane | GU9 0HY GU9 0HZ |
| Lawday Link | GU9 0BS |
| Lawday Place | GU9 0AA |
| Lawday Place Lane | GU9 0BT |
| Levern Drive | GU9 0JR |
| Lyall Place | GU9 0EQ |
| Macdonald Road | GU9 0EH GU9 0EJ |
| Newmans Court | GU9 0SJ |
| Nutshell Lane | GU9 0FE GU9 0FF GU9 0HG GU9 0HH |
| Oak Trees | GU9 0HF |
| Odiham Road | GU10 5AD GU10 5AB |
| Old Park Close | GU9 0BE GU9 0BG GU9 0BQ |
| Old Park Lane | GU10 5AA |
| Parish Close | GU9 0SA |
| Parkside | GU9 0JP |
| Perry Way | GU9 0EY |
| Queens Lane | GU9 0LL GU9 0LU |
| Queens Road | GU9 0HP |
| Sandford Road | GU9 0EN |
| Sandy Hill Road | GU9 0DX GU9 0EA GU9 0EE GU9 0EL GU9 0ES GU9 0EW |
| Shady Nook | GU9 0DT |
| Spring Lane | GU9 0JD |
| Spring Lane West | GU9 0BU GU9 0BX |
| St Marks Place | GU9 0EU GU9 0EX |
| Sturt Road | GU9 0EP |
| Swift Road | GU9 0ER |
| The Green | GU9 0HJ GU9 0HL |
| Trinity Fields | GU9 0SB |
| Trinity Hill | GU9 0SD |
| Ullswater Close | GU9 0RY |
| Upper Hale Road | GU9 0JE GU9 0JF GU9 0JG GU9 0JH GU9 0JN GU9 0JW GU9 0PB |
| Upper Old Park Lane | GU9 0AR GU9 0AS GU9 0AT |
| Wellesley Garden | GU9 0JS |
| Windermere Way | GU9 0DE GU9 0DS |
| Windsor Crescent | GU9 0DH |
| Wings Close | GU9 0HE |
| Wings Road | GU9 0HN GU9 0HW |
Transport near Farnham Upper Hale
-
Farnham Station
-
Aldershot Station
-
Ash Station
-
Fleet Station
-
North Camp Station
-
Ash Vale Station
-
Bentley Station
-
Farnborough (Main) Station
- FAQ
- Price Paid By Year
- Property Type Price
Frequently asked questions about Farnham Upper Hale
What is the average price for a property for sale in Farnham Upper Hale?
The average price for a property for sale in Farnham Upper Hale is £479,045. This amount is 26% lower than the average price in Farnham. There are 546 property listings for sale in Farnham Upper Hale.
What streets have the most expensive properties for sale in Farnham Upper Hale?
The streets with the most expensive properties for sale in Farnham Upper Hale are Fernhill Lane at an average of £938,333, Folly Lane South at an average of £725,000 and Spring Lane at an average of £725,000.
What streets have the most affordable properties for sale in Farnham Upper Hale?
The streets with the most affordable properties for sale in Farnham Upper Hale are Swift Road at an average of £282,250, Brougham Place at an average of £282,900 and Sandy Hill Road at an average of £284,250.
Which train stations are available in or near Farnham Upper Hale?
Some of the train stations available in or near Farnham Upper Hale are Farnham, Aldershot and Ash.
Property Price Paid in Farnham Upper Hale by Year
The average sold property price by year was:
| Year | Average Sold Price | Price Change |
Sold Properties
|
|---|---|---|---|
| 2025 | £444,986 | -12% |
41 Properties |
| 2024 | £499,196 | 2% |
43 Properties |
| 2023 | £490,565 | 8% |
46 Properties |
| 2022 | £452,075 | -0,1% |
58 Properties |
| 2021 | £452,749 | -6% |
93 Properties |
| 2020 | £479,811 | 19% |
71 Properties |
| 2019 | £390,591 | 0,1% |
56 Properties |
| 2018 | £390,236 | -9% |
47 Properties |
| 2017 | £425,032 | 11% |
57 Properties |
| 2016 | £378,354 | 1% |
79 Properties |
| 2015 | £374,298 | 0,4% |
85 Properties |
| 2014 | £372,773 | 17% |
66 Properties |
| 2013 | £310,853 | -2% |
70 Properties |
| 2012 | £318,229 | 7% |
55 Properties |
| 2011 | £295,635 | 0,4% |
56 Properties |
| 2010 | £294,522 | 8% |
61 Properties |
| 2009 | £271,211 | 4% |
48 Properties |
| 2008 | £259,796 | 1% |
32 Properties |
| 2007 | £257,606 | -3% |
92 Properties |
| 2006 | £264,875 | 15% |
111 Properties |
| 2005 | £224,426 | 3% |
84 Properties |
| 2004 | £217,698 | -0,4% |
77 Properties |
| 2003 | £218,582 | 13% |
73 Properties |
| 2002 | £189,218 | -1% |
99 Properties |
| 2001 | £190,512 | 9% |
83 Properties |
| 2000 | £173,893 | 23% |
104 Properties |
| 1999 | £133,312 | 12% |
126 Properties |
| 1998 | £116,770 | 21% |
107 Properties |
| 1997 | £92,038 | 15% |
92 Properties |
| 1996 | £78,352 | -2% |
81 Properties |
| 1995 | £80,281 | - |
64 Properties |
Property Price per Property Type in Farnham Upper Hale
Here you can find historic sold price data in order to help with your property search.
The average Property Paid Price for specific property types in the last three years are:
| Property Type | Average Sold Price | Sold Properties |
|---|---|---|
| Semi Detached House | £471,276.00 | 38 Semi Detached Houses |
| Detached House | £670,565.00 | 45 Detached Houses |
| Terraced House | £308,476.00 | 43 Terraced Houses |
| Flat | £231,862.00 | 4 Flats |

