Houses for sale & to rent in Anglesey, Gosport
House Prices in Anglesey
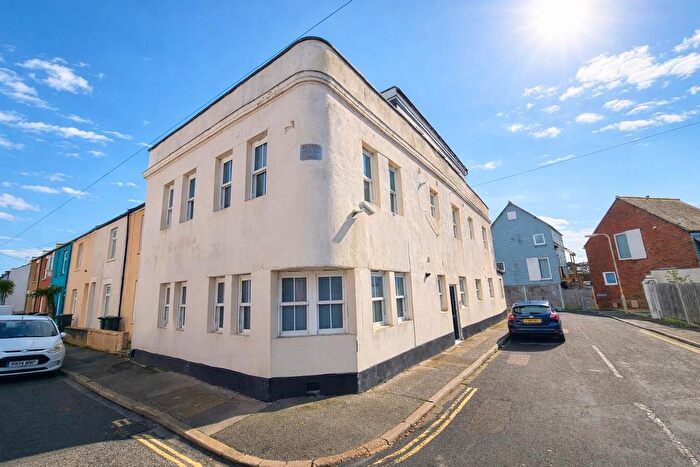
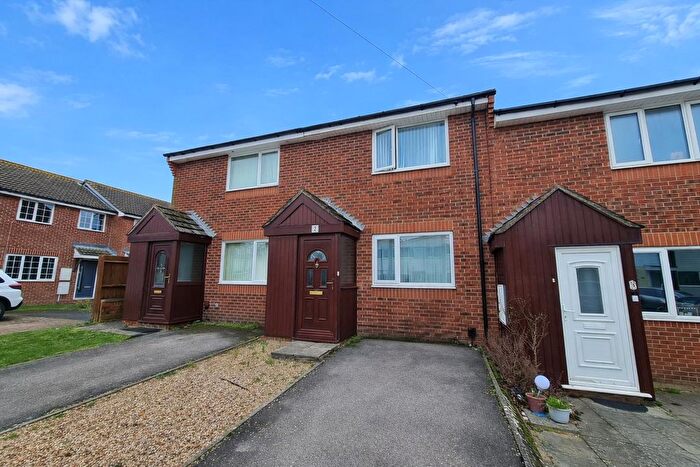
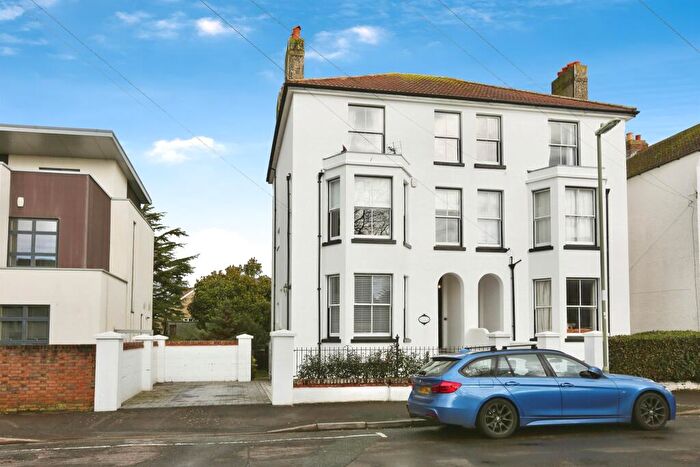
Properties in Anglesey have an average house price of £400,325.00 and had 148 Property Transactions within the last 3 years¹.
Anglesey is an area in Gosport, Hampshire with 1,529 households², where the most expensive property was sold for £1,225,000.00.
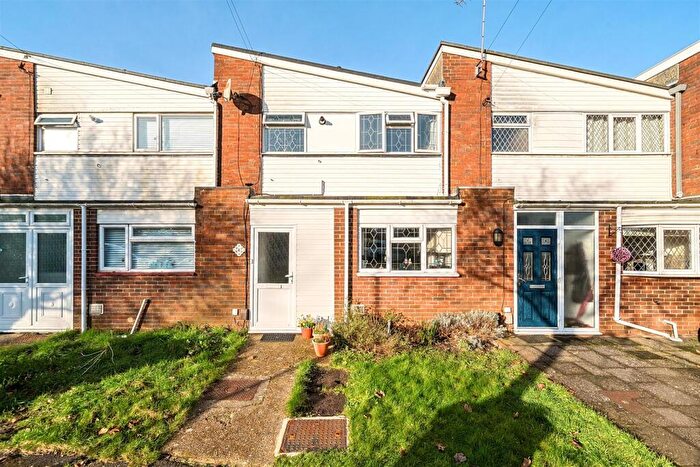
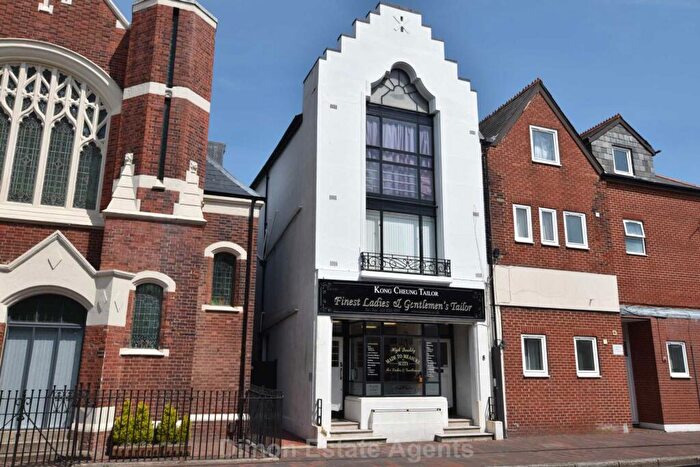
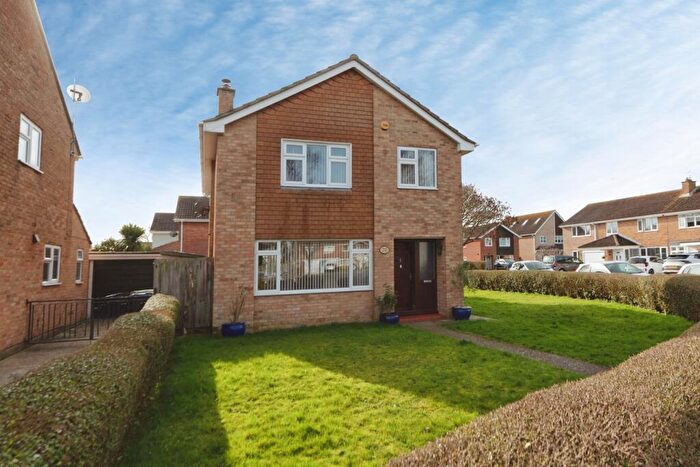
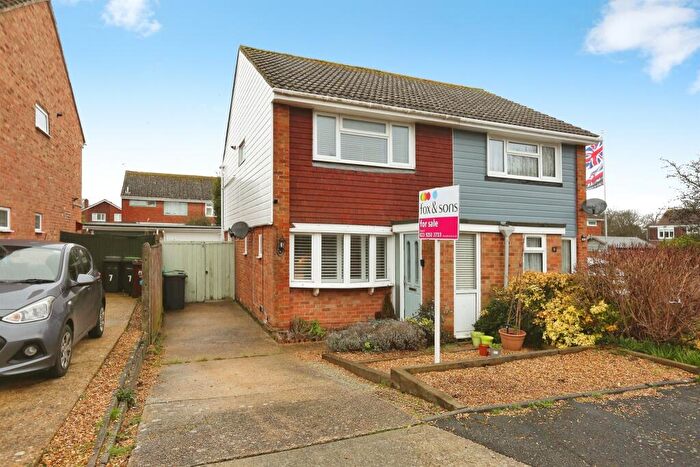
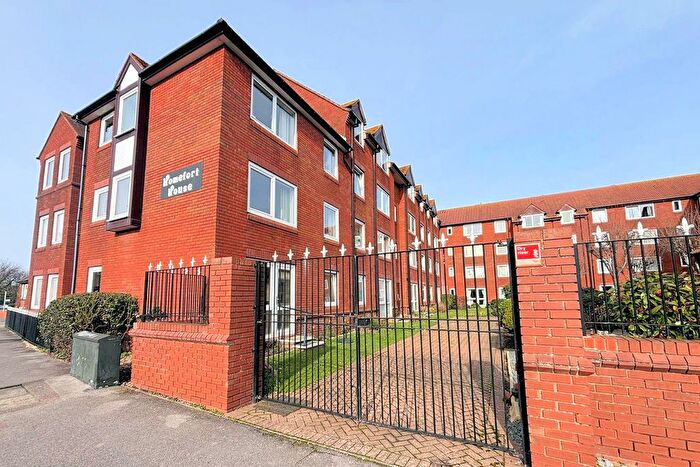
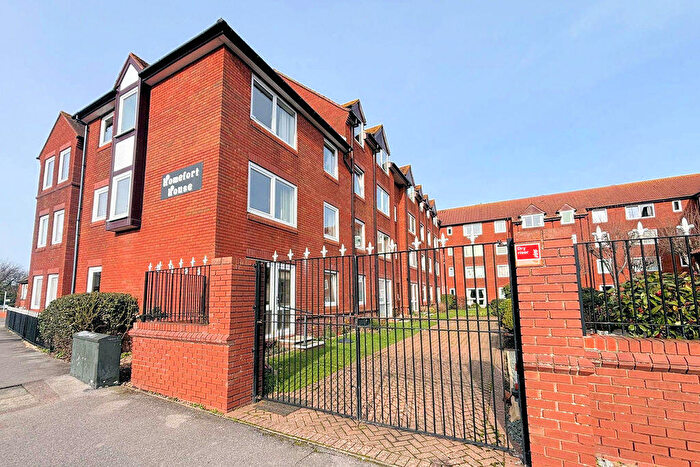
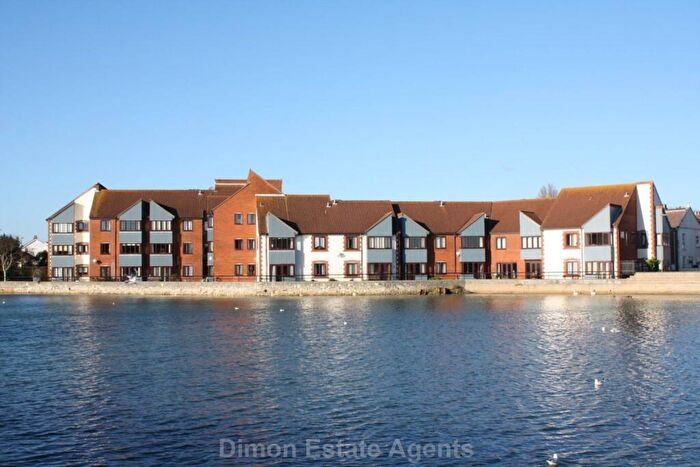
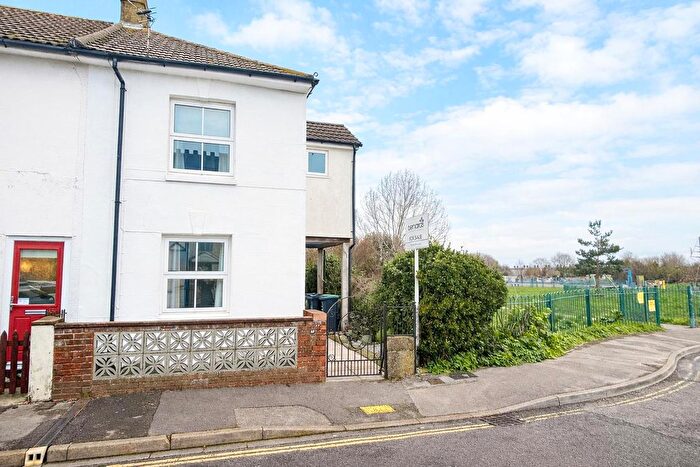
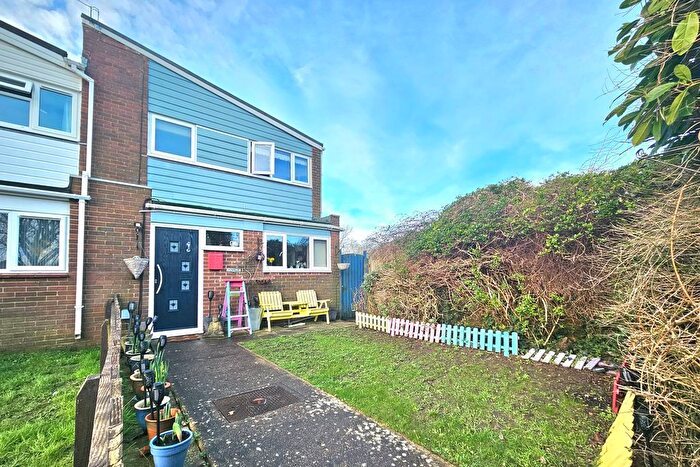
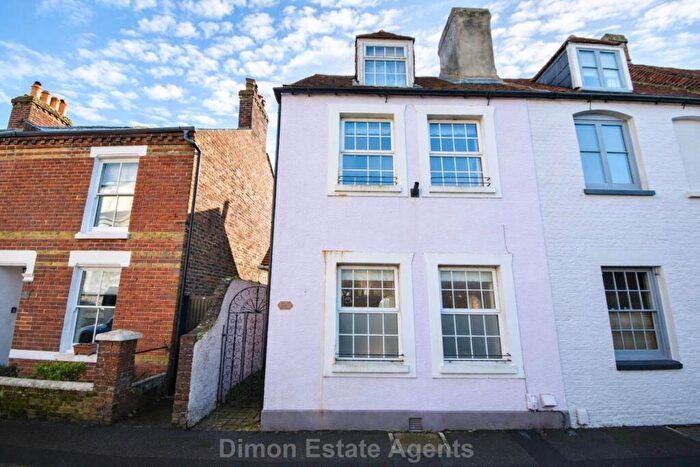
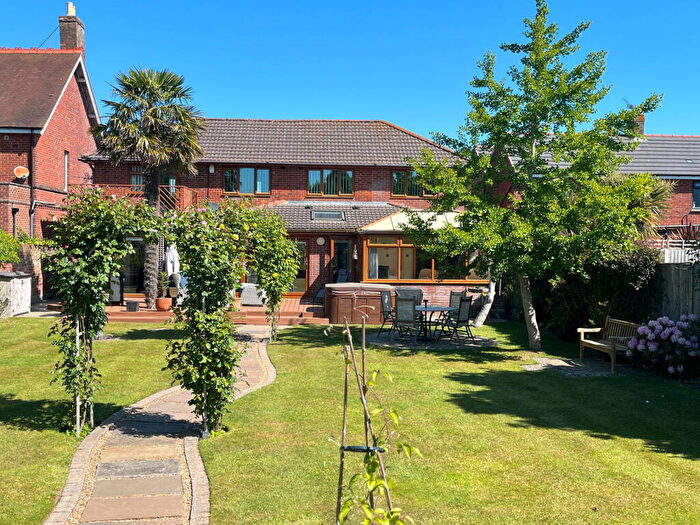
Properties for sale in Anglesey
Roads and Postcodes in Anglesey
Navigate through our locations to find the location of your next house in Anglesey, Gosport for sale or to rent.
| Streets | Postcodes |
|---|---|
| Alvara Road | PO12 2HY |
| Anglesey Arms Road | PO12 2DG |
| Anglesey Road | PO12 2EG PO12 2EH |
| Arminers Close | PO12 2HB |
| Ash Close | PO12 3UF |
| Atkinson Close | PO12 2BZ |
| Beechcroft Road | PO12 2EP PO12 2ER |
| Bentham Road | PO12 2HN PO12 2HW |
| Boldens Road | PO12 2DY PO12 2HA |
| Bramley Gardens | PO12 2DW |
| Brickets Terrace | PO12 2EA |
| Bury Road | PO12 3UD PO12 3UE PO12 3UH PO12 3US |
| Clayhall Road | PO12 2AH PO12 2AJ PO12 2AZ PO12 2BB PO12 2BY PO12 2EB |
| Constable Close | PO12 2UF |
| Crescent Road | PO12 2DH PO12 2DJ PO12 2DN PO12 2DL |
| Ellachie Gardens | PO12 2DS |
| Ellachie Mews | PO12 2DR |
| Ellachie Road | PO12 2DP |
| Fort Road | PO12 2AP PO12 2AR PO12 2BT PO12 2BU PO12 2DT PO12 2NJ |
| Foster Road | PO12 2JH PO12 2JJ |
| Friary Close | PO12 2EZ |
| Gilkicker Road | PO12 2UE PO12 2UN |
| Haselworth Drive | PO12 2UH |
| Haslar Jetty Road | PO12 2AS |
| Haslar Road | PO12 2AB PO12 2AG PO12 2AQ PO12 2AU PO12 2FE PO12 2FG |
| Haslar Technology Park | PO12 2DU |
| Haslar Terrace | PO12 2FA |
| Huxley Way | PO12 2FF |
| James Lind Avenue | PO12 2FB |
| Kennet Close | PO12 2DZ |
| Leep Lane | PO12 2BE |
| Lennox Close | PO12 2UJ |
| Lifeboat Lane | PO12 2TR |
| Lind Road | PO12 2UL |
| Linden Grove | PO12 2ED PO12 2EE |
| Little Anglesey Road | PO12 2HS PO12 2JA |
| Long Water Drive | PO12 2UP |
| Mabey Close | PO12 2AX |
| Military Road | PO12 2AT |
| Monckton Road | PO12 2BG PO12 2BQ |
| Nepean Close | PO12 2BH |
| Pepys Close | PO12 2BJ |
| Rectory Close | PO12 2HT |
| Sir John Richardson Avenue | PO12 2FD |
| Somervell Close | PO12 2BX |
| Spithead Avenue | PO12 2UW |
| St Francis Road | PO12 2UG |
| St Marks Close | PO12 2DB |
| St Marks Road | PO12 2DA |
| St Marys Avenue | PO12 2HU PO12 2HX |
| Stephenson Close | PO12 2JD |
| Testcombe Road | PO12 2EL |
| The Haven | PO12 2BD |
| The Lane | PO12 2DE |
| The Redan | PO12 2AY PO12 2BA PO12 2BS |
| The Rosery | PO12 2DD |
| Wakefield Place | PO12 2JT |
| Wakeley Drive | PO12 2FH |
| Waterloo Road | PO12 2AL |
| Wilberforce Road | PO12 2UQ |
Transport near Anglesey
- FAQ
- Price Paid By Year
- Property Type Price
Frequently asked questions about Anglesey
What is the average price for a property for sale in Anglesey?
The average price for a property for sale in Anglesey is £400,325. This amount is 62% higher than the average price in Gosport. There are 1,543 property listings for sale in Anglesey.
What streets have the most expensive properties for sale in Anglesey?
The streets with the most expensive properties for sale in Anglesey are St Marks Road at an average of £846,666, Atkinson Close at an average of £660,000 and Gilkicker Road at an average of £610,000.
What streets have the most affordable properties for sale in Anglesey?
The streets with the most affordable properties for sale in Anglesey are Ash Close at an average of £225,000, The Lane at an average of £227,500 and Arminers Close at an average of £255,000.
Which train stations are available in or near Anglesey?
Some of the train stations available in or near Anglesey are Portsmouth Harbour, Portsmouth and Southsea and Fratton.
Property Price Paid in Anglesey by Year
The average sold property price by year was:
| Year | Average Sold Price | Price Change |
Sold Properties
|
|---|---|---|---|
| 2025 | £394,366 | -8% |
49 Properties |
| 2024 | £424,410 | 11% |
56 Properties |
| 2023 | £375,750 | -15% |
43 Properties |
| 2022 | £433,154 | 16% |
50 Properties |
| 2021 | £363,769 | -1% |
83 Properties |
| 2020 | £368,161 | 12% |
59 Properties |
| 2019 | £324,620 | -3% |
49 Properties |
| 2018 | £332,870 | 1% |
54 Properties |
| 2017 | £328,435 | 7% |
62 Properties |
| 2016 | £306,279 | 7% |
66 Properties |
| 2015 | £285,211 | 2% |
70 Properties |
| 2014 | £278,853 | 11% |
71 Properties |
| 2013 | £248,584 | 4% |
49 Properties |
| 2012 | £239,411 | -6% |
52 Properties |
| 2011 | £253,722 | -6% |
40 Properties |
| 2010 | £267,707 | 14% |
55 Properties |
| 2009 | £229,635 | -11% |
55 Properties |
| 2008 | £254,871 | 18% |
39 Properties |
| 2007 | £208,755 | -9% |
74 Properties |
| 2006 | £227,729 | 9% |
90 Properties |
| 2005 | £206,192 | -11% |
67 Properties |
| 2004 | £228,421 | 13% |
77 Properties |
| 2003 | £198,322 | 18% |
69 Properties |
| 2002 | £161,978 | 15% |
88 Properties |
| 2001 | £137,501 | 8% |
71 Properties |
| 2000 | £126,061 | 13% |
69 Properties |
| 1999 | £109,449 | 19% |
90 Properties |
| 1998 | £88,110 | 10% |
90 Properties |
| 1997 | £79,333 | -3% |
96 Properties |
| 1996 | £81,513 | 3% |
82 Properties |
| 1995 | £78,739 | - |
62 Properties |
Property Price per Property Type in Anglesey
Here you can find historic sold price data in order to help with your property search.
The average Property Paid Price for specific property types in the last three years are:
| Property Type | Average Sold Price | Sold Properties |
|---|---|---|
| Semi Detached House | £383,952.00 | 48 Semi Detached Houses |
| Detached House | £584,452.00 | 40 Detached Houses |
| Terraced House | £318,827.00 | 41 Terraced Houses |
| Flat | £229,921.00 | 19 Flats |

