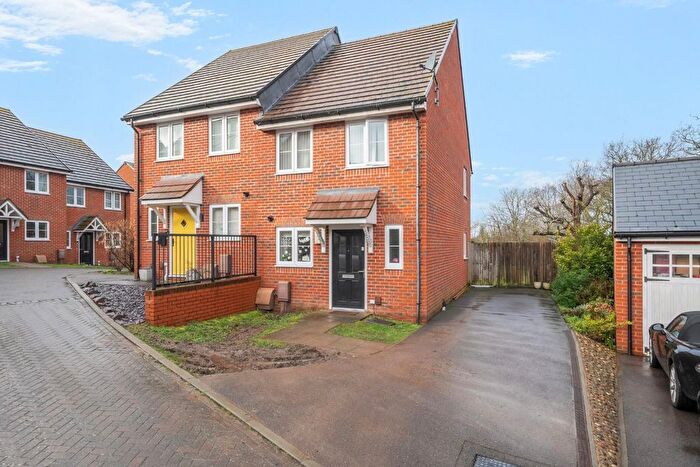
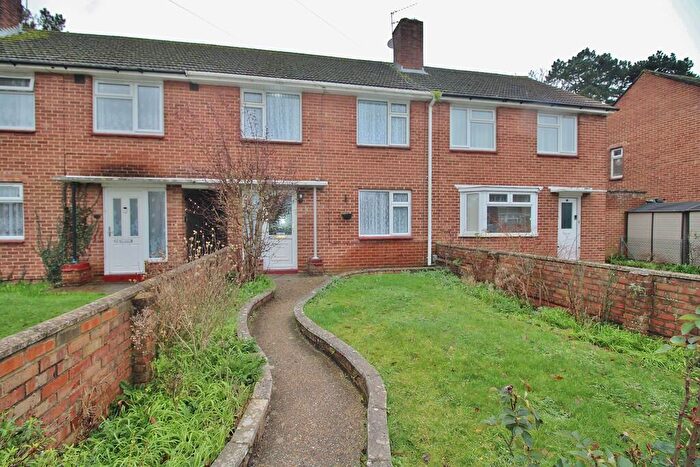
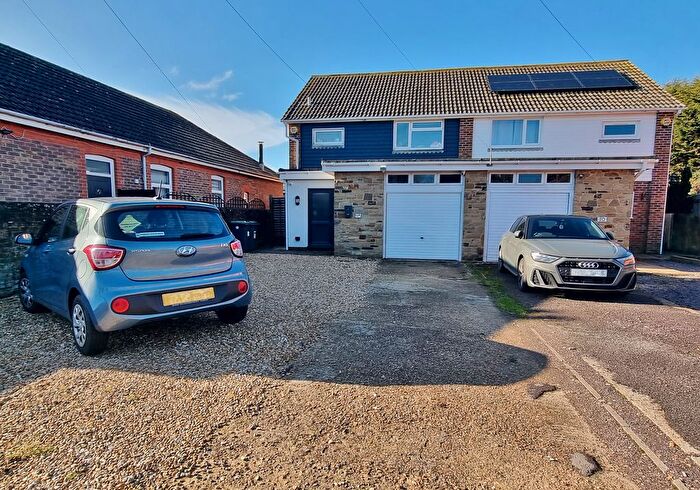
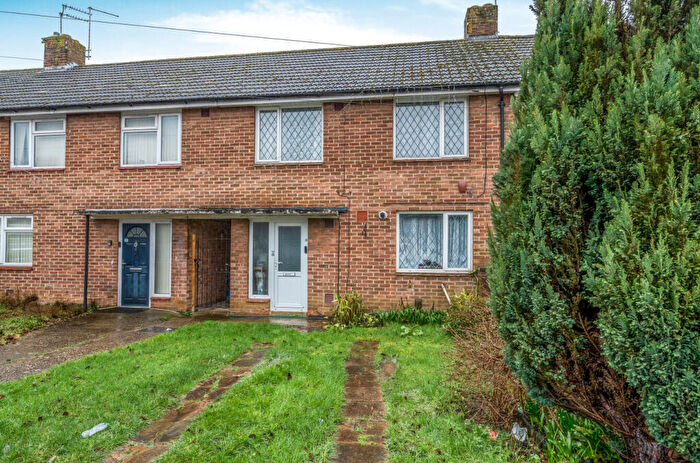
Houses for sale & to rent in Havant, Hampshire
House Prices in Havant
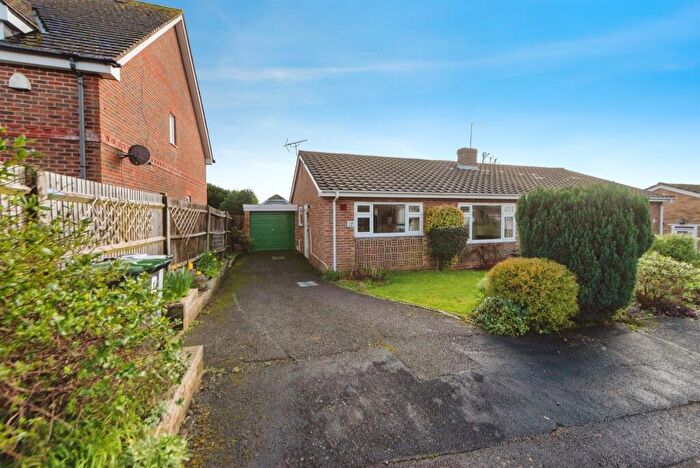
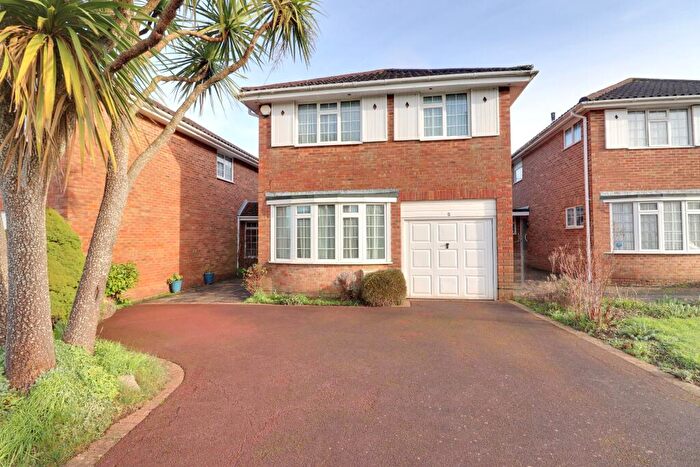
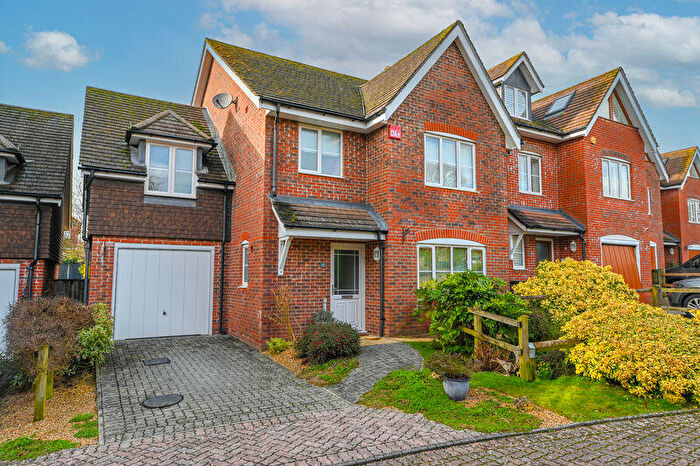
Properties in Havant have an average house price of £301,014.00 and had 1,514 Property Transactions within the last 3 years.¹
Havant is an area in Hampshire with 18,831 households², where the most expensive property was sold for £1,700,000.00.
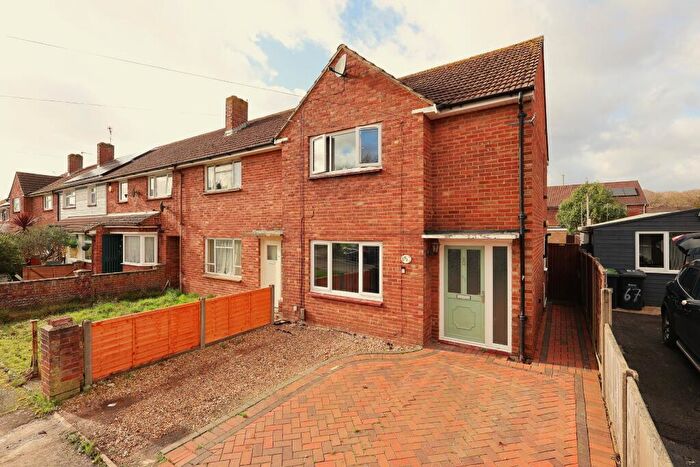
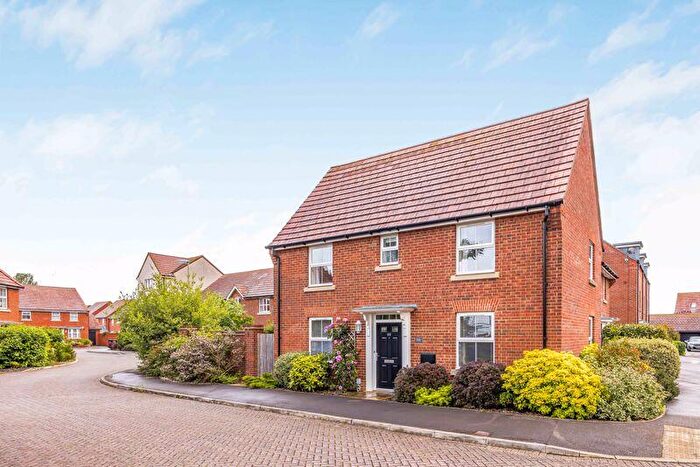
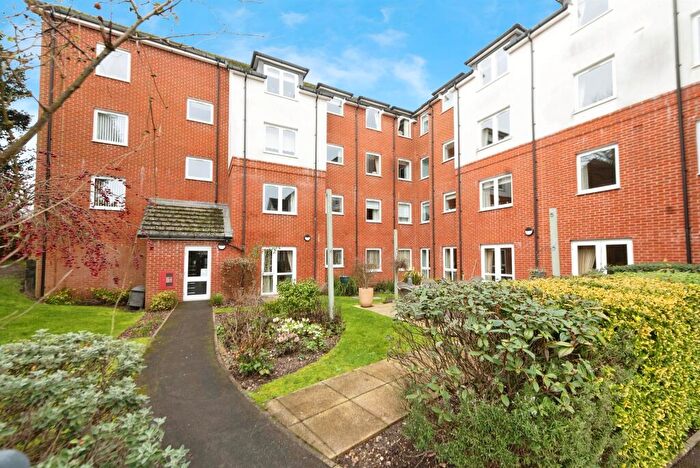
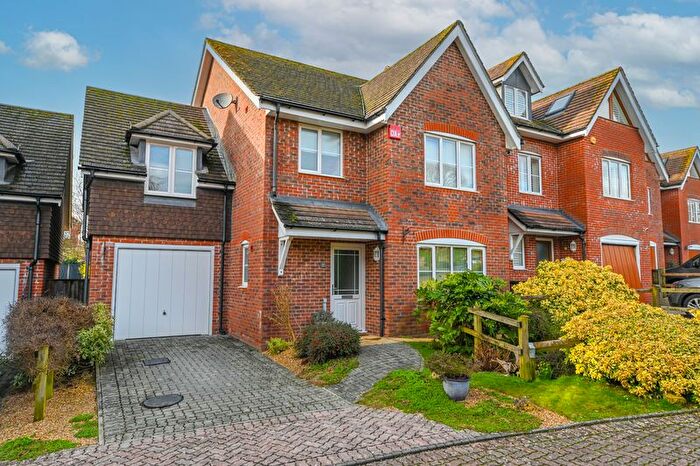
Properties for sale in Havant
Neighbourhoods in Havant
Navigate through our locations to find the location of your next house in Havant, Hampshire for sale or to rent.
Transport in Havant
Please see below transportation links in this area:
- FAQ
- Price Paid By Year
- Property Type Price
Frequently asked questions about Havant
What is the average price for a property for sale in Havant?
The average price for a property for sale in Havant is £301,014. This amount is 28% lower than the average price in Hampshire. There are more than 10,000 property listings for sale in Havant.
What locations have the most expensive properties for sale in Havant?
The locations with the most expensive properties for sale in Havant are St Faiths at an average of £366,280, Rowlands Castle at an average of £360,000 and Bedhampton at an average of £343,515.
What locations have the most affordable properties for sale in Havant?
The locations with the most affordable properties for sale in Havant are Warren Park at an average of £232,207, Battins at an average of £239,085 and Bondfields at an average of £243,850.
Which train stations are available in or near Havant?
Some of the train stations available in or near Havant are Havant, Bedhampton and Warblington.
Property Price Paid in Havant by Year
The average sold property price by year was:
| Year | Average Sold Price | Price Change |
Sold Properties
|
|---|---|---|---|
| 2025 | £303,723 | 0,3% |
466 Properties |
| 2024 | £302,847 | 2% |
536 Properties |
| 2023 | £296,629 | -6% |
512 Properties |
| 2022 | £313,960 | 9% |
624 Properties |
| 2021 | £286,066 | 5% |
778 Properties |
| 2020 | £272,947 | 8% |
530 Properties |
| 2019 | £250,052 | -4% |
622 Properties |
| 2018 | £259,087 | 4% |
630 Properties |
| 2017 | £249,655 | 3% |
718 Properties |
| 2016 | £242,474 | 7% |
809 Properties |
| 2015 | £226,078 | 8% |
833 Properties |
| 2014 | £208,753 | 12% |
658 Properties |
| 2013 | £184,614 | 4% |
543 Properties |
| 2012 | £177,441 | -2% |
445 Properties |
| 2011 | £180,218 | -1% |
422 Properties |
| 2010 | £182,020 | 7% |
431 Properties |
| 2009 | £169,478 | -3% |
494 Properties |
| 2008 | £174,141 | -5% |
439 Properties |
| 2007 | £182,115 | 2% |
811 Properties |
| 2006 | £179,294 | 10% |
862 Properties |
| 2005 | £161,870 | 4% |
622 Properties |
| 2004 | £155,647 | 11% |
695 Properties |
| 2003 | £138,755 | 13% |
714 Properties |
| 2002 | £121,077 | 16% |
711 Properties |
| 2001 | £102,180 | 6% |
698 Properties |
| 2000 | £96,083 | 10% |
667 Properties |
| 1999 | £86,177 | 10% |
773 Properties |
| 1998 | £77,342 | 10% |
798 Properties |
| 1997 | £69,592 | 14% |
795 Properties |
| 1996 | £59,970 | 2% |
576 Properties |
| 1995 | £58,925 | - |
525 Properties |
Property Price per Property Type in Havant
Here you can find historic sold price data in order to help with your property search.
The average Property Paid Price for specific property types in the last three years are:
| Property Type | Average Sold Price | Sold Properties |
|---|---|---|
| Semi Detached House | £315,346.00 | 445 Semi Detached Houses |
| Terraced House | £262,304.00 | 596 Terraced Houses |
| Detached House | £540,654.00 | 219 Detached Houses |
| Flat | £160,117.00 | 254 Flats |

