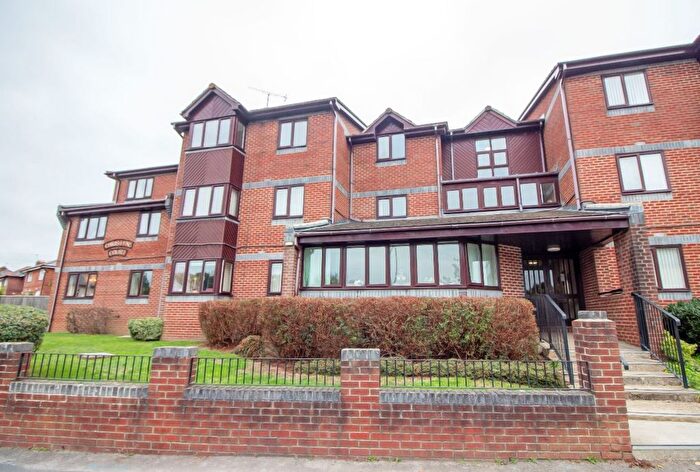
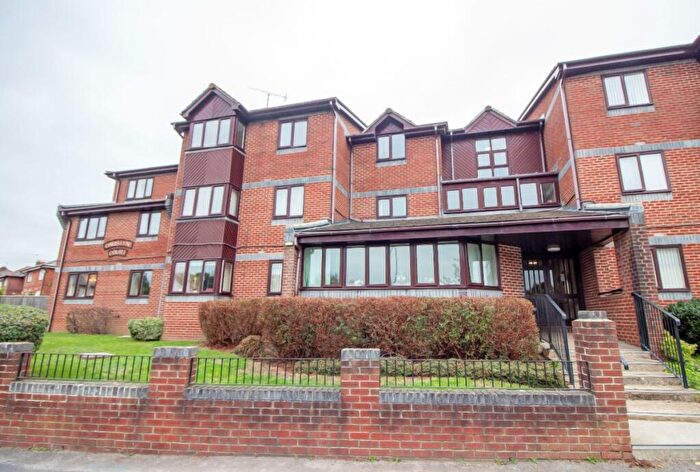
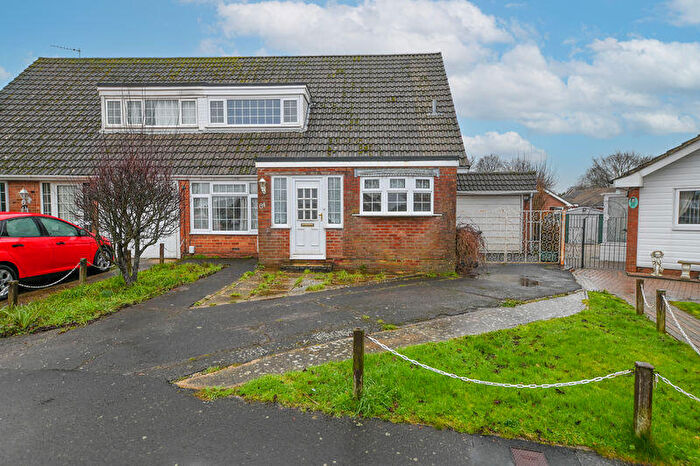
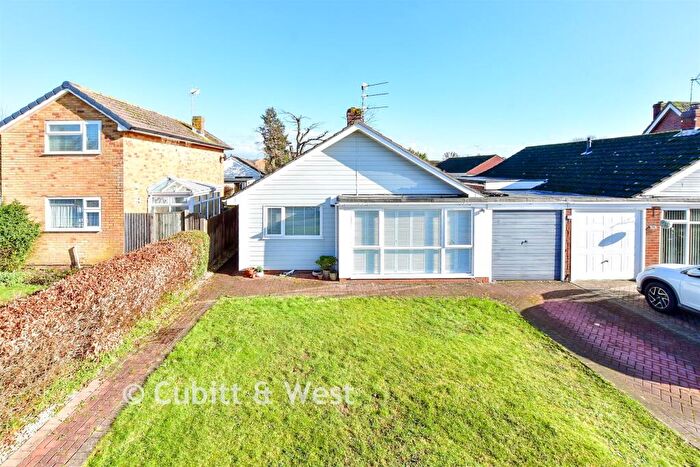
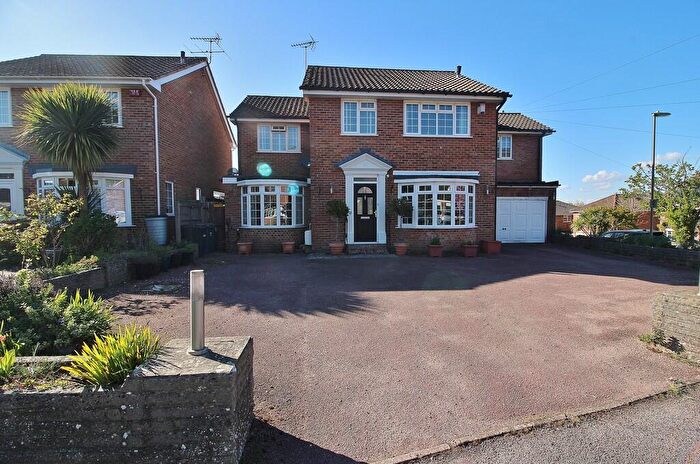
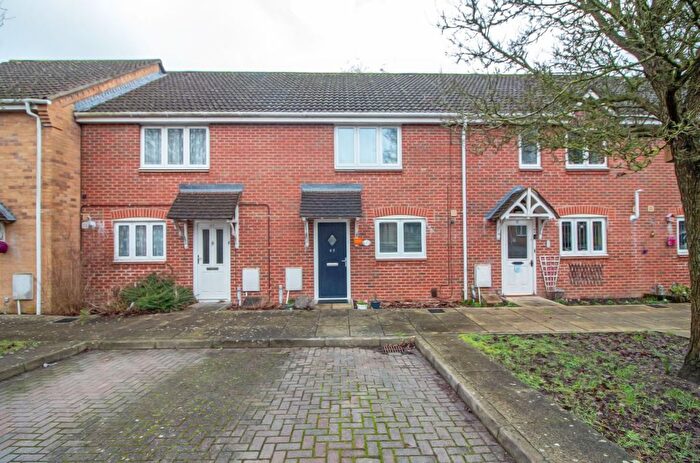
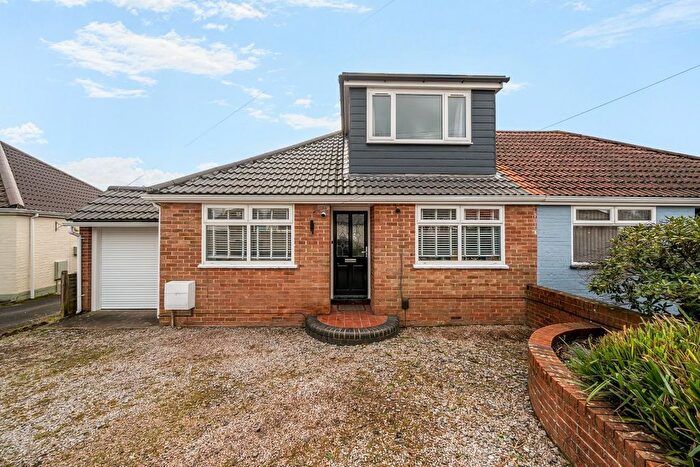
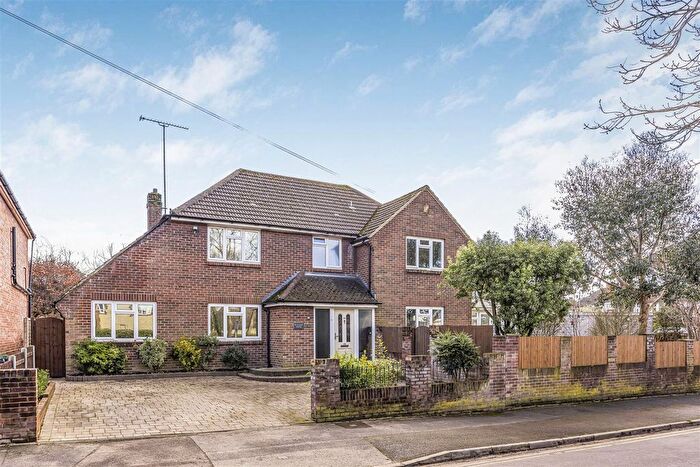
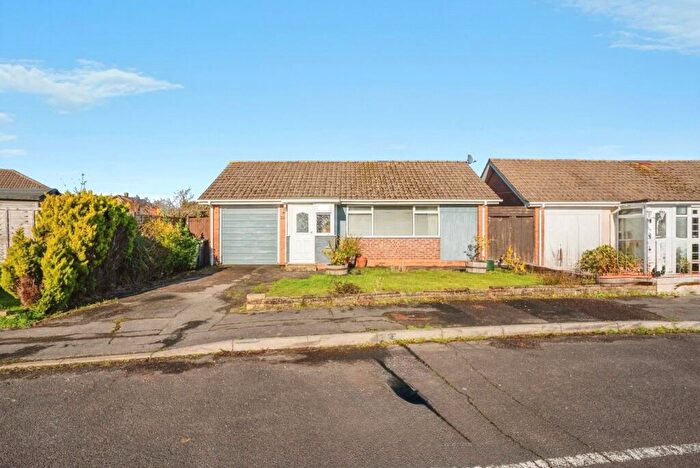
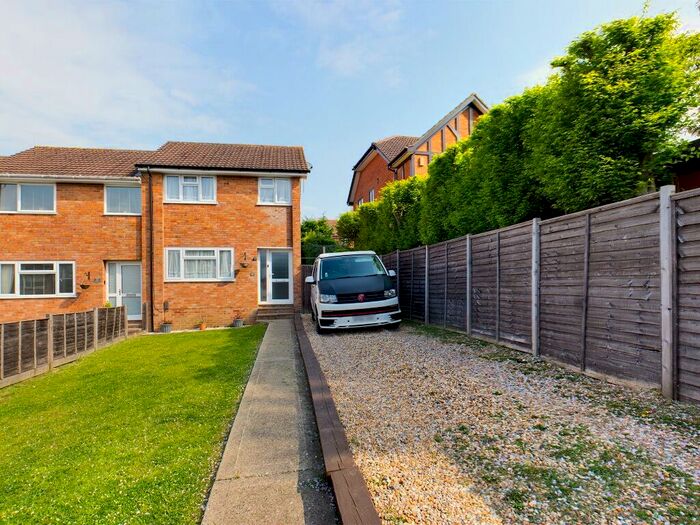
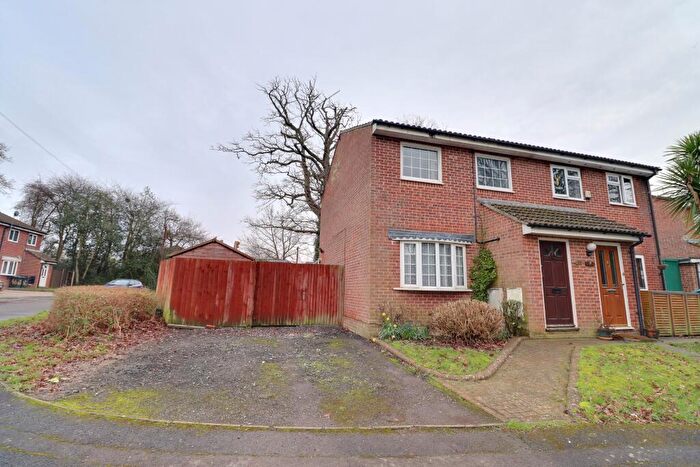
Houses for sale & to rent in Waterlooville, Hampshire
House Prices in Waterlooville
Properties in Waterlooville have an average house price of £368,747.00 and had 2,970 Property Transactions within the last 3 years.¹
Waterlooville is an area in Hampshire with 30,675 households², where the most expensive property was sold for £3,450,000.00.
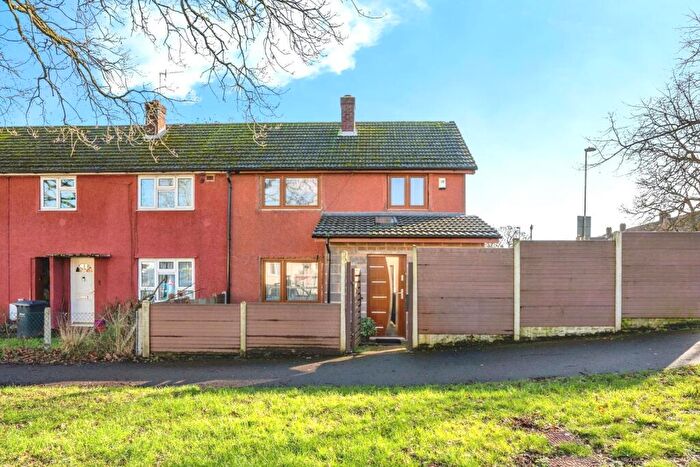
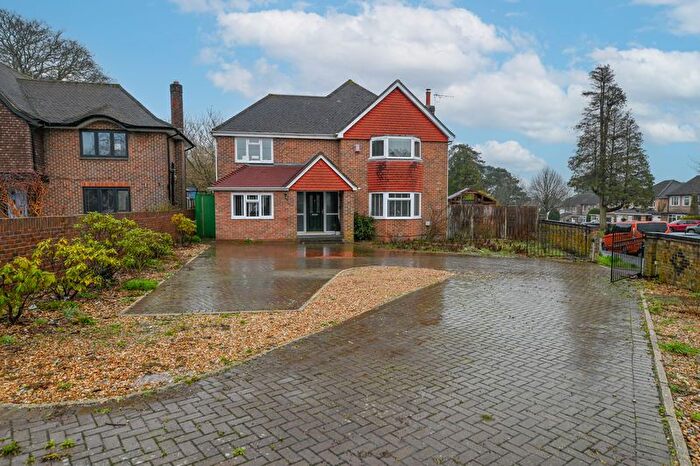
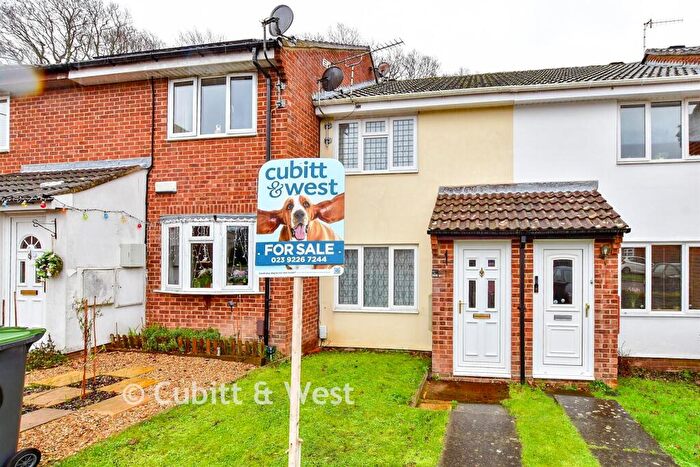
Properties for sale in Waterlooville
Neighbourhoods in Waterlooville
Navigate through our locations to find the location of your next house in Waterlooville, Hampshire for sale or to rent.
- Boarhunt And Southwick
- Clanfield And Finchdean
- Cowplain
- Denmead
- Droxford, Soberton And Hambledon
- East Meon
- Hart Plain
- Horndean Catherington And Lovedean
- Horndean Downs
- Horndean Hazleton And Blendworth
- Horndean Kings
- Horndean Murray
- Purbrook
- Stakes
- Swanmore And Newtown
- Waterloo
- Southwick and Wickham
- Central Meon Valley
- Horndean Kings & Blendworth
- Horndean Catherington
- Clanfield
- Buriton & East Meon
Transport in Waterlooville
Please see below transportation links in this area:
-
Rowland's Castle Station
-
Bedhampton Station
-
Havant Station
-
Warblington Station
-
Cosham Station
-
Hilsea Station
-
Emsworth Station
- FAQ
- Price Paid By Year
- Property Type Price
Frequently asked questions about Waterlooville
What is the average price for a property for sale in Waterlooville?
The average price for a property for sale in Waterlooville is £368,747. This amount is 12% lower than the average price in Hampshire. There are more than 10,000 property listings for sale in Waterlooville.
What locations have the most expensive properties for sale in Waterlooville?
The locations with the most expensive properties for sale in Waterlooville are Central Meon Valley at an average of £1,550,000, Swanmore And Newtown at an average of £1,342,500 and Droxford, Soberton And Hambledon at an average of £747,220.
What locations have the most affordable properties for sale in Waterlooville?
The locations with the most affordable properties for sale in Waterlooville are Horndean Kings & Blendworth at an average of £260,582, Stakes at an average of £315,081 and Hart Plain at an average of £316,719.
Which train stations are available in or near Waterlooville?
Some of the train stations available in or near Waterlooville are Rowland's Castle, Bedhampton and Havant.
Property Price Paid in Waterlooville by Year
The average sold property price by year was:
| Year | Average Sold Price | Price Change |
Sold Properties
|
|---|---|---|---|
| 2025 | £373,457 | 2% |
946 Properties |
| 2024 | £366,675 | 0,1% |
1,132 Properties |
| 2023 | £366,382 | -1% |
892 Properties |
| 2022 | £369,292 | 7% |
1,256 Properties |
| 2021 | £344,686 | 5% |
1,643 Properties |
| 2020 | £325,964 | 4% |
1,122 Properties |
| 2019 | £311,957 | 2% |
1,384 Properties |
| 2018 | £306,846 | 1% |
1,411 Properties |
| 2017 | £303,746 | 8% |
1,421 Properties |
| 2016 | £279,417 | 4% |
1,597 Properties |
| 2015 | £269,096 | 6% |
1,611 Properties |
| 2014 | £252,725 | 9% |
1,606 Properties |
| 2013 | £230,353 | 3% |
1,329 Properties |
| 2012 | £223,314 | 1% |
974 Properties |
| 2011 | £221,743 | -3% |
941 Properties |
| 2010 | £228,206 | 9% |
959 Properties |
| 2009 | £208,099 | -7% |
892 Properties |
| 2008 | £222,199 | -3% |
787 Properties |
| 2007 | £229,369 | 8% |
1,519 Properties |
| 2006 | £210,223 | 2% |
1,597 Properties |
| 2005 | £205,278 | 2% |
1,243 Properties |
| 2004 | £201,337 | 12% |
1,695 Properties |
| 2003 | £176,363 | 14% |
1,525 Properties |
| 2002 | £150,926 | 14% |
1,815 Properties |
| 2001 | £129,487 | 11% |
1,643 Properties |
| 2000 | £115,079 | 17% |
1,532 Properties |
| 1999 | £96,026 | 9% |
1,869 Properties |
| 1998 | £87,325 | 11% |
1,554 Properties |
| 1997 | £77,528 | 6% |
1,652 Properties |
| 1996 | £72,706 | 4% |
1,497 Properties |
| 1995 | £70,110 | - |
1,327 Properties |
Property Price per Property Type in Waterlooville
Here you can find historic sold price data in order to help with your property search.
The average Property Paid Price for specific property types in the last three years are:
| Property Type | Average Sold Price | Sold Properties |
|---|---|---|
| Semi Detached House | £354,108.00 | 920 Semi Detached Houses |
| Terraced House | £289,071.00 | 677 Terraced Houses |
| Detached House | £507,220.00 | 1,012 Detached Houses |
| Flat | £167,293.00 | 361 Flats |

