Houses for sale & to rent in Bramley And Sherfield, Hook
House Prices in Bramley And Sherfield
Properties in Bramley And Sherfield have an average house price of £531,533.00 and had 45 Property Transactions within the last 3 years¹.
Bramley And Sherfield is an area in Hook, Hampshire with 615 households², where the most expensive property was sold for £1,955,000.00.
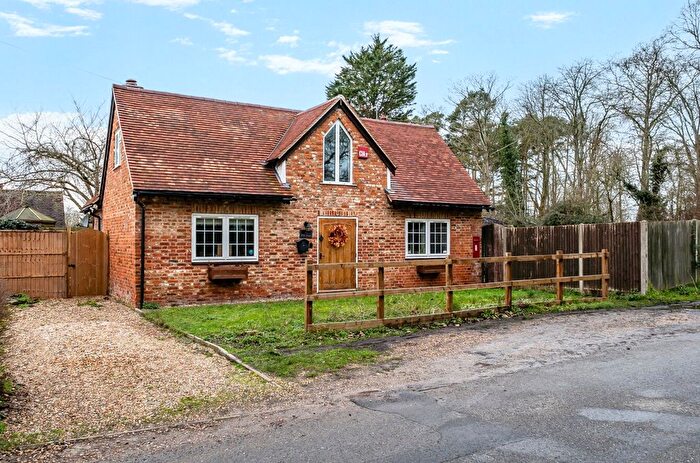
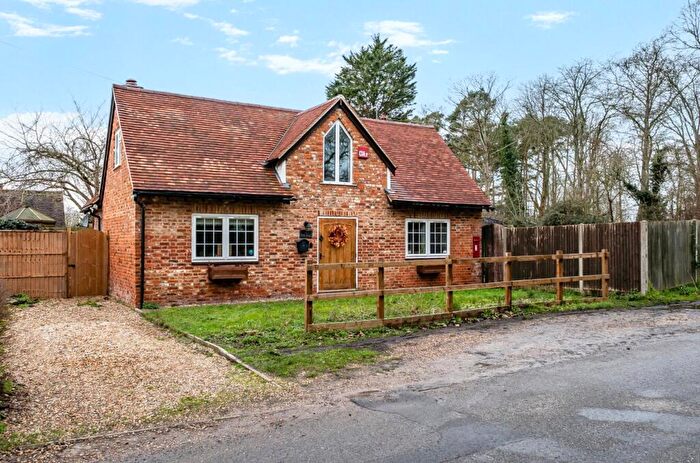
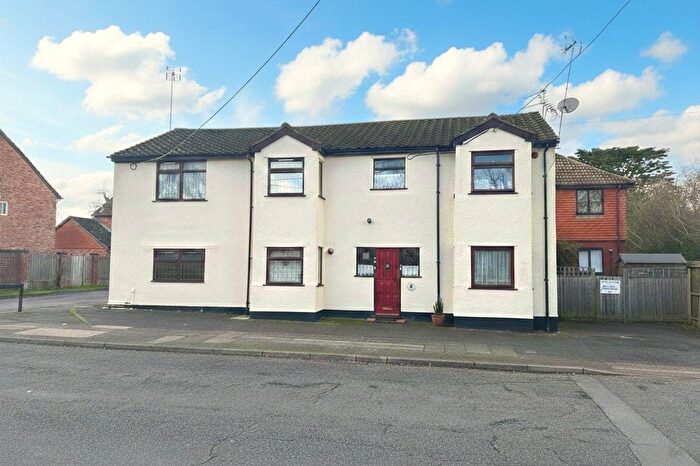
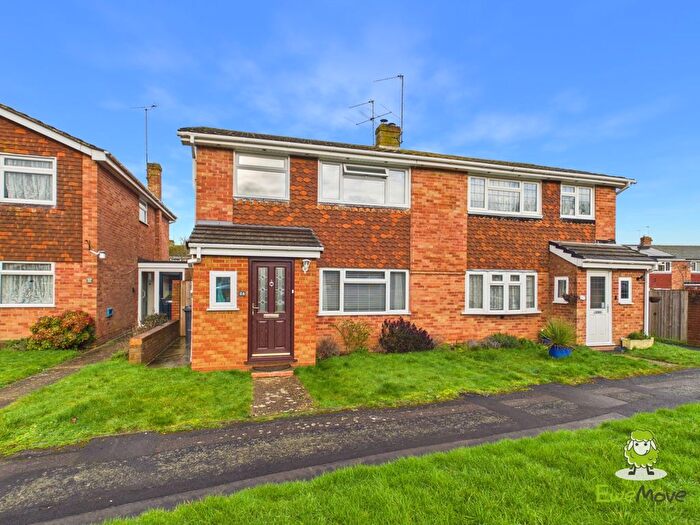
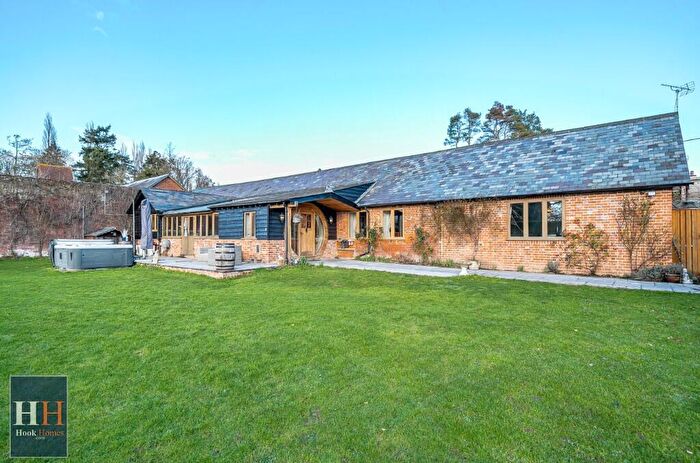
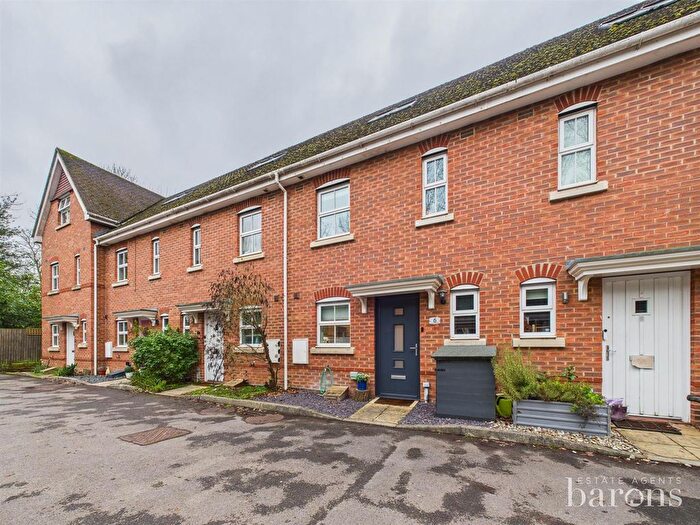
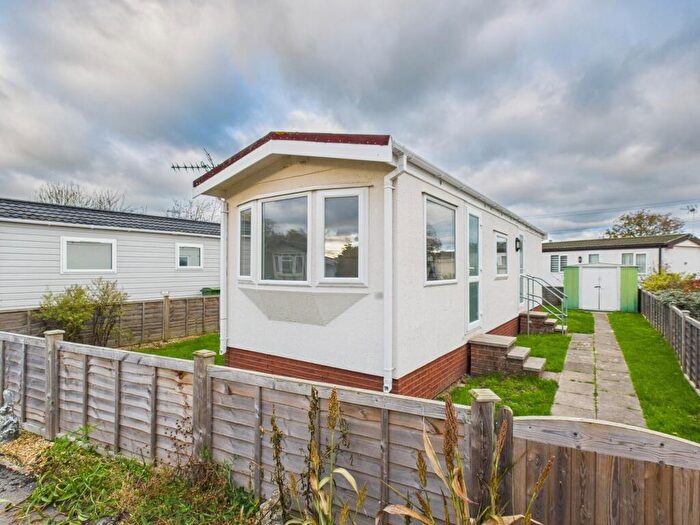
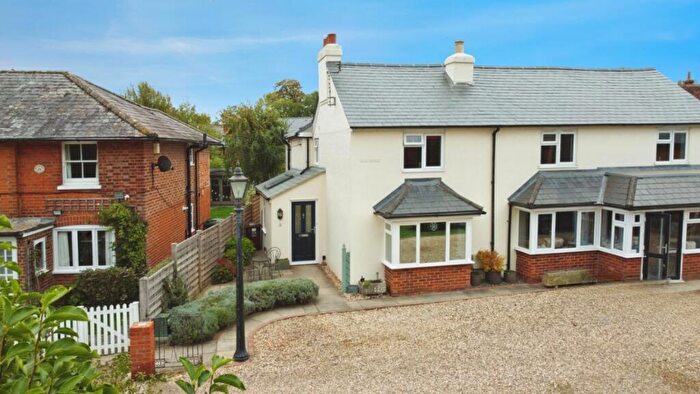
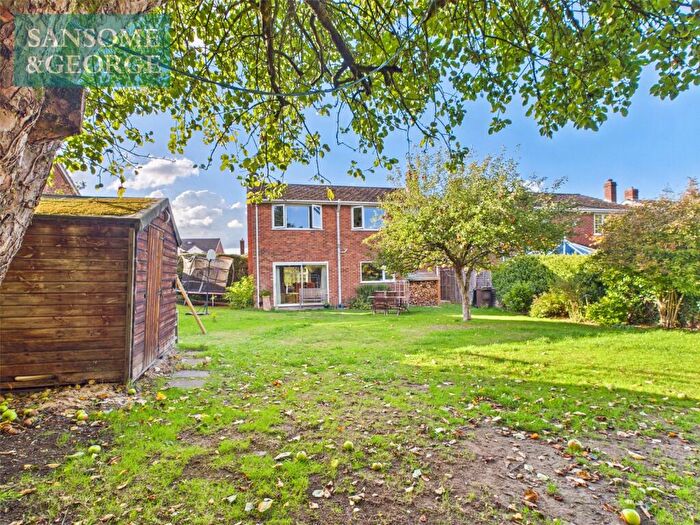
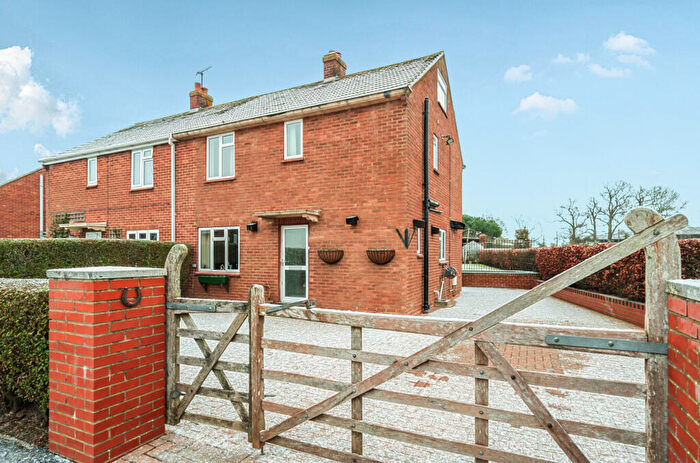
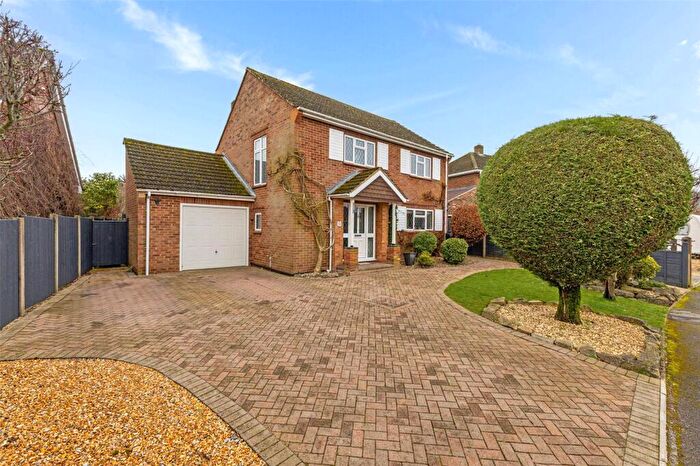
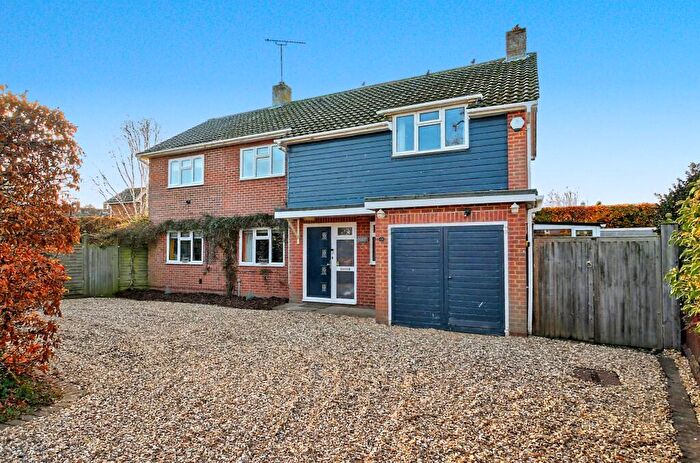
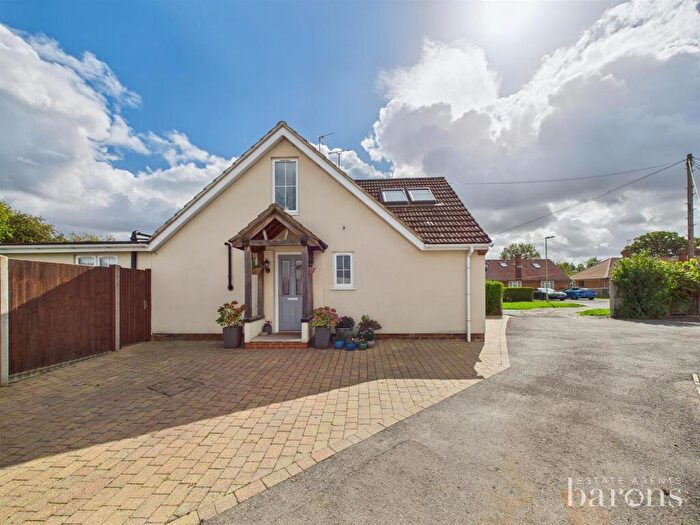
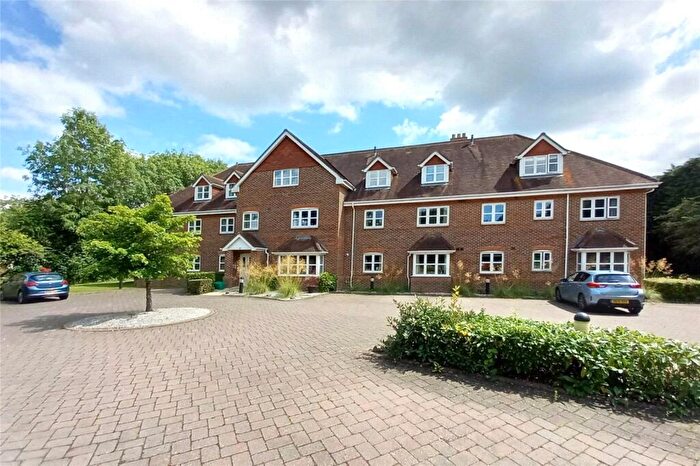
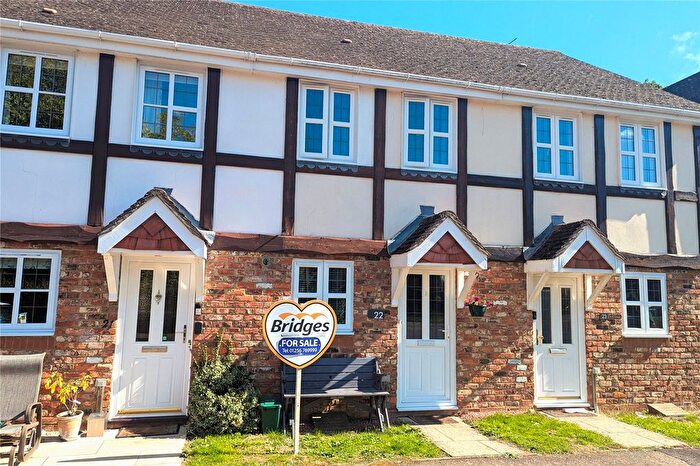
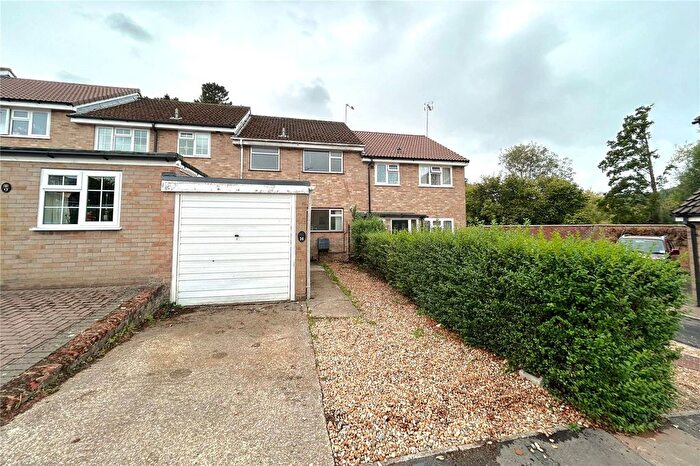
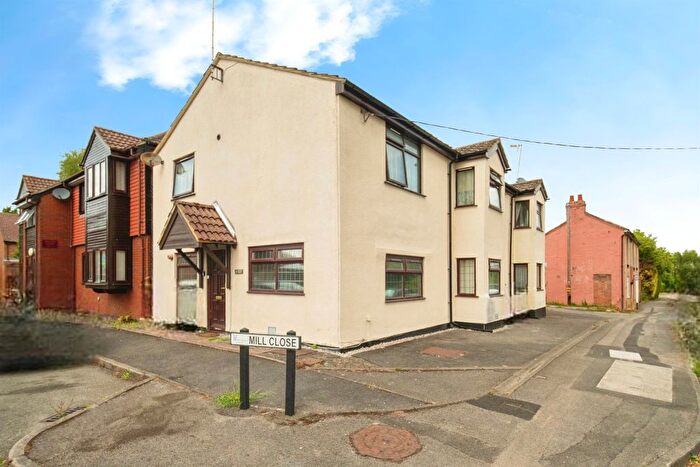
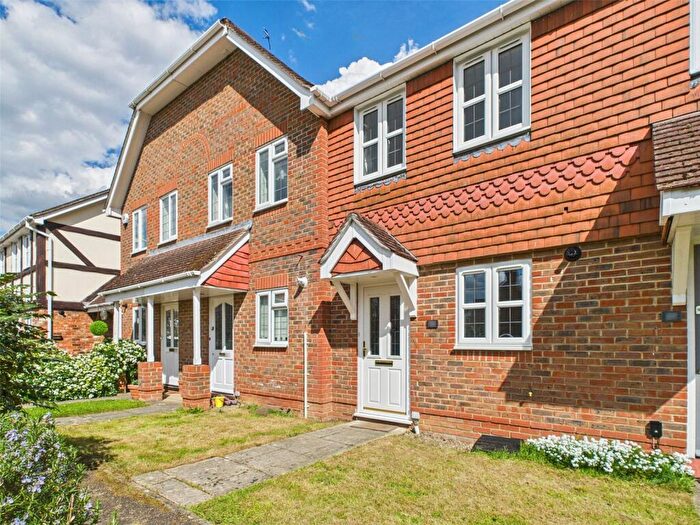
Properties for sale in Bramley And Sherfield
Previously listed properties in Bramley And Sherfield
Roads and Postcodes in Bramley And Sherfield
Navigate through our locations to find the location of your next house in Bramley And Sherfield, Hook for sale or to rent.
| Streets | Postcodes |
|---|---|
| Bow Drive | RG27 0EJ RG27 0EQ |
| Bow Gardens | RG27 0EH |
| Bow Grove | RG27 0DT RG27 0DY |
| Bramley Road | RG27 0BX RG27 0BZ RG27 0DA RG27 0DD RG27 0DF RG27 0DG |
| Breach Gardens | RG27 0AW |
| Breach Lane | RG27 0EU |
| Bullsdown Close | RG27 0DZ |
| Church End | RG27 0JB |
| Goddards Close | RG27 0EG |
| Goddards Lane | RG27 0EF RG27 0EL RG27 0EW |
| Hams Corner | RG27 0HP |
| Longbridge Close | RG27 0DQ |
| Mill Close | RG27 0AQ |
| Northfield Road | RG27 0DN RG27 0DR RG27 0DS RG27 0DW |
| Poplar Close | RG27 0DX |
| Pound Meadow | RG27 0EP |
| Reading Road | RG27 0AA RG27 0BS RG27 0ER RG27 0EX RG27 0EZ RG27 0JE |
| Sherfield Green | RG27 0BU RG27 0DE RG27 0ED RG27 0EE RG27 0EN |
| Wildmoor | RG27 0HD RG27 0HF RG27 0HQ |
| Wildmoor Lane | RG27 0HA RG27 0HB RG27 0HE RG27 0HH RG27 0HJ RG27 0JD |
| Willow Way | RG27 0DU |
| RG27 0HU |
Transport near Bramley And Sherfield
- FAQ
- Price Paid By Year
- Property Type Price
Frequently asked questions about Bramley And Sherfield
What is the average price for a property for sale in Bramley And Sherfield?
The average price for a property for sale in Bramley And Sherfield is £531,533. This amount is 7% lower than the average price in Hook. There are 109 property listings for sale in Bramley And Sherfield.
What streets have the most expensive properties for sale in Bramley And Sherfield?
The streets with the most expensive properties for sale in Bramley And Sherfield are Sherfield Green at an average of £954,375, Wildmoor Lane at an average of £950,500 and Pound Meadow at an average of £897,000.
What streets have the most affordable properties for sale in Bramley And Sherfield?
The streets with the most affordable properties for sale in Bramley And Sherfield are Mill Close at an average of £190,000, Reading Road at an average of £272,555 and Goddards Close at an average of £342,500.
Which train stations are available in or near Bramley And Sherfield?
Some of the train stations available in or near Bramley And Sherfield are Bramley (Hampshire), Hook and Mortimer.
Property Price Paid in Bramley And Sherfield by Year
The average sold property price by year was:
| Year | Average Sold Price | Price Change |
Sold Properties
|
|---|---|---|---|
| 2025 | £569,100 | 7% |
10 Properties |
| 2024 | £530,125 | 4% |
20 Properties |
| 2023 | £508,366 | 4% |
15 Properties |
| 2022 | £487,720 | 15% |
25 Properties |
| 2021 | £415,037 | -12% |
30 Properties |
| 2020 | £463,100 | 3% |
14 Properties |
| 2019 | £450,157 | -1% |
19 Properties |
| 2018 | £454,272 | 4% |
22 Properties |
| 2017 | £437,200 | -21% |
20 Properties |
| 2016 | £527,800 | 24% |
15 Properties |
| 2015 | £401,231 | 10% |
19 Properties |
| 2014 | £361,074 | 2% |
37 Properties |
| 2013 | £354,261 | 5% |
17 Properties |
| 2012 | £335,687 | 17% |
16 Properties |
| 2011 | £277,241 | 1% |
12 Properties |
| 2010 | £274,389 | 11% |
14 Properties |
| 2009 | £244,461 | -5% |
13 Properties |
| 2008 | £256,549 | -16% |
9 Properties |
| 2007 | £297,882 | -20% |
50 Properties |
| 2006 | £357,840 | 14% |
22 Properties |
| 2005 | £308,296 | 14% |
30 Properties |
| 2004 | £265,958 | 14% |
54 Properties |
| 2003 | £229,420 | 3% |
20 Properties |
| 2002 | £223,569 | -6% |
51 Properties |
| 2001 | £236,985 | 28% |
24 Properties |
| 2000 | £171,205 | 1% |
26 Properties |
| 1999 | £169,199 | 10% |
29 Properties |
| 1998 | £152,542 | 11% |
33 Properties |
| 1997 | £135,927 | 13% |
36 Properties |
| 1996 | £118,400 | 12% |
26 Properties |
| 1995 | £104,615 | - |
19 Properties |
Property Price per Property Type in Bramley And Sherfield
Here you can find historic sold price data in order to help with your property search.
The average Property Paid Price for specific property types in the last three years are:
| Property Type | Average Sold Price | Sold Properties |
|---|---|---|
| Semi Detached House | £479,625.00 | 12 Semi Detached Houses |
| Detached House | £806,970.00 | 17 Detached Houses |
| Terraced House | £362,428.00 | 7 Terraced Houses |
| Flat | £212,000.00 | 9 Flats |

