
Houses for sale in Chineham, Hook
House Prices in Chineham
Properties in Chineham have an average house price of £410k and had 142 Property Transactions within the last 3 years¹.
Chineham is an area in Hook, Hampshire with 981 households², where the most expensive property was sold for £850k.
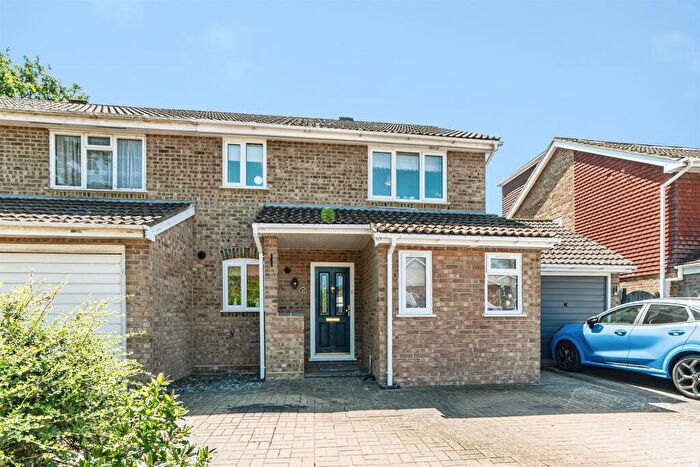
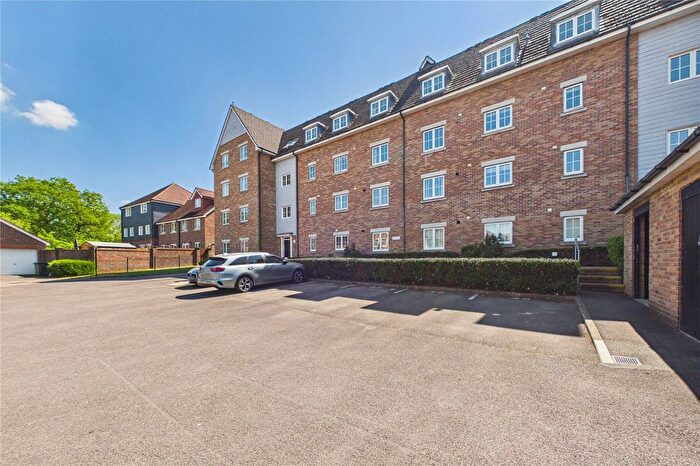
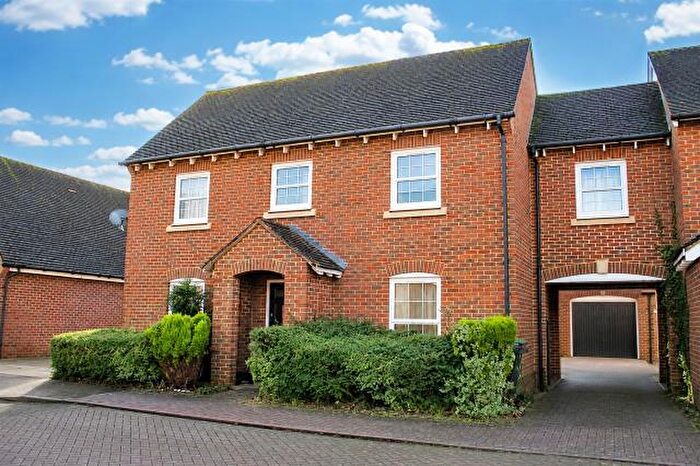
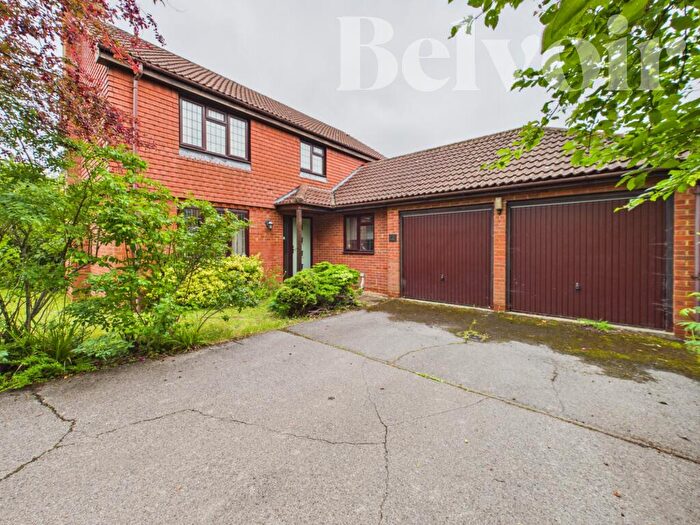
Properties for sale in Chineham
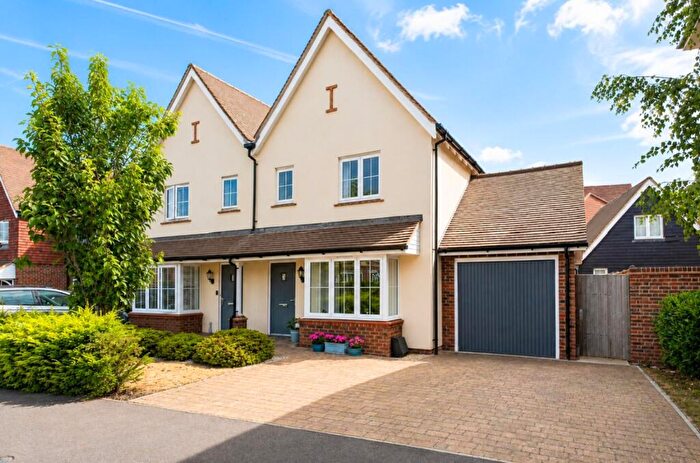
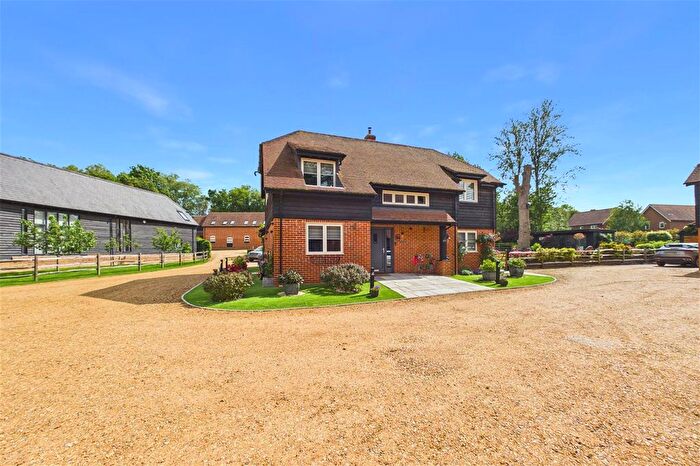
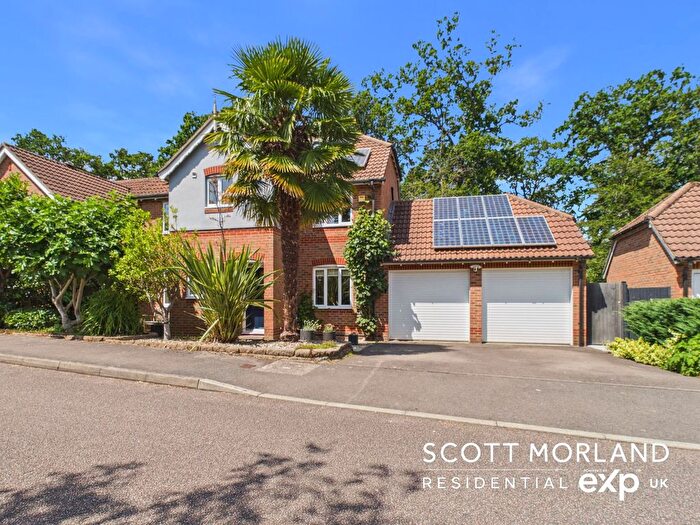
![]()
If you are looking to sell your house, let it out, or receive a property valuation, an expert can help you.
Click the button below to get started.

Roads and Postcodes in Chineham
Navigate through our locations to find the location of your next house in Chineham, Hook for sale or to rent.
| Streets | Postcodes |
|---|---|
| Allington Rise | RG27 0ST RG27 0SU |
| Amport Road | RG27 0FR |
| Avington Way | RG27 0AY RG27 0FN |
| Bransbury Grove | RG27 0BP |
| Brockham Grange | RG27 0FT |
| Buckland Terrace | RG27 0EB |
| Burgate Crescent | RG27 0SP |
| Chilworth Way | RG27 0FD |
| Clanville Rise | RG27 0FG |
| Compton Way | RG27 0SG RG27 0SQ |
| Crofton Square | RG27 0SX |
| Cufaude Lane | RG27 0FL |
| Eling Crescent | RG27 0FJ |
| Fernhill Place | RG27 0SJ |
| Gaiger Avenue | RG27 0SA |
| Gateswood Drive | RG27 0FE |
| Hambledon Way | RG27 0SB |
| Houghton Square | RG27 0SL |
| Langley Grove | RG27 0BN |
| Millbrook Close | RG27 0AZ |
| Monxton Place | RG27 0FB |
| Otterbourne Walk | RG27 0SE RG27 0SF |
| Reading Road | RG27 0JG |
| Ripley Terrace | RG27 0SS |
| Rockbourne Road | RG27 0AF RG27 0SH RG27 0SR |
| Rowner Crescent | RG27 0SW |
| Stanswood Grange | RG27 0BF |
| Sunwood Drive | RG27 0FP |
| Titchfield Crescent | RG27 0FW |
| Warnford Grove | RG27 0ET |
| Wickham Way | RG27 0SN |
| Woolston Place | RG27 0FH |
Property price trends in Chineham
According to the latest Land Registry data, the average home in Chineham sold for £386,375 in 2026. That figure comes from 1,717 sales logged over the past 28 years.
Prices have softened over the last three years. Compared with 2023, when the typical sale came in around £397,916, that's a fall of roughly 2.9%.
Looking back five years, average prices are up about 3.2% since 2021, a gain of around £11,816 in cash terms.
Zoom out to the past decade for the fuller picture. Back in 2016, homes here averaged £343,754, so the typical sold price has climbed about 12.4% since then, roughly 1.2% a year. Stretch the view to fifteen years and that annual pace edges up closer to 2.4%.
Frequently asked questions about Chineham
What is the average price for a property for sale in Chineham?
The average price for a property for sale in Chineham is £409,859. This amount is 28% lower than the average price in Hook. There are 582 property listings for sale in Chineham.
What streets have the most expensive properties for sale in Chineham?
The streets with the most expensive properties for sale in Chineham are Reading Road at an average of £666,250, Hambledon Way at an average of £650,000 and Stanswood Grange at an average of £614,000.
What streets have the most affordable properties for sale in Chineham?
The streets with the most affordable properties for sale in Chineham are Wickham Way at an average of £206,500, Sunwood Drive at an average of £254,166 and Monxton Place at an average of £257,750.
Which train stations are available in or near Chineham?
Some of the train stations available in or near Chineham are Bramley (Hampshire), Basingstoke and Hook.
Property Price Paid in Chineham by Year
The average sold property price by year was:
| Year | Average Sold Price | Price Change |
Sold Properties
|
|---|---|---|---|
| 2026 | £386,375 | -9% |
8 Properties |
| 2025 | £422,596 | 3% |
47 Properties |
| 2024 | £411,877 | 3% |
45 Properties |
| 2023 | £397,916 | 4% |
42 Properties |
| 2022 | £380,817 | 2% |
48 Properties |
| 2021 | £374,559 | 11% |
82 Properties |
| 2020 | £334,627 | -2% |
67 Properties |
| 2019 | £340,758 | -3% |
57 Properties |
| 2018 | £350,070 | 1% |
64 Properties |
| 2017 | £348,100 | 1% |
78 Properties |
Property Price per Property Type in Chineham
Here you can find historic sold price data in order to help with your property search.
The average Property Paid Price for specific property types in the last three years are:
| Property Type | Average Sold Price | Sold Properties |
|---|---|---|
| Semi Detached House | £429,443.00 | 40 Semi Detached Houses |
| Detached House | £546,193.00 | 31 Detached Houses |
| Terraced House | £389,971.00 | 51 Terraced Houses |
| Flat | £210,087.00 | 20 Flats |
