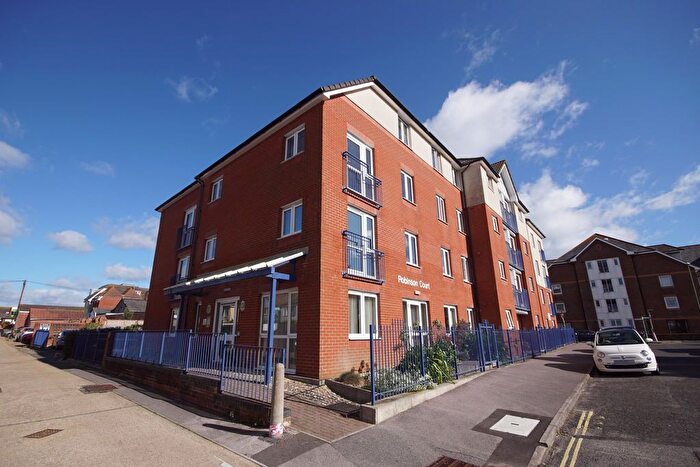
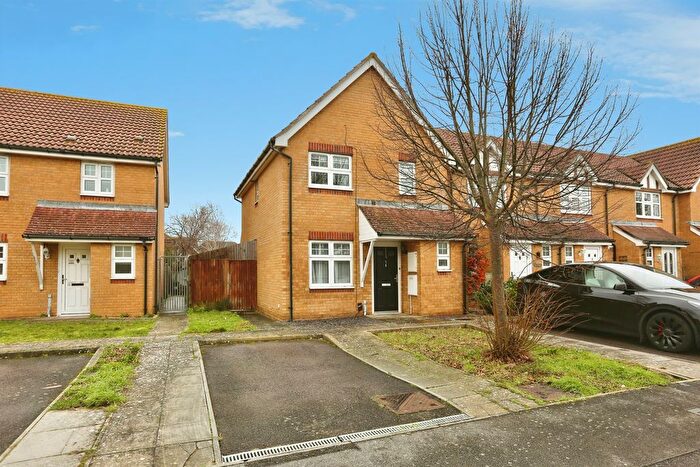
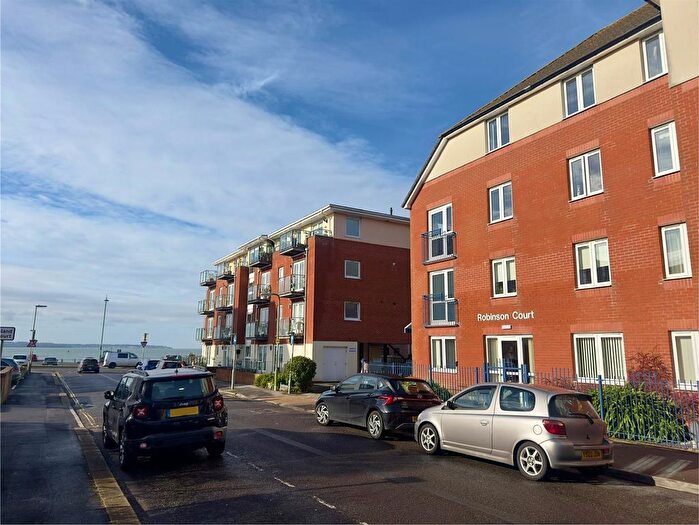
Houses for sale & to rent in Lee East, Lee-on-the-solent
House Prices in Lee East
Properties in Lee East have an average house price of £351,725.00 and had 217 Property Transactions within the last 3 years¹.
Lee East is an area in Lee-on-the-solent, Hampshire with 2,409 households², where the most expensive property was sold for £725,000.00.
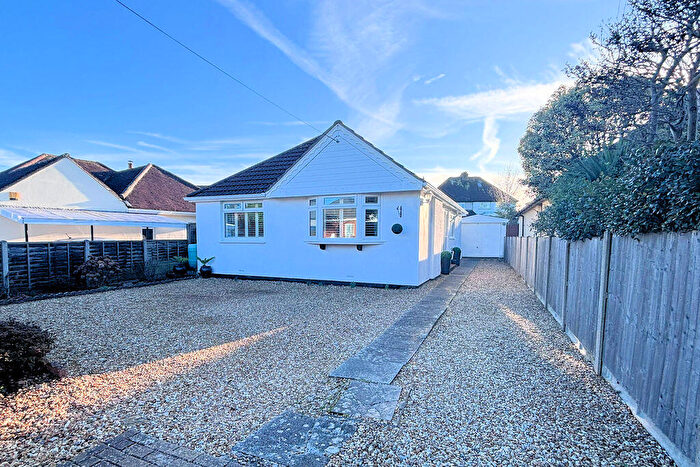
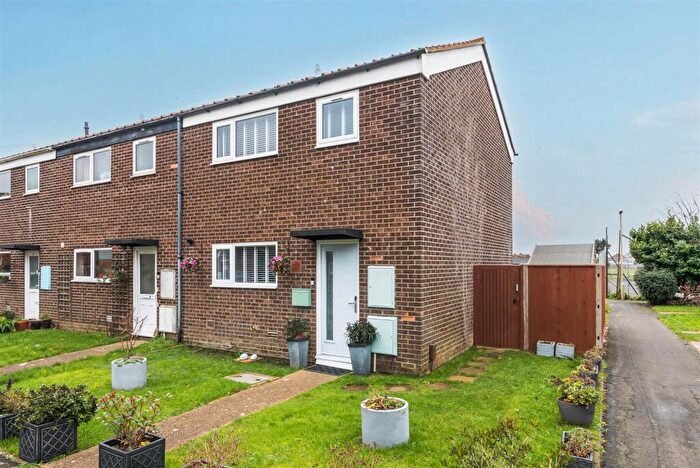
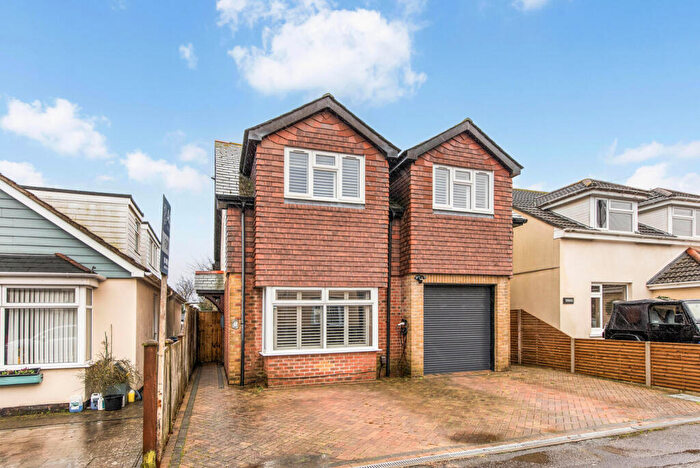
Properties for sale in Lee East
Roads and Postcodes in Lee East
Navigate through our locations to find the location of your next house in Lee East, Lee-on-the-solent for sale or to rent.
| Streets | Postcodes |
|---|---|
| Albacore Close | PO13 8GG |
| Anstice Court | PO13 8AT |
| Avon Close | PO13 8JQ |
| Beaufort Close | PO13 8FN |
| Blackbird Way | PO13 8HJ |
| Bracken Close | PO13 8BF |
| Bryson Close | PO13 8FB |
| Bullfinch Court | PO13 8LQ |
| Chaffinch Way | PO13 8LD |
| Cherry Close | PO13 9EW |
| Cheyne Way | PO13 8HE |
| Chilcomb Close | PO13 8HT |
| Common Barn Lane | PO13 9DS |
| Compton Close | PO13 8JP |
| Cornfield Road | PO13 8HZ |
| Corsair Close | PO13 8GF |
| Darwin Close | PO13 8LS |
| David Newberry Drive | PO13 8FE PO13 8FF PO13 8FG PO13 8FQ PO13 8FR |
| Deane Gardens | PO13 8JZ |
| Derwent Road | PO13 8JG |
| Dominie Walk | PO13 8JL |
| Elmore Avenue | PO13 9EP PO13 9ER PO13 9ES |
| Elmore Close | PO13 9ET |
| Elmore Road | PO13 9AR PO13 9DU PO13 9DY PO13 9FF |
| Empson Walk | PO13 8JS |
| Esmonde Close | PO13 8JW |
| Estancia Close | PO13 8LT |
| Falklands Close | PO13 9DF |
| Fell Drive | PO13 8HP PO13 8HR PO13 8JN PO13 8JR PO13 8LP |
| Fieldhouse Drive | PO13 9DE |
| Firefly Close | PO13 8FY |
| Fitzroy Drive | PO13 8LY PO13 8LZ |
| Francis Close | PO13 8HB |
| Georgia Close | PO13 9XP |
| Gibson Close | PO13 8JD |
| Glenney Close | PO13 8FD |
| Goldfinch Lane | PO13 8LN |
| Grayson Close | PO13 8BH |
| Harrier Close | PO13 8LB |
| Harvard Close | PO13 8FS |
| Hawthorn Walk | PO13 8HW |
| Headley Close | PO13 8HX |
| Hiller Walk | PO13 8JH |
| Holt Close | PO13 8FA |
| Hoverfly Close | PO13 8FX |
| Howard Close | PO13 8LU |
| Kimpton Close | PO13 8JY |
| Langton Close | PO13 8FH |
| Larch Close | PO13 8HQ |
| Laurus Walk | PO13 8JA |
| Longdon Drive | PO13 8LR |
| Magister Drive | PO13 8GE |
| Magpie Lane | PO13 8LE |
| Maizemore Walk | PO13 8HL |
| Maple Close | PO13 9EF |
| Martin Close | PO13 8LG |
| Martinet Drive | PO13 8GP |
| Martlet Close | PO13 8FP |
| Megson Drive | PO13 8BA |
| Osprey Gardens | PO13 8LJ |
| Percival Close | PO13 8GQ |
| Proctor Drive | PO13 8GN |
| Rosemary Walk | PO13 8JB |
| Rowan Close | PO13 9AW |
| Saunders Close | PO13 8LX |
| Sea Crest Road | PO13 8HH |
| Seafire Road | PO13 8GL |
| Sherbrooke Close | PO13 8FJ |
| Shoot Lane | PO13 9PA |
| Skipper Way | PO13 8HA PO13 8HD PO13 8HS PO13 9EU PO13 9EX PO13 9EY PO13 9EZ |
| Smeeton Road | PO13 8JJ PO13 8LH |
| Sparrow Court | PO13 8LL |
| Spencer Drive | PO13 8HF PO13 8HG PO13 8LA |
| Spruce Walk | PO13 8HN |
| Swallow Court | PO13 8LW |
| Swift Close | PO13 8LF |
| Tiger Moth Close | PO13 8FU |
| Trent Way | PO13 8JF |
| Twyford Drive | PO13 8HU PO13 8JT PO13 8JU |
| Usborne Close | PO13 8NA |
| Waveney Close | PO13 8JE |
| Wellington Drive | PO13 8FT PO13 8FZ |
| Wessex Close | PO13 8FL |
| Westland Drive | PO13 8GH PO13 8GJ |
| Wheatcroft Road | PO13 8HY |
Transport near Lee East
-
Fareham Station
-
Portsmouth Harbour Station
-
Portchester Station
-
Portsmouth and Southsea Station
-
Ryde Pier Head Station
- FAQ
- Price Paid By Year
- Property Type Price
Frequently asked questions about Lee East
What is the average price for a property for sale in Lee East?
The average price for a property for sale in Lee East is £351,725. This amount is 6% lower than the average price in Lee-on-the-solent. There are 1,023 property listings for sale in Lee East.
What streets have the most expensive properties for sale in Lee East?
The streets with the most expensive properties for sale in Lee East are Firefly Close at an average of £665,000, Wellington Drive at an average of £591,250 and Corsair Close at an average of £585,000.
What streets have the most affordable properties for sale in Lee East?
The streets with the most affordable properties for sale in Lee East are Deane Gardens at an average of £173,650, Cherry Close at an average of £180,000 and Osprey Gardens at an average of £202,600.
Which train stations are available in or near Lee East?
Some of the train stations available in or near Lee East are Fareham, Portsmouth Harbour and Portchester.
Property Price Paid in Lee East by Year
The average sold property price by year was:
| Year | Average Sold Price | Price Change |
Sold Properties
|
|---|---|---|---|
| 2025 | £348,242 | -7% |
78 Properties |
| 2024 | £371,952 | 13% |
88 Properties |
| 2023 | £322,153 | -3% |
51 Properties |
| 2022 | £332,004 | -1% |
88 Properties |
| 2021 | £333,771 | 10% |
110 Properties |
| 2020 | £300,519 | 4% |
86 Properties |
| 2019 | £287,586 | -1% |
114 Properties |
| 2018 | £291,793 | 2% |
96 Properties |
| 2017 | £286,697 | 12% |
115 Properties |
| 2016 | £253,382 | -1% |
102 Properties |
| 2015 | £256,650 | 8% |
105 Properties |
| 2014 | £236,284 | 7% |
153 Properties |
| 2013 | £220,733 | 3% |
115 Properties |
| 2012 | £213,229 | -2% |
87 Properties |
| 2011 | £216,893 | -3% |
97 Properties |
| 2010 | £224,033 | 8% |
102 Properties |
| 2009 | £205,964 | -7% |
92 Properties |
| 2008 | £221,045 | -7% |
102 Properties |
| 2007 | £235,438 | 10% |
245 Properties |
| 2006 | £210,785 | -1% |
317 Properties |
| 2005 | £213,463 | 3% |
288 Properties |
| 2004 | £207,310 | 7% |
291 Properties |
| 2003 | £192,172 | 10% |
277 Properties |
| 2002 | £173,352 | 24% |
284 Properties |
| 2001 | £131,345 | 28% |
106 Properties |
| 2000 | £94,493 | 21% |
82 Properties |
| 1999 | £74,747 | 7% |
86 Properties |
| 1998 | £69,235 | 1% |
95 Properties |
| 1997 | £68,278 | 7% |
87 Properties |
| 1996 | £63,636 | 8% |
111 Properties |
| 1995 | £58,682 | - |
76 Properties |
Property Price per Property Type in Lee East
Here you can find historic sold price data in order to help with your property search.
The average Property Paid Price for specific property types in the last three years are:
| Property Type | Average Sold Price | Sold Properties |
|---|---|---|
| Semi Detached House | £354,595.00 | 57 Semi Detached Houses |
| Detached House | £523,766.00 | 53 Detached Houses |
| Terraced House | £290,059.00 | 84 Terraced Houses |
| Flat | £173,389.00 | 23 Flats |

