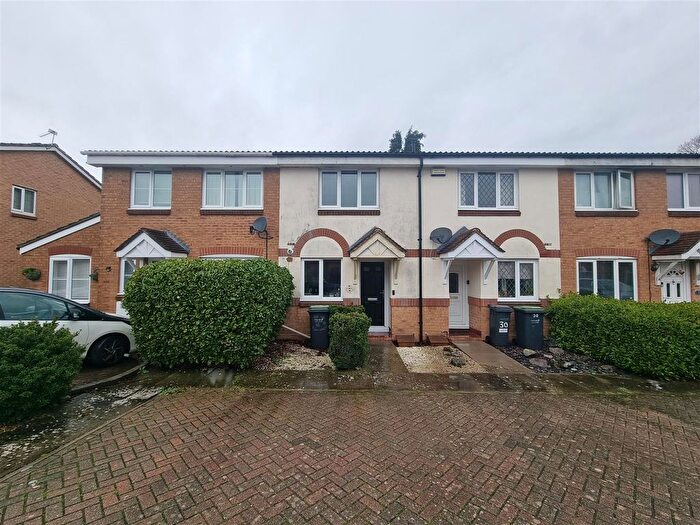
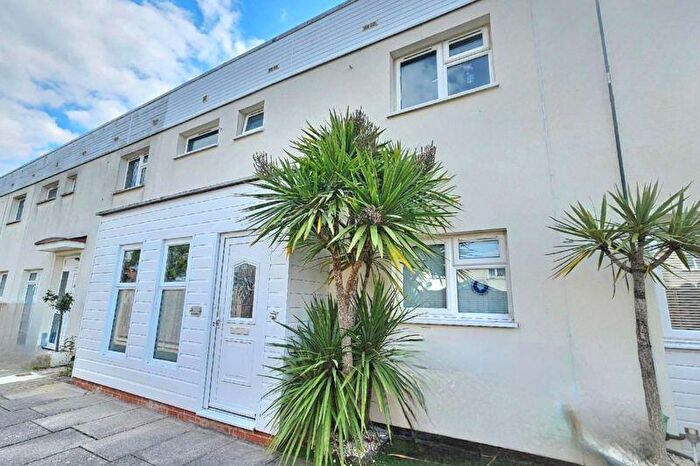
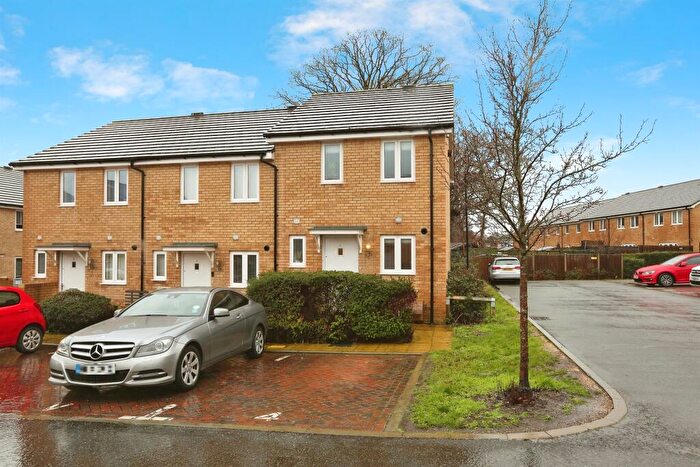
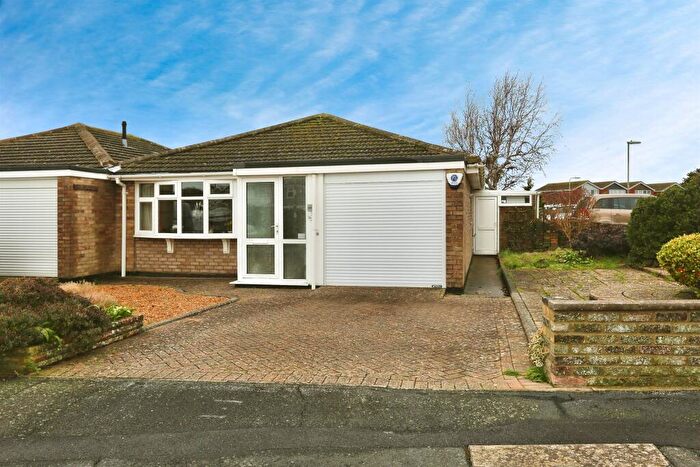
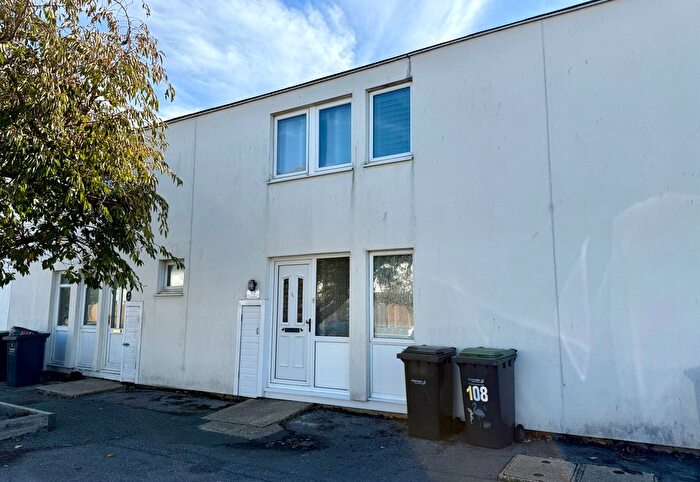
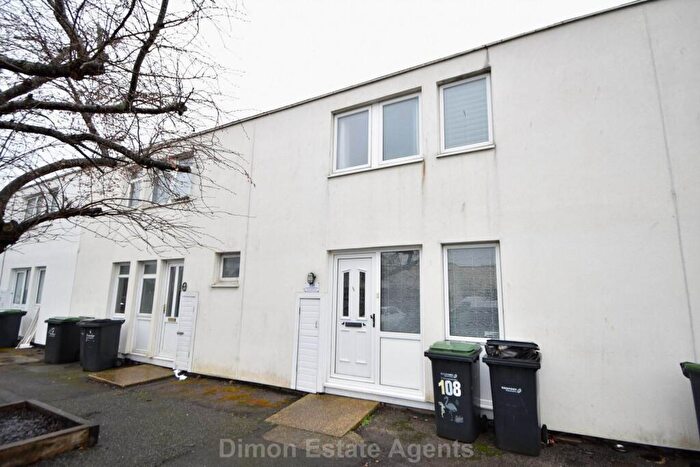
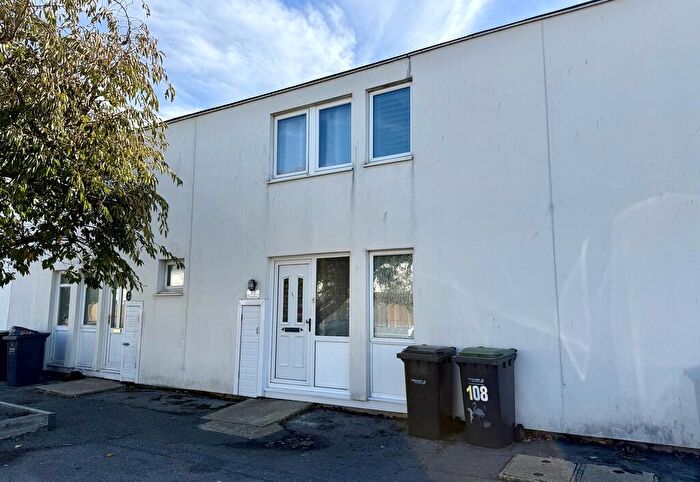
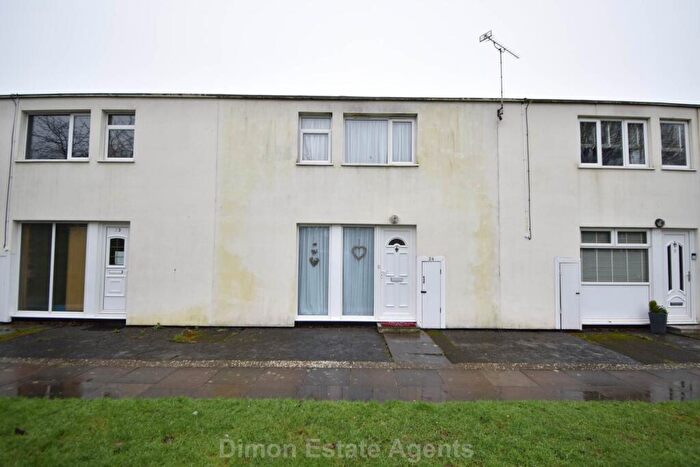
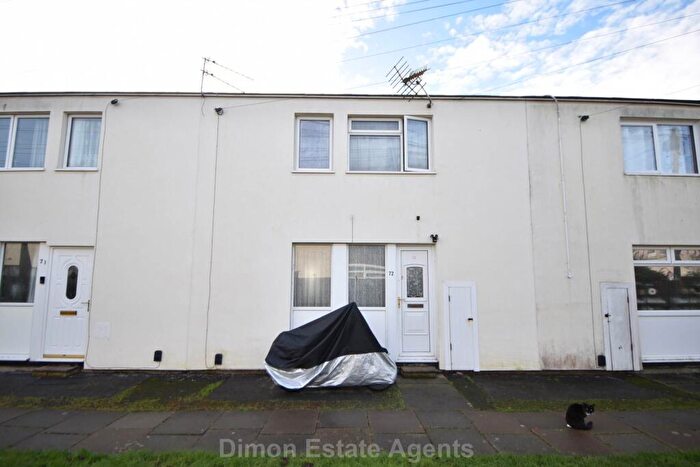
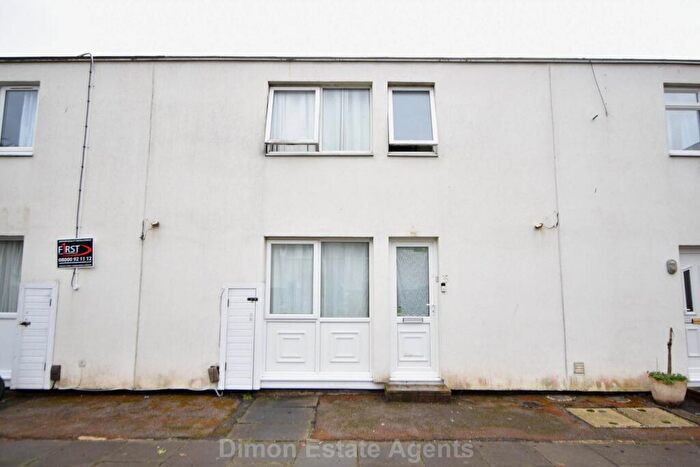
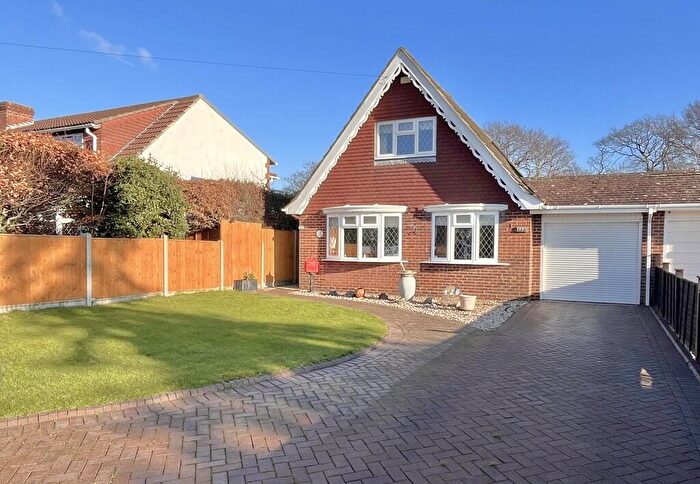
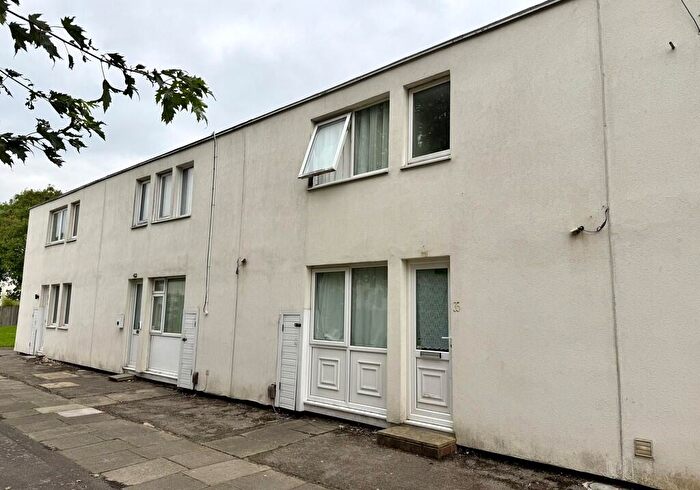
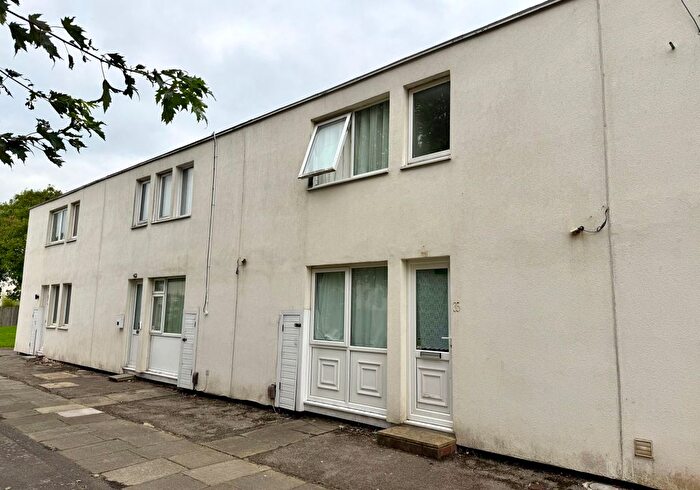
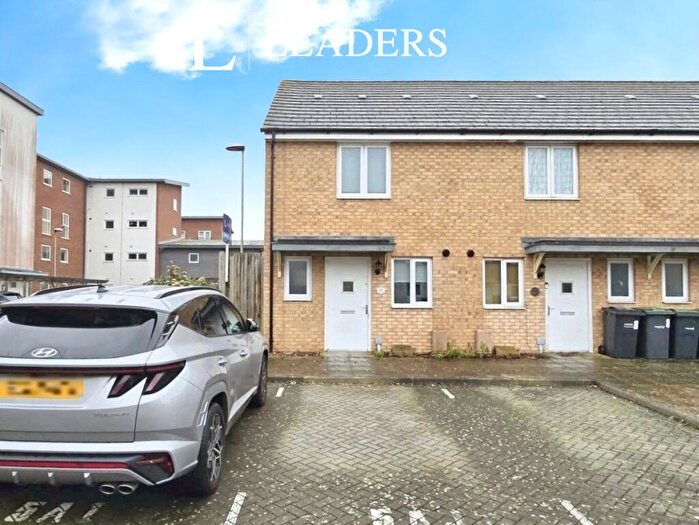
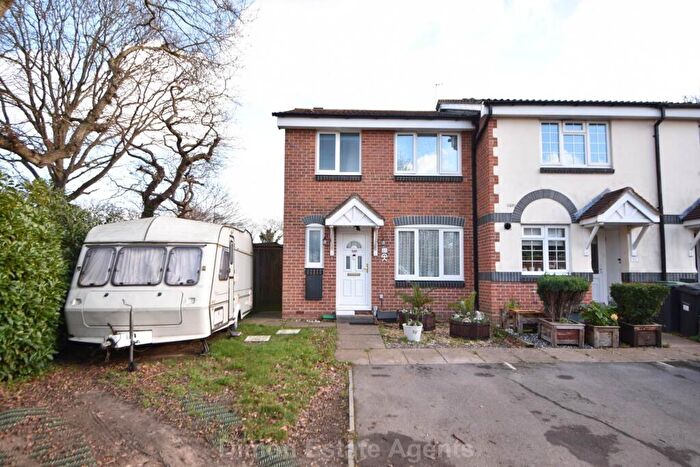
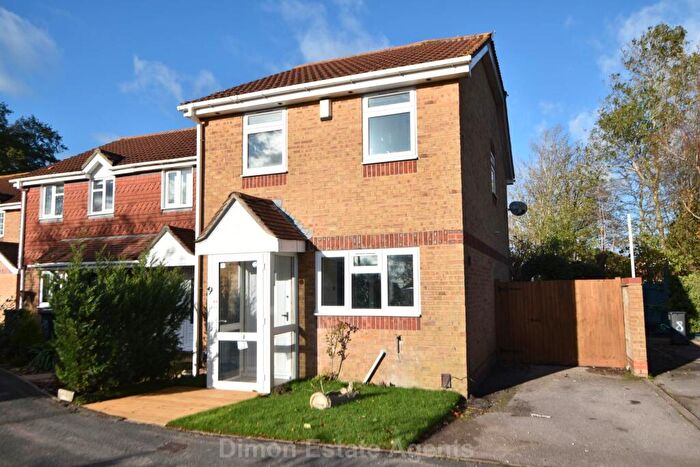
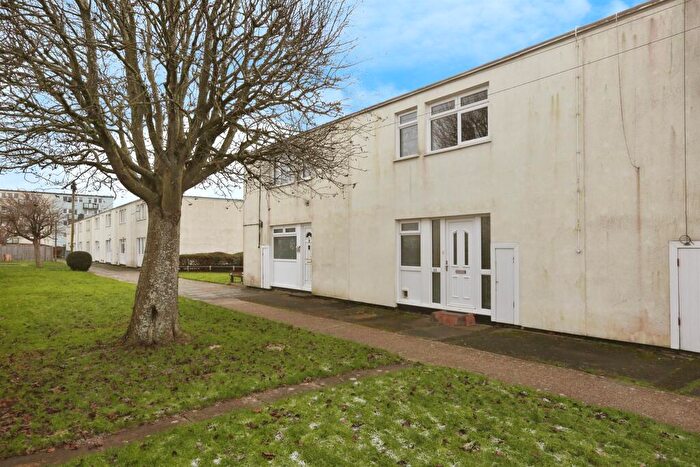
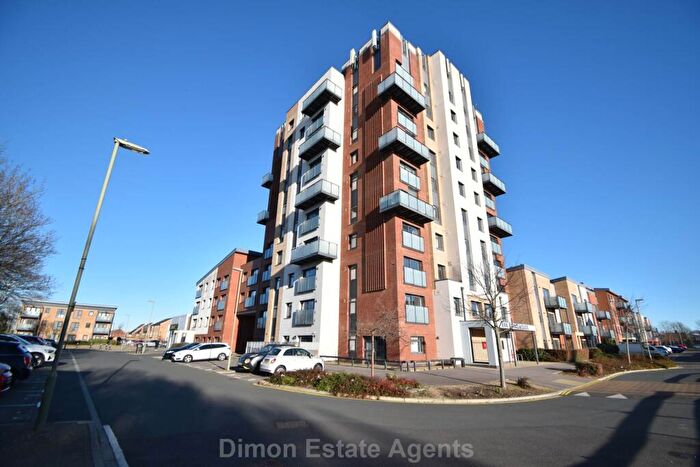
Houses for sale & to rent in Grange, Gosport
House Prices in Grange
Properties in Grange have an average house price of £195,946.00 and had 225 Property Transactions within the last 3 years¹.
Grange is an area in Gosport, Hampshire with 1,970 households², where the most expensive property was sold for £385,000.00.
Properties for sale in Grange
Roads and Postcodes in Grange
Navigate through our locations to find the location of your next house in Grange, Gosport for sale or to rent.
| Streets | Postcodes |
|---|---|
| Agincourt Avenue | PO13 8NU |
| Aldermoor Road | PO13 9RU |
| Amelia Gardens | PO13 8NB |
| Anson Close | PO13 8BS PO13 8DA |
| Attwood Terrace | PO13 8GB |
| Ayling Close | PO13 9SA |
| Balfour Close | PO13 8ET |
| Barrington Close | PO13 8NZ |
| Bath & Wells Court | PO13 8DW |
| Blackburn Court | PO13 8DD |
| Blanchard Avenue | PO13 8FW PO13 8NF PO13 8NR |
| Bradford Court | PO13 8DN |
| Bristol Court | PO13 8DR |
| Broomfield Crescent | PO13 9TN |
| Carless Close | PO13 9PL PO13 9PN PO13 9PW PO13 9XJ |
| Carmine Court | PO13 8EB |
| Cobalt Court | PO13 8EF |
| Cochrane Close | PO13 8EX |
| Compass Close | PO13 9XF |
| Coral Court | PO13 8EA |
| Cornwell Close | PO13 9QL PO13 9QN PO13 9QW |
| Dampier Close | PO13 9SB |
| Davenport Close | PO13 8ES PO13 8NS PO13 8NT |
| Derby Court | PO13 8DU |
| Ensign Drive | PO13 9XE PO13 9XN |
| Exeter Court | PO13 8DT |
| Fairlead Drive | PO13 9UX |
| Falcon Meadows Way | PO13 8AA |
| Fanfare Close | PO13 8NE PO13 8NL |
| Fawn Close | PO13 8ND PO13 8NG |
| Frobisher Close | PO13 8EG PO13 8EH |
| Gazelle Close | PO13 8EY |
| Grange Lane | PO13 9UU PO13 9AN PO13 9PQ PO13 9QY |
| Grange Road | PO13 8AP PO13 8AS PO13 8ZW |
| Griffin Walk | PO13 8AX |
| Halyard Close | PO13 9XH |
| Helm Close | PO13 9XG |
| Hereford Court | PO13 8DH |
| Howe Road | PO13 8GR PO13 8GY PO13 8GS PO13 8GW PO13 8GX PO13 8GZ PO13 8PA |
| Hudson Close | PO13 8AZ |
| Hunter Close | PO13 9XY |
| Jasmine Court | PO13 8EE |
| Jersey Way | PO13 8NJ |
| Keel Close | PO13 9XW |
| Lanyard Drive | PO13 9UY |
| Leicester Court | PO13 8DB |
| Lichfield Court | PO13 8DF |
| Lindbergh Close | PO13 8BG PO13 8NN PO13 8EN |
| Little Woodham Lane | PO13 8AB PO13 8EQ |
| Lizard Close | PO13 8NH |
| Lovelock Terrace | PO13 8GA |
| Magennis Close | PO13 9PP PO13 9PR PO13 9XL |
| Magenta Court | PO13 8ED |
| Mandarin Way | PO13 8DP PO13 8EL |
| Mantle Close | PO13 9QS PO13 9QT |
| Marlin Close | PO13 9UZ |
| Mcgarry Terrace | PO13 8GD |
| Mizen Way | PO13 9XQ |
| Napier Close | PO13 8EW |
| Nimrod Drive | PO13 8AJ PO13 8NY |
| Oakthorn Close | PO13 8DG |
| Otter Close | PO13 8EZ |
| Paffard Close | PO13 9RY |
| Pegasus Close | PO13 8BD |
| Rambler Drive | PO13 8AY |
| Ramsey Avenue | PO13 8NW |
| Raven Close | PO13 8AU |
| Ripon Court | PO13 8DE |
| Rodney Close | PO13 8EJ |
| Samson Close | PO13 9QH PO13 9QJ |
| Sheffield Court | PO13 8DJ |
| Shepperd Terrace | PO13 8GT |
| Solebay Way | PO13 8NP PO13 8NQ |
| Spinnaker Close | PO13 9XZ |
| St Davids Court | PO13 8DX |
| St Nicholas Avenue | PO13 9RH PO13 9RP PO13 9RR PO13 9RW PO13 9TH PO13 9TQ |
| Stares Close | PO13 9RZ |
| Truro Court | PO13 8DS |
| Wayfarers | PO13 9XX |
| Williams Close | PO13 9QP PO13 9QR |
| Woodland Close | PO13 8DQ |
| Worcester Court | PO13 8DL |
Transport near Grange
-
Portsmouth Harbour Station
-
Portsmouth and Southsea Station
-
Fareham Station
-
Portchester Station
-
Fratton Station
-
Ryde Pier Head Station
-
Ryde Esplanade Station
- FAQ
- Price Paid By Year
- Property Type Price
Frequently asked questions about Grange
What is the average price for a property for sale in Grange?
The average price for a property for sale in Grange is £195,946. This amount is 21% lower than the average price in Gosport. There are 949 property listings for sale in Grange.
What streets have the most expensive properties for sale in Grange?
The streets with the most expensive properties for sale in Grange are Barrington Close at an average of £285,000, Jersey Way at an average of £280,000 and Nimrod Drive at an average of £277,000.
What streets have the most affordable properties for sale in Grange?
The streets with the most affordable properties for sale in Grange are Mantle Close at an average of £104,000, Samson Close at an average of £120,000 and Carless Close at an average of £123,262.
Which train stations are available in or near Grange?
Some of the train stations available in or near Grange are Portsmouth Harbour, Portsmouth and Southsea and Fareham.
Property Price Paid in Grange by Year
The average sold property price by year was:
| Year | Average Sold Price | Price Change |
Sold Properties
|
|---|---|---|---|
| 2025 | £198,863 | 3% |
66 Properties |
| 2024 | £192,155 | -3% |
84 Properties |
| 2023 | £197,626 | -1% |
75 Properties |
| 2022 | £199,563 | 15% |
79 Properties |
| 2021 | £169,989 | -7% |
118 Properties |
| 2020 | £181,820 | 2% |
78 Properties |
| 2019 | £177,599 | 8% |
121 Properties |
| 2018 | £164,216 | -7% |
107 Properties |
| 2017 | £176,435 | 9% |
145 Properties |
| 2016 | £160,597 | 10% |
117 Properties |
| 2015 | £145,279 | 4% |
177 Properties |
| 2014 | £140,061 | 9% |
137 Properties |
| 2013 | £126,990 | 5% |
86 Properties |
| 2012 | £120,278 | 8% |
80 Properties |
| 2011 | £110,911 | 21% |
79 Properties |
| 2010 | £87,345 | 5% |
52 Properties |
| 2009 | £83,078 | -23% |
50 Properties |
| 2008 | £102,473 | -8% |
64 Properties |
| 2007 | £110,503 | 5% |
126 Properties |
| 2006 | £105,299 | 3% |
124 Properties |
| 2005 | £101,697 | 12% |
156 Properties |
| 2004 | £89,368 | 7% |
116 Properties |
| 2003 | £83,115 | 13% |
133 Properties |
| 2002 | £71,966 | 17% |
169 Properties |
| 2001 | £59,961 | 18% |
277 Properties |
| 2000 | £49,405 | 11% |
129 Properties |
| 1999 | £43,944 | 7% |
129 Properties |
| 1998 | £40,890 | -16% |
249 Properties |
| 1997 | £47,301 | 1% |
139 Properties |
| 1996 | £46,661 | -14% |
175 Properties |
| 1995 | £53,325 | - |
134 Properties |
Property Price per Property Type in Grange
Here you can find historic sold price data in order to help with your property search.
The average Property Paid Price for specific property types in the last three years are:
| Property Type | Average Sold Price | Sold Properties |
|---|---|---|
| Semi Detached House | £269,411.00 | 17 Semi Detached Houses |
| Detached House | £273,750.00 | 2 Detached Houses |
| Terraced House | £225,191.00 | 123 Terraced Houses |
| Flat | £135,687.00 | 83 Flats |

