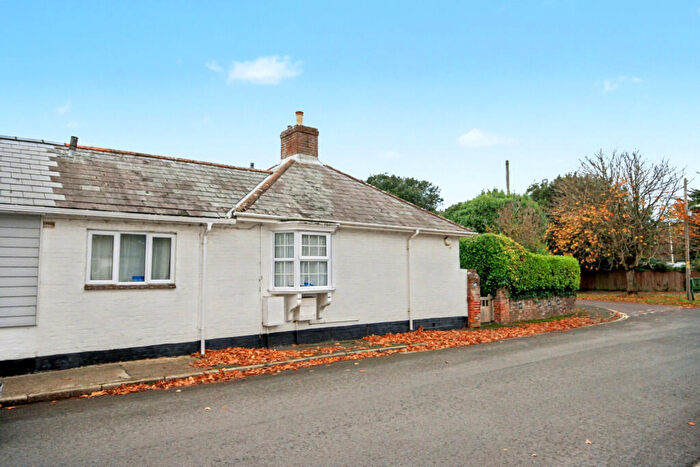
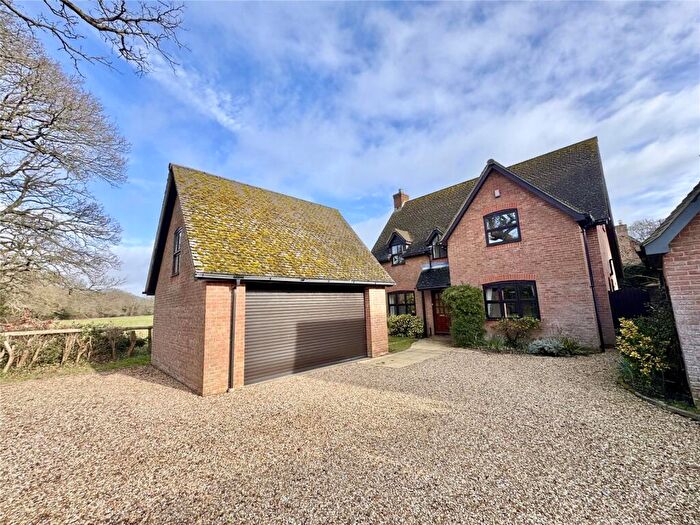
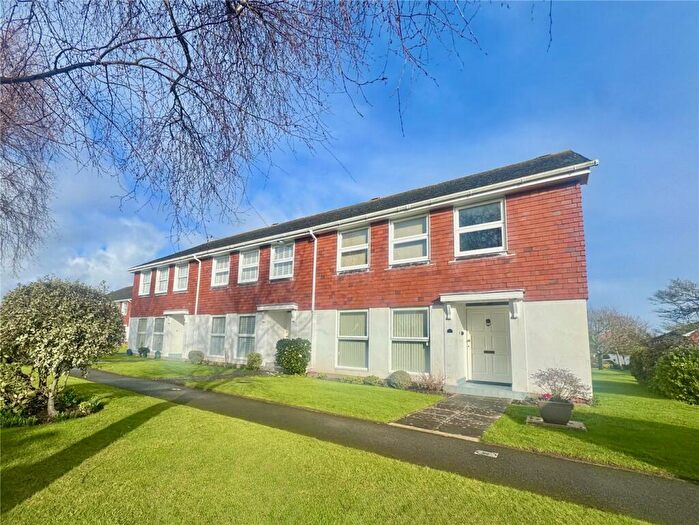
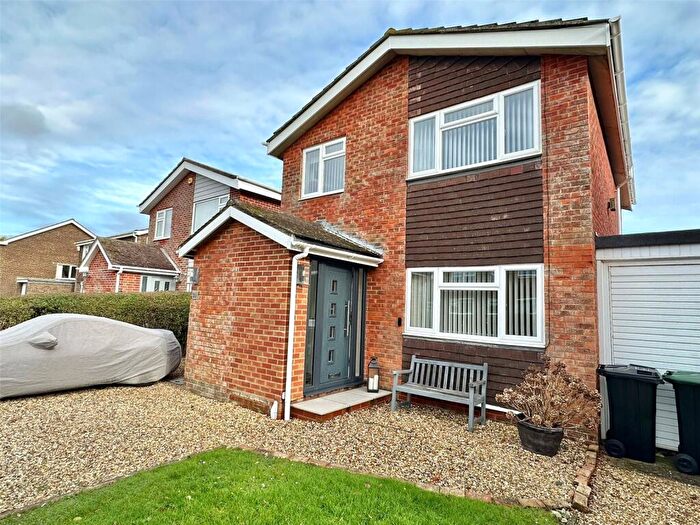
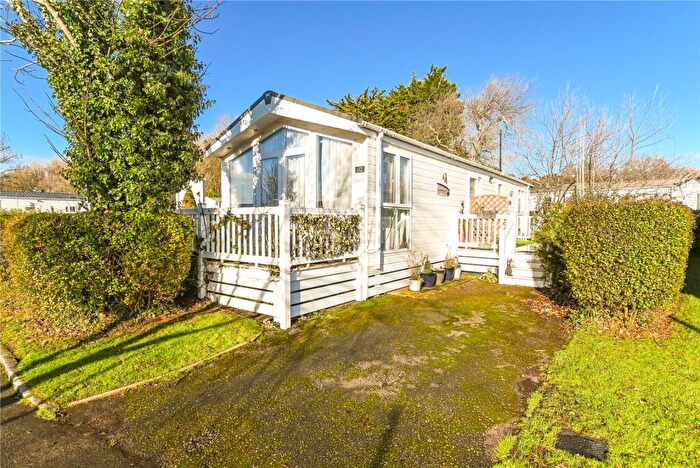
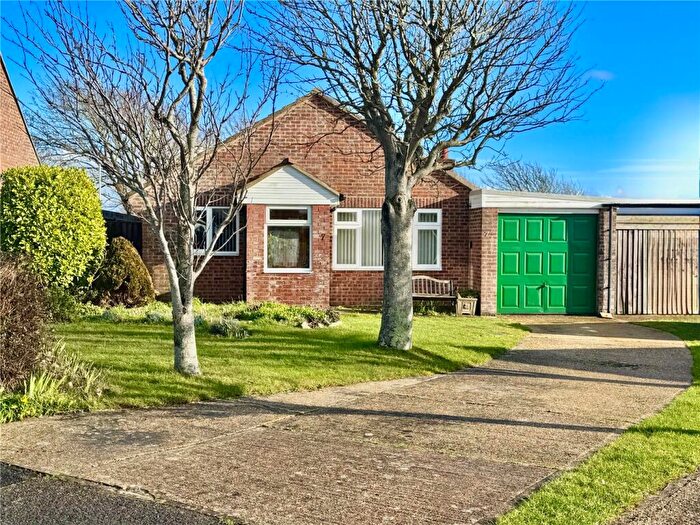
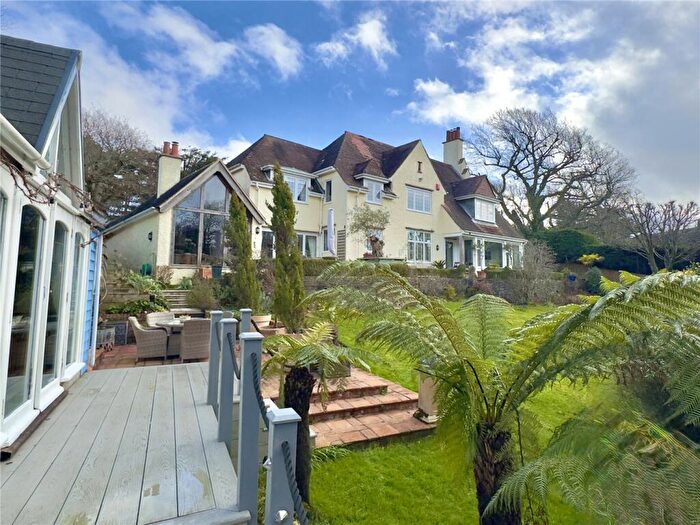
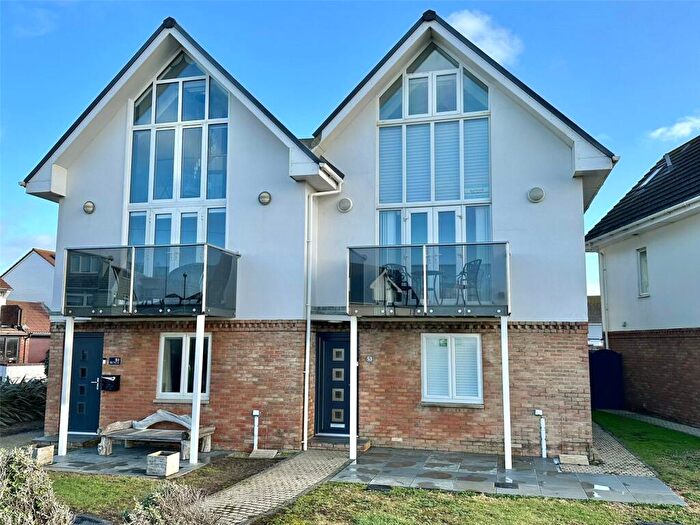
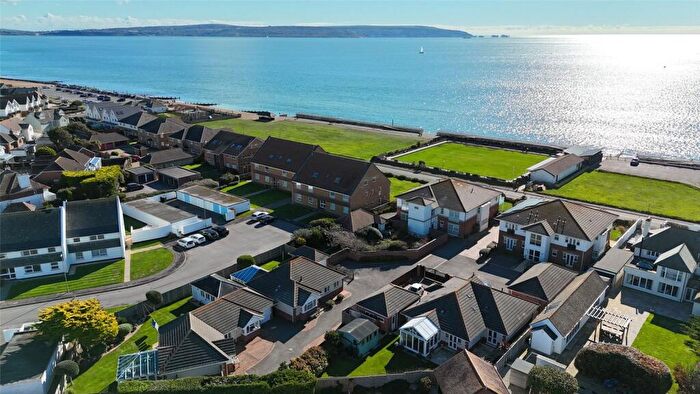
Houses for sale & to rent in Milford, Lymington
House Prices in Milford
Properties in Milford have an average house price of £671,405.00 and had 273 Property Transactions within the last 3 years¹.
Milford is an area in Lymington, Hampshire with 2,401 households², where the most expensive property was sold for £2,150,000.00.
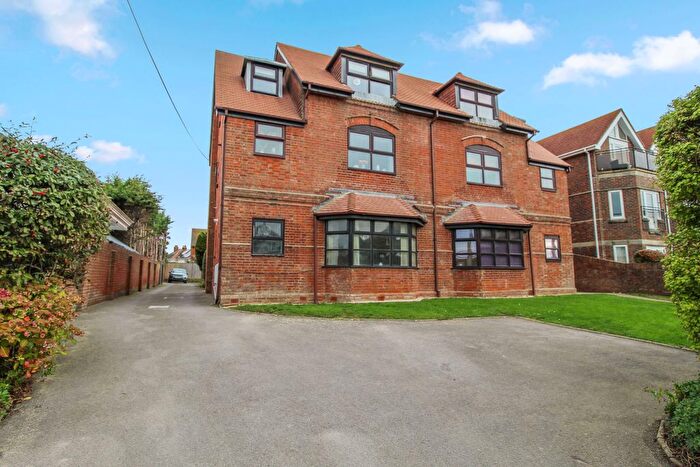
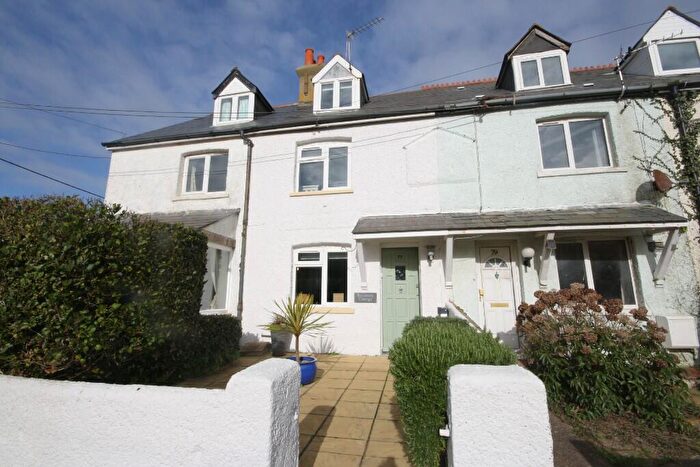
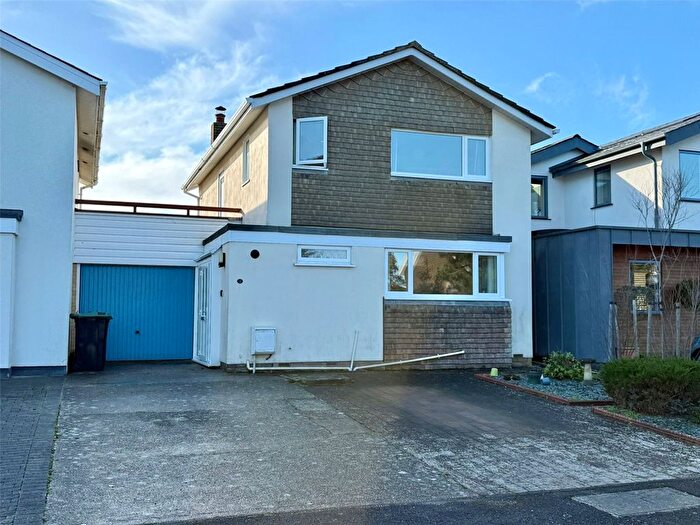
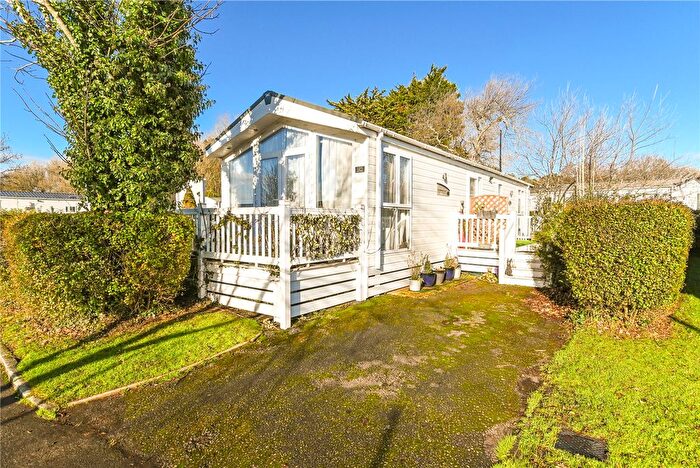
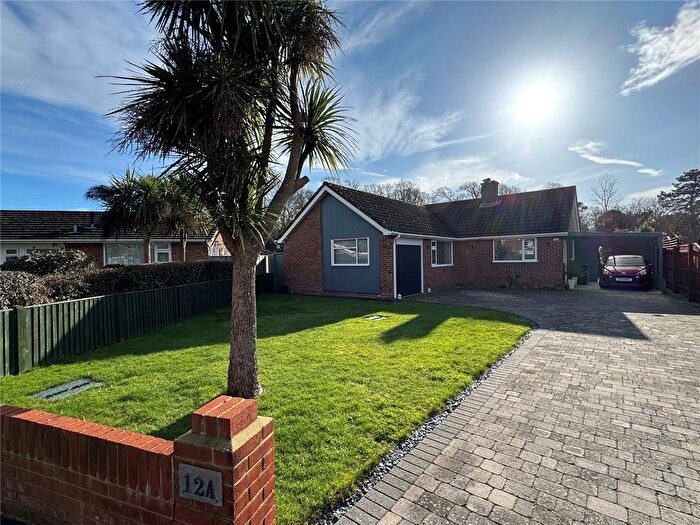
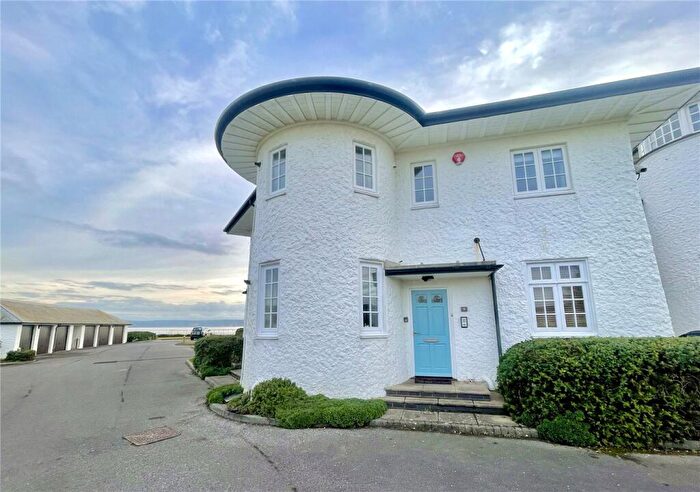
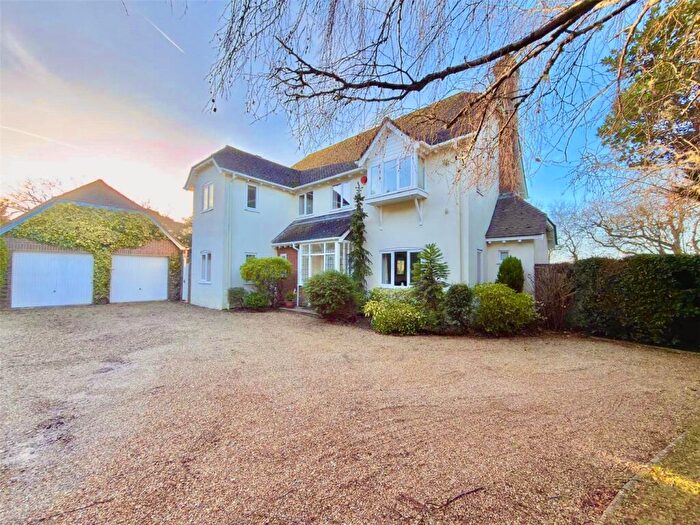
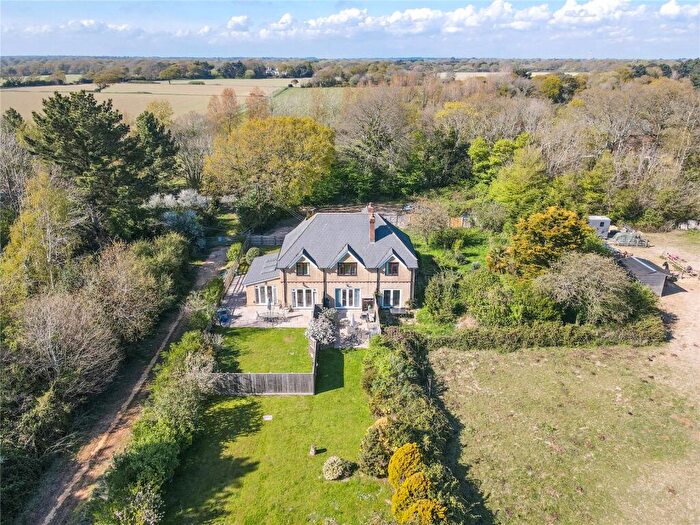
Properties for sale in Milford
Roads and Postcodes in Milford
Navigate through our locations to find the location of your next house in Milford, Lymington for sale or to rent.
| Streets | Postcodes |
|---|---|
| Agarton Lane | SO41 0TT |
| Aubrey Close | SO41 0TD |
| Barnes Lane | SO41 0AP SO41 0RL SO41 0RP SO41 0RR SO41 0RQ |
| Beauchamps Place | SO41 0PX |
| Blackbush Road | SO41 0PB |
| Broadfields Close | SO41 0SE |
| Camden Hurst | SO41 0WL SO41 0WP |
| Canons Walk | SO41 0SH |
| Carrington Close | SO41 0RD |
| Carrington Lane | SO41 0RA SO41 0RB |
| Castle Close | SO41 0QB |
| Champion Close | SO41 0UH |
| Chaucer Drive | SO41 0SS |
| Christchurch Road | SO41 0LB |
| Church Hill | SO41 0QJ SO41 0QH |
| Cliff Road | SO41 0NS SO41 0NT SO41 0NW |
| Coastguard Cottages | SO41 0TP |
| Cornwallis Road | SO41 0NF SO41 0NG SO41 0NH SO41 0NJ |
| Dacres Walk | SO41 0SL |
| Danestream Close | SO41 0UR |
| De La Warr Road | SO41 0PS |
| Deans Court | SO41 0SG |
| Downton Lane | SO41 0LG |
| Dryden Place | SO41 0WE |
| Eastern Way | SO41 0TB SO41 0TA |
| George Road | SO41 0RS SO41 0RT |
| Gillingham Road | SO41 0PJ |
| Glebe Fields | SO41 0WW |
| Grange Close | SO41 0TY |
| Grebe Close | SO41 0XA |
| Greenbanks Close | SO41 0SQ |
| Greenways | SO41 0RU |
| Hamilton Court | SO41 0PR |
| Harewood Green | SO41 0TZ |
| Hawks Lea | SO41 0FR |
| High Street | SO41 0AB SO41 0AD SO41 0AH SO41 0QD SO41 0QE SO41 0QF SO41 0QG |
| Holly Gardens | SO41 0SB |
| Hurdles Mead | SO41 0EA |
| Hurst Road | SO41 0AL SO41 0PY |
| Island View Close | SO41 0PZ |
| Island View Gardens | SO41 0EB |
| Keats Avenue | SO41 0WG SO41 0WN |
| Kensington Park | SO41 0WD |
| Keyhaven Road | SO41 0QW SO41 0QX SO41 0QY SO41 0TF SO41 0TG SO41 0TH SO41 0TJ SO41 0TL |
| Kitwalls Lane | SO41 0RJ |
| Kivernell Place | SO41 0XH |
| Kivernell Road | SO41 0PP SO41 0PQ |
| Knowland Drive | SO41 0RH SO41 0SF |
| Laundry Lane | SO41 0WJ |
| Lawn Close | SO41 0ST |
| Lawn Road | SO41 0QZ |
| Love Lane | SO41 0SP |
| Lucerne Road | SO41 0PL |
| Lymefields | SO41 0SU |
| Lymington Road | SO41 0QL SO41 0QN SO41 0QR SO41 0RF |
| Lymore Lane | SO41 0TS SO41 0TX |
| Lymore Valley | SO41 0TW |
| Lyndale Close | SO41 0QP |
| Manor Close | SO41 0SW |
| Manor Road | SO41 0RG |
| Maryland Gardens | SO41 0UY SO41 0UZ SO41 0WB |
| Milford Court | SO41 0WF |
| Milford Road | SO41 0JF SO41 0JG SO41 0ED |
| Mill Meadow | SO41 0UG |
| Molefields | SO41 0UB |
| Needles Point | SO41 0WX |
| New Lane | SO41 0UQ |
| New Road | SO41 0TN |
| New Valley Road | SO41 0SA |
| Newlands Manor | SO41 0JH |
| North Head | SO41 0LX |
| Northfield Road | SO41 0RE |
| Oaktree Court | SO41 0UJ |
| Overstrand Crescent | SO41 0SZ |
| Park Close | SO41 0QT |
| Park Lane | SO41 0PF SO41 0PN SO41 0PT |
| Park Road | SO41 0QU |
| Pless Road | SO41 0NY |
| Plover Drive | SO41 0XF |
| Ravens Way | SO41 0XL |
| River Gardens | SO41 0QA |
| Rookcliff Way | SO41 0SD SO41 0WA |
| Rookwood | SO41 0WS |
| Saltgrass Lane | SO41 0TQ |
| Scholars Retreat | SO41 0XS |
| School Lane | SO41 0TU |
| Sea Road | SO41 0DA SO41 0EQ SO41 0PG SO41 0PH |
| Sharvells Road | SO41 0PE SO41 0WH |
| Shelley Way | SO41 0SN |
| Shingle Bank Drive | SO41 0WQ SO41 0WR |
| Shipwrights Walk | SO41 0UN |
| Shore Close | SO41 0SY |
| Shorefield Crescent | SO41 0PD |
| Shorefield Road | SO41 0LH |
| Shorefield Way | SO41 0RW SO41 0RX |
| Smugglers Way | SO41 0AF |
| Solent Way | SO41 0TE |
| South Court | SO41 0QS |
| Southernhay Court | SO41 0AN |
| Studland Drive | SO41 0QQ |
| Swallow Drive | SO41 0XD SO41 0XG |
| Sycamore Close | SO41 0RY |
| The Boltons | SO41 0PU |
| The Bucklers | SO41 0WT |
| The Grange | SO41 0ZR |
| The Lydgate | SO41 0LY SO41 0NU |
| The Orchard | SO41 0SR |
| Victoria Road | SO41 0NL SO41 0NN SO41 0NP SO41 0NQ SO41 0NR SO41 0UT SO41 0UU SO41 0UW |
| Vinegar Hill | SO41 0RZ |
| Waters Edge | SO41 0AQ |
| Wayside Close | SO41 0RN |
| West Road | SO41 0NZ |
| Westminster Road | SO41 0NX |
| Westover Road | SO41 0PW |
| Whitby Road | SO41 0ND SO41 0NE SO41 0UX |
| Windmill Close | SO41 0SX |
| Wolsey Way | SO41 0SJ |
| Wood Lane | SO41 0NA |
| Woodland Way | SO41 0NB |
| SO41 0TR |
Transport near Milford
- FAQ
- Price Paid By Year
- Property Type Price
Frequently asked questions about Milford
What is the average price for a property for sale in Milford?
The average price for a property for sale in Milford is £671,405. This amount is 13% higher than the average price in Lymington. There are 1,808 property listings for sale in Milford.
What streets have the most expensive properties for sale in Milford?
The streets with the most expensive properties for sale in Milford are De La Warr Road at an average of £1,895,000, Kitwalls Lane at an average of £1,891,666 and Manor Road at an average of £1,600,000.
What streets have the most affordable properties for sale in Milford?
The streets with the most affordable properties for sale in Milford are Lawn Close at an average of £200,000, Hamilton Court at an average of £237,000 and Shingle Bank Drive at an average of £280,111.
Which train stations are available in or near Milford?
Some of the train stations available in or near Milford are Lymington Town, New Milton and Lymington Pier.
Property Price Paid in Milford by Year
The average sold property price by year was:
| Year | Average Sold Price | Price Change |
Sold Properties
|
|---|---|---|---|
| 2025 | £585,301 | -16% |
80 Properties |
| 2024 | £680,630 | -7% |
92 Properties |
| 2023 | £731,203 | 2% |
101 Properties |
| 2022 | £718,528 | 11% |
131 Properties |
| 2021 | £638,274 | 11% |
208 Properties |
| 2020 | £570,900 | 14% |
126 Properties |
| 2019 | £488,779 | -6% |
109 Properties |
| 2018 | £519,736 | 2% |
140 Properties |
| 2017 | £507,309 | 10% |
130 Properties |
| 2016 | £454,374 | 5% |
138 Properties |
| 2015 | £432,557 | -0,4% |
149 Properties |
| 2014 | £434,436 | 20% |
162 Properties |
| 2013 | £348,544 | -4% |
121 Properties |
| 2012 | £363,832 | 2% |
111 Properties |
| 2011 | £357,980 | -0,4% |
115 Properties |
| 2010 | £359,287 | 9% |
143 Properties |
| 2009 | £325,873 | -17% |
118 Properties |
| 2008 | £380,378 | 3% |
120 Properties |
| 2007 | £369,265 | 7% |
186 Properties |
| 2006 | £342,166 | -5% |
192 Properties |
| 2005 | £360,399 | 8% |
138 Properties |
| 2004 | £330,790 | 18% |
147 Properties |
| 2003 | £271,096 | 8% |
172 Properties |
| 2002 | £248,522 | 18% |
204 Properties |
| 2001 | £203,642 | 9% |
161 Properties |
| 2000 | £185,596 | 18% |
150 Properties |
| 1999 | £151,929 | 5% |
204 Properties |
| 1998 | £144,620 | 15% |
153 Properties |
| 1997 | £122,394 | 8% |
199 Properties |
| 1996 | £112,318 | 8% |
164 Properties |
| 1995 | £103,454 | - |
136 Properties |
Property Price per Property Type in Milford
Here you can find historic sold price data in order to help with your property search.
The average Property Paid Price for specific property types in the last three years are:
| Property Type | Average Sold Price | Sold Properties |
|---|---|---|
| Flat | £337,513.00 | 93 Flats |
| Semi Detached House | £566,709.00 | 31 Semi Detached Houses |
| Detached House | £993,802.00 | 118 Detached Houses |
| Terraced House | £550,588.00 | 31 Terraced Houses |

