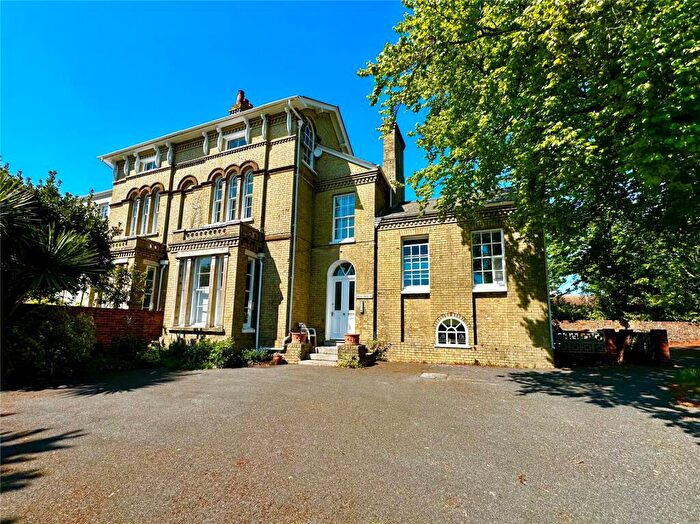
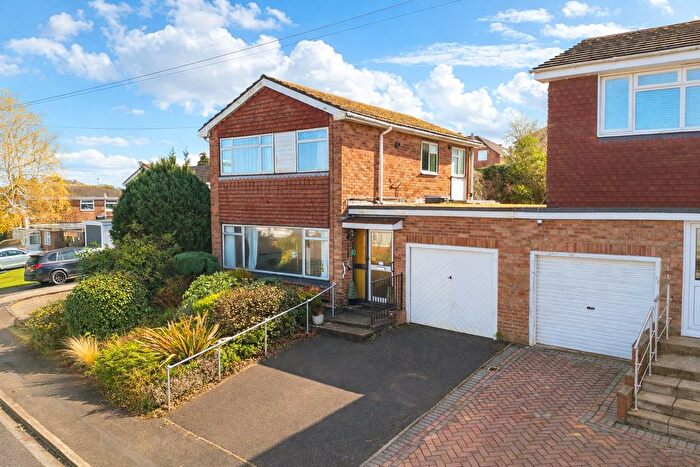
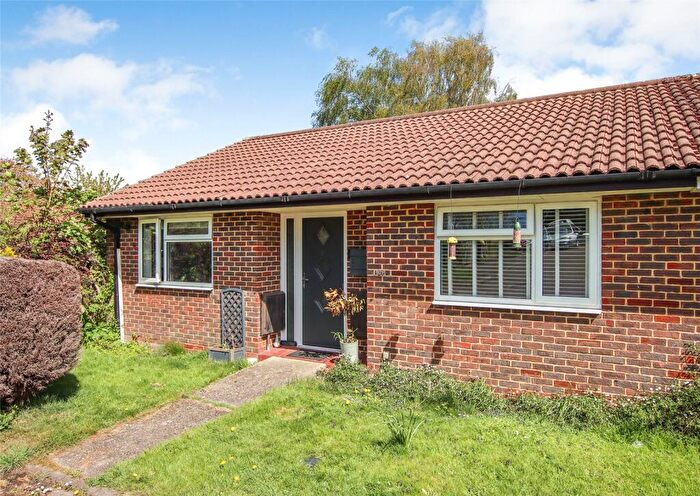
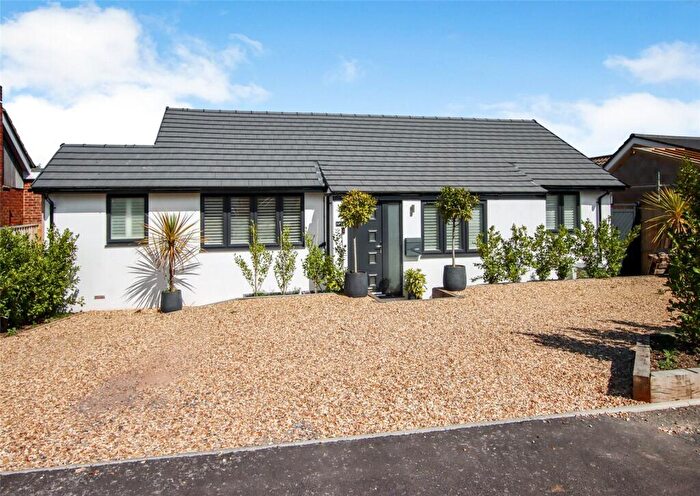
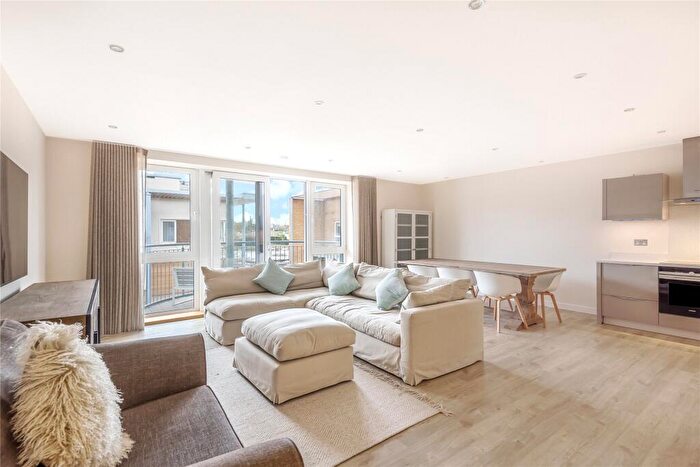
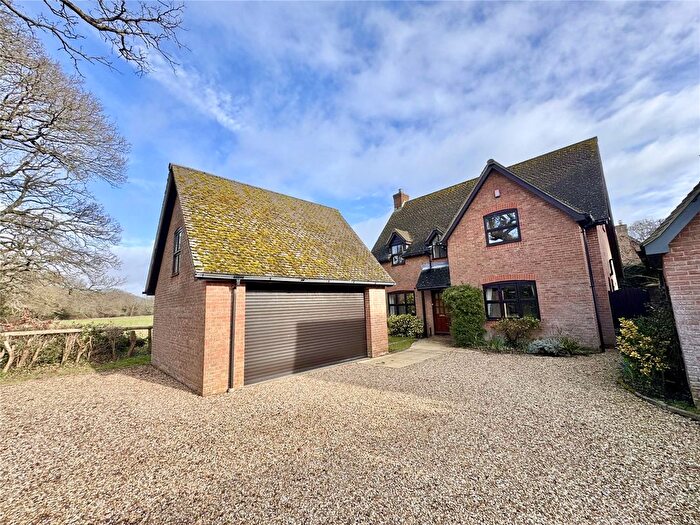
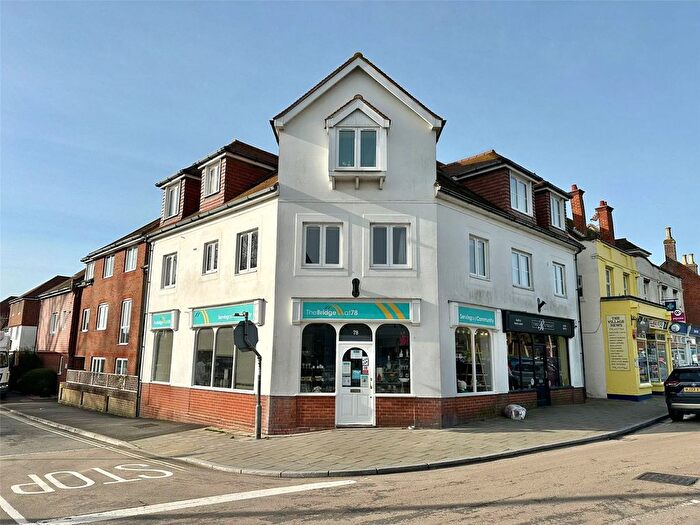
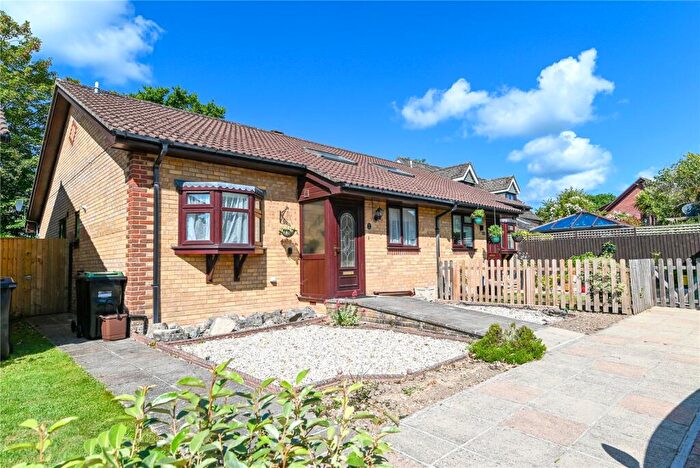
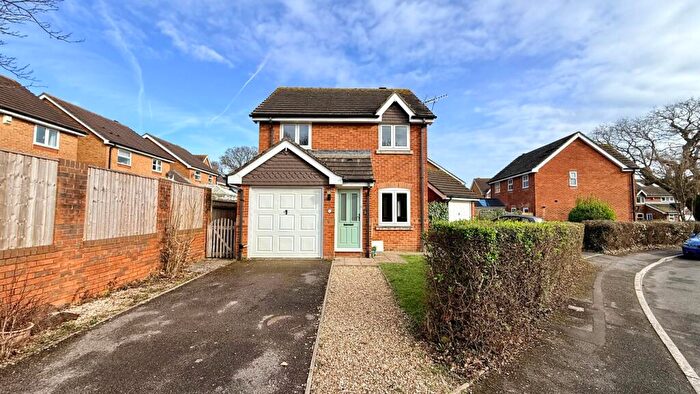
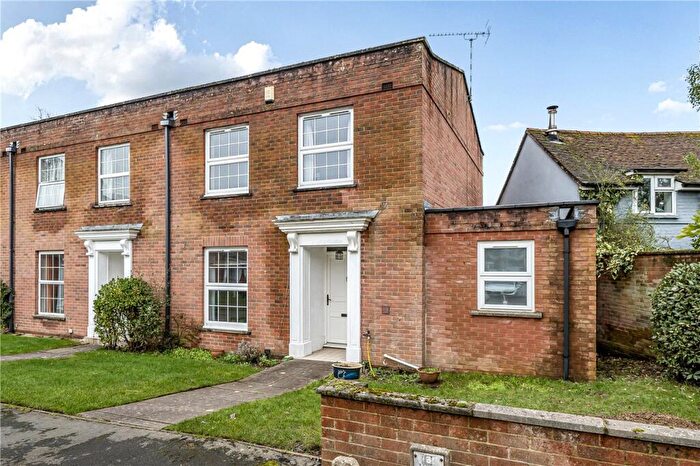
Houses for sale & to rent in Lymington, Hampshire
House Prices in Lymington
Properties in Lymington have an average house price of £593,986.00 and had 1,416 Property Transactions within the last 3 years.¹
Lymington is an area in Hampshire with 14,490 households², where the most expensive property was sold for £3,953,516.00.
Properties for sale in Lymington
Neighbourhoods in Lymington
Navigate through our locations to find the location of your next house in Lymington, Hampshire for sale or to rent.
Transport in Lymington
Please see below transportation links in this area:
- FAQ
- Price Paid By Year
- Property Type Price
Frequently asked questions about Lymington
What is the average price for a property for sale in Lymington?
The average price for a property for sale in Lymington is £593,986. This amount is 42% higher than the average price in Hampshire. There are more than 10,000 property listings for sale in Lymington.
What locations have the most expensive properties for sale in Lymington?
The locations with the most expensive properties for sale in Lymington are Becton at an average of £1,700,000, Brockenhurst And Forest South East at an average of £1,320,000 and Boldre And Sway at an average of £845,200.
What locations have the most affordable properties for sale in Lymington?
The locations with the most affordable properties for sale in Lymington are Buckland at an average of £382,128, Pennington at an average of £496,190 and Hordle at an average of £513,131.
Which train stations are available in or near Lymington?
Some of the train stations available in or near Lymington are Lymington Town, Lymington Pier and Sway.
Property Price Paid in Lymington by Year
The average sold property price by year was:
| Year | Average Sold Price | Price Change |
Sold Properties
|
|---|---|---|---|
| 2025 | £541,668 | -13% |
444 Properties |
| 2024 | £612,761 | -2% |
515 Properties |
| 2023 | £623,658 | -7% |
457 Properties |
| 2022 | £665,808 | 16% |
583 Properties |
| 2021 | £561,461 | -1% |
888 Properties |
| 2020 | £566,236 | 14% |
643 Properties |
| 2019 | £487,148 | -0,3% |
579 Properties |
| 2018 | £488,602 | 4% |
648 Properties |
| 2017 | £470,870 | 8% |
750 Properties |
| 2016 | £432,382 | 4% |
750 Properties |
| 2015 | £416,293 | 3% |
730 Properties |
| 2014 | £404,667 | 14% |
770 Properties |
| 2013 | £348,086 | 0,3% |
643 Properties |
| 2012 | £347,066 | -1% |
578 Properties |
| 2011 | £350,646 | -0,2% |
571 Properties |
| 2010 | £351,235 | 5% |
644 Properties |
| 2009 | £332,857 | -7% |
552 Properties |
| 2008 | £357,714 | 1% |
521 Properties |
| 2007 | £355,411 | 7% |
898 Properties |
| 2006 | £330,153 | 5% |
935 Properties |
| 2005 | £312,971 | 6% |
732 Properties |
| 2004 | £293,133 | 9% |
836 Properties |
| 2003 | £266,805 | 13% |
792 Properties |
| 2002 | £231,951 | 14% |
945 Properties |
| 2001 | £199,982 | 11% |
912 Properties |
| 2000 | £178,812 | 22% |
797 Properties |
| 1999 | £140,304 | 6% |
978 Properties |
| 1998 | £131,216 | 12% |
800 Properties |
| 1997 | £115,398 | 8% |
991 Properties |
| 1996 | £105,951 | 8% |
895 Properties |
| 1995 | £97,863 | - |
718 Properties |
Property Price per Property Type in Lymington
Here you can find historic sold price data in order to help with your property search.
The average Property Paid Price for specific property types in the last three years are:
| Property Type | Average Sold Price | Sold Properties |
|---|---|---|
| Semi Detached House | £488,646.00 | 264 Semi Detached Houses |
| Terraced House | £448,588.00 | 225 Terraced Houses |
| Detached House | £839,913.00 | 621 Detached Houses |
| Flat | £292,688.00 | 306 Flats |

