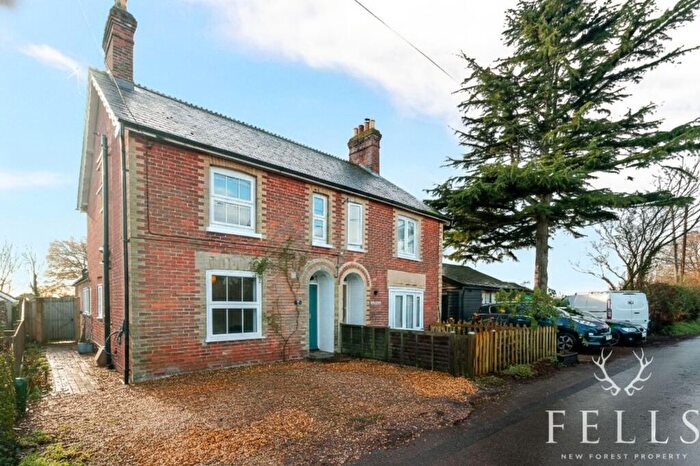
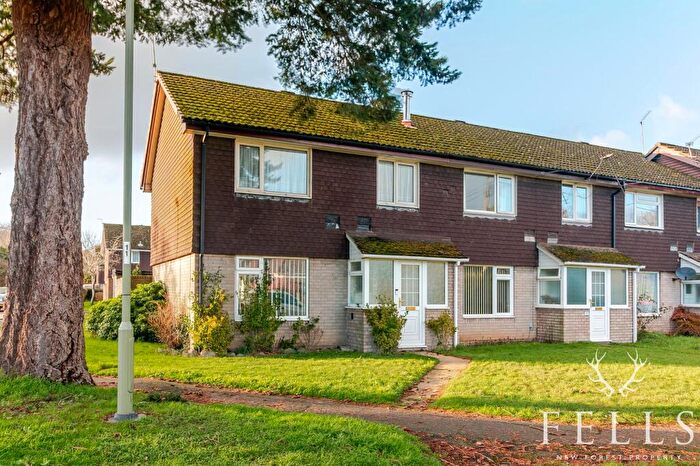
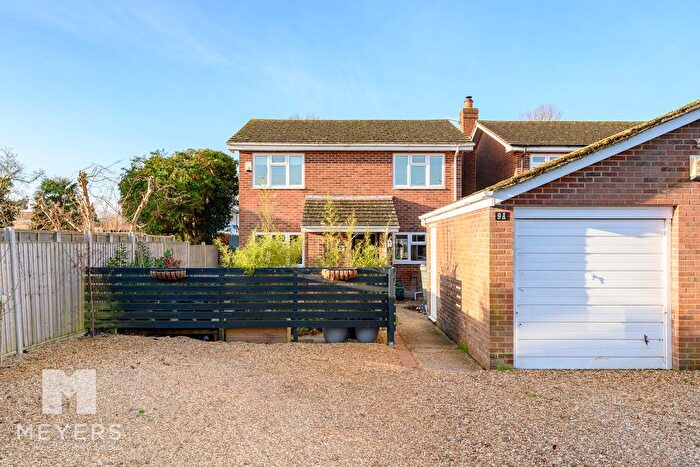
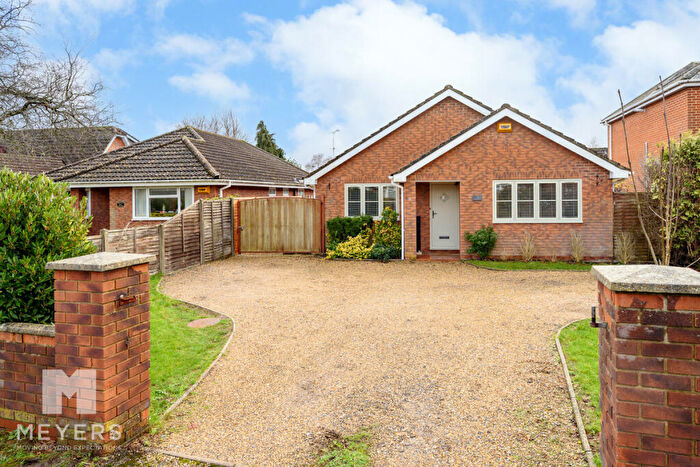
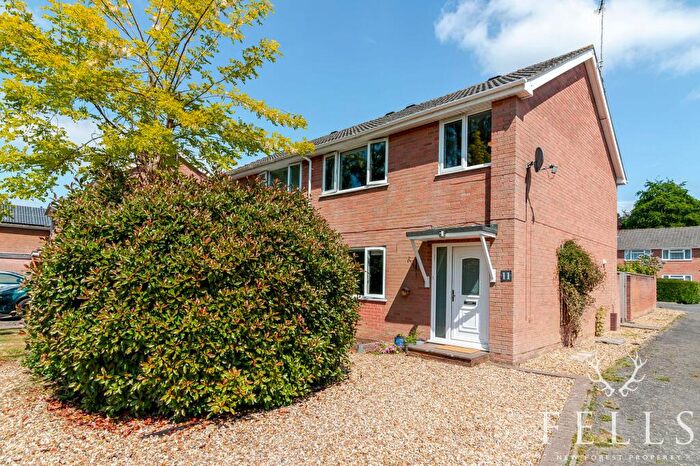
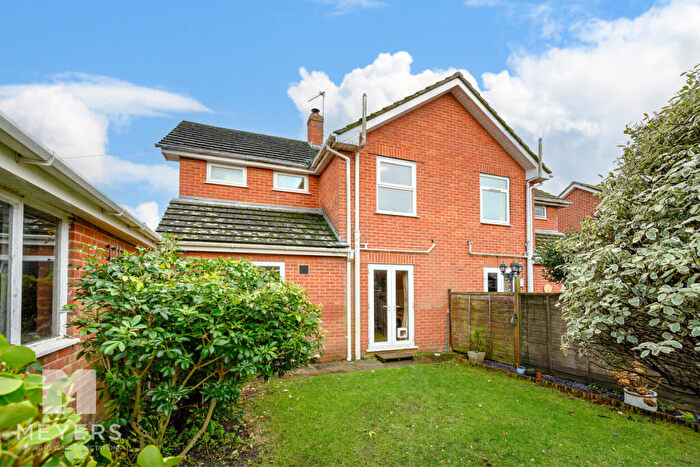
Houses for sale & to rent in Ringwood East And Sopley, Ringwood
House Prices in Ringwood East And Sopley
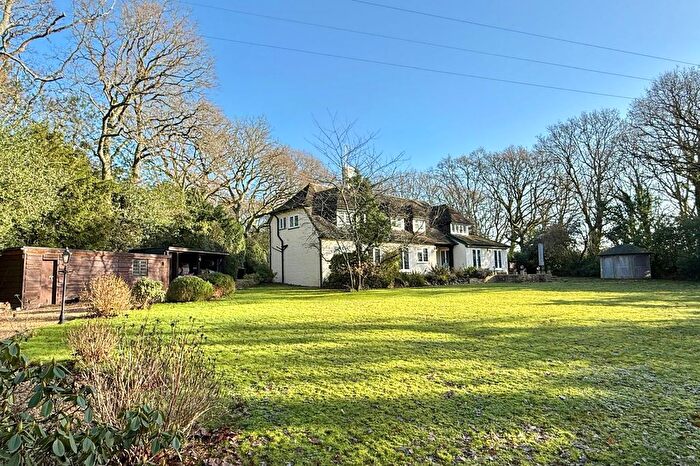
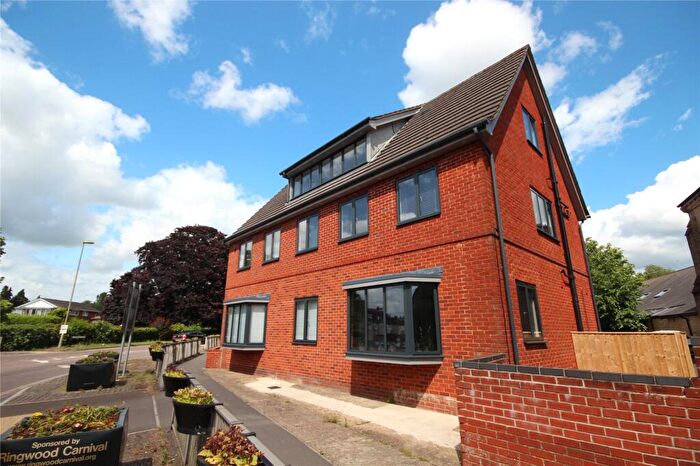
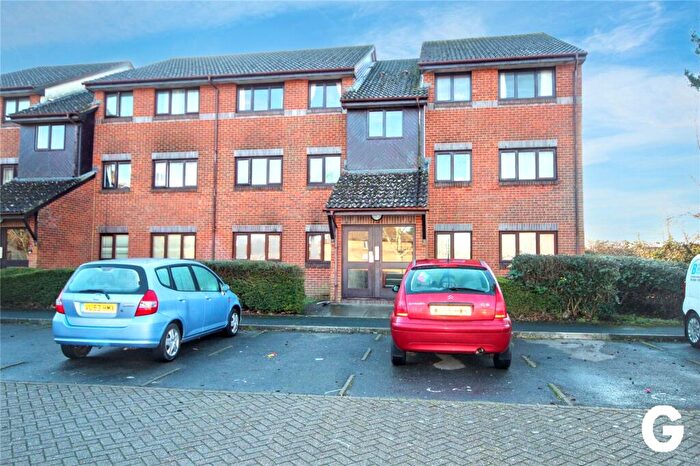
Properties in Ringwood East And Sopley have an average house price of £707,893.00 and had 61 Property Transactions within the last 3 years¹.
Ringwood East And Sopley is an area in Ringwood, Hampshire with 742 households², where the most expensive property was sold for £2,660,000.00.
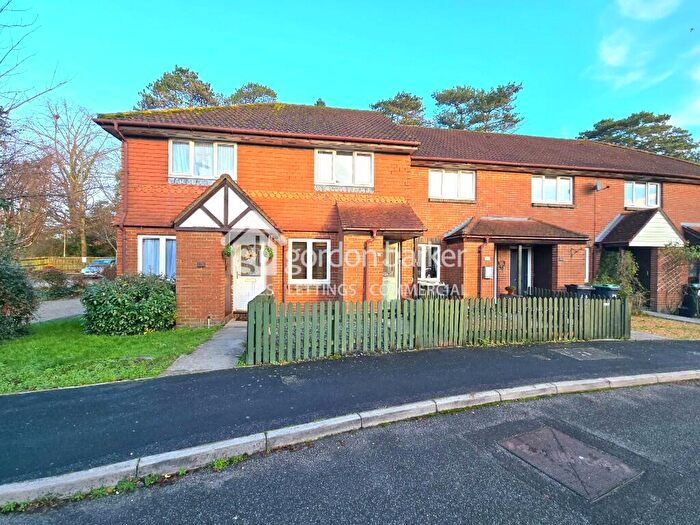
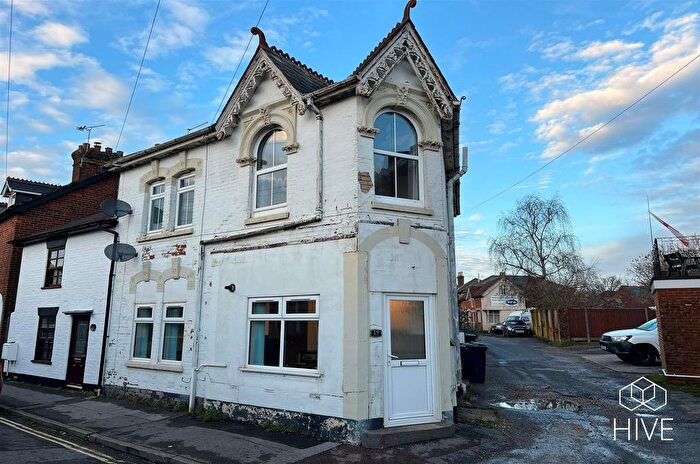
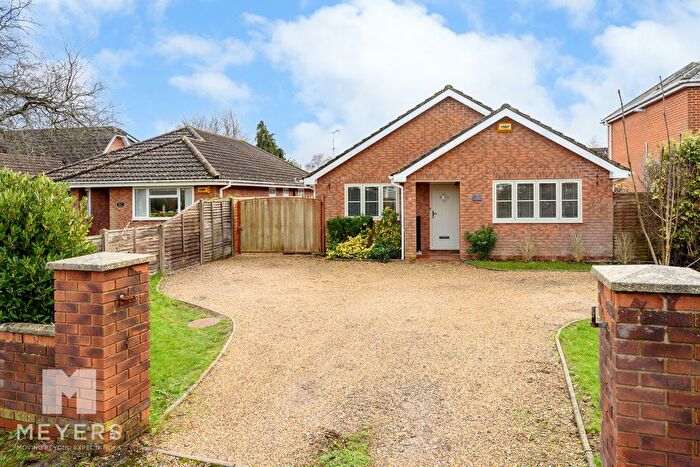
Properties for sale in Ringwood East And Sopley
Roads and Postcodes in Ringwood East And Sopley
Navigate through our locations to find the location of your next house in Ringwood East And Sopley, Ringwood for sale or to rent.
| Streets | Postcodes |
|---|---|
| Ash Grove | BH24 1XT |
| Ashburn Garth | BH24 3DS |
| Ashley Close | BH24 1QX |
| Barrack Lane | BH24 3ES |
| Burcombe Lane | BH24 3JT |
| Charles's Lane | BH24 3FB |
| Cowpitts Lane | BH24 3JX |
| Crow Hill | BH24 3DB BH24 3DD BH24 3DE BH24 3DH BH24 3DQ |
| Crow Lane | BH24 3DZ |
| Eastfield Lane | BH24 1UN BH24 1UW |
| Forest Corner | BH24 3HP BH24 3HW |
| Forest Edge Road | BH24 3DF |
| Forest Hills Court | BH24 1QR |
| Forest Lane | BH24 3HF |
| Forestlake Avenue | BH24 1QU |
| Greenfinch Walk | BH24 3RJ |
| Hangersley Hill | BH24 3JP BH24 3JR BH24 3JS BH24 3JW |
| Hightown Hill | BH24 3HA BH24 3HB BH24 3HD BH24 3HE BH24 3HG BH24 3HQ |
| Holmwood Garth | BH24 3DT |
| Lakeside | BH24 3DX |
| Lakeview Drive | BH24 3DR |
| Linnet Close | BH24 3RE |
| Merlin Close | BH24 3RB |
| Narrow Lane | BH24 3EN |
| Nouale Lane | BH24 3EL |
| Pelican Mead | BH24 3RG BH24 3RH |
| Picket Hill | BH24 3HH BH24 3HJ |
| Poulner Common | BH24 3LB |
| Poulner Hill | BH24 3HR BH24 3HS |
| Sanderlings | BH24 3RL |
| St Aubyns Lane | BH24 3JU |
| Swan Mead | BH24 3RD |
| The Cloisters | BH24 3DU |
| Watership Drive | BH24 1QY |
| Woodend Road | BH24 3DG |
| Wren Close | BH24 3RF |
| BH24 3BZ BH24 3DA BH24 3DY BH24 3HZ BH24 3JN BH24 3BT |
Transport near Ringwood East And Sopley
-
Hinton Admiral Station
-
Christchurch Station
-
New Milton Station
-
Sway Station
-
Pokesdown Station
-
Brockenhurst Station
-
Bournemouth Station
- FAQ
- Price Paid By Year
- Property Type Price
Frequently asked questions about Ringwood East And Sopley
What is the average price for a property for sale in Ringwood East And Sopley?
The average price for a property for sale in Ringwood East And Sopley is £707,893. This amount is 49% higher than the average price in Ringwood. There are 1,655 property listings for sale in Ringwood East And Sopley.
What streets have the most expensive properties for sale in Ringwood East And Sopley?
The streets with the most expensive properties for sale in Ringwood East And Sopley are Hangersley Hill at an average of £1,191,666, Poulner Hill at an average of £1,092,500 and Cowpitts Lane at an average of £968,333.
What streets have the most affordable properties for sale in Ringwood East And Sopley?
The streets with the most affordable properties for sale in Ringwood East And Sopley are Ash Grove at an average of £353,333, Burcombe Lane at an average of £362,500 and Eastfield Lane at an average of £397,500.
Which train stations are available in or near Ringwood East And Sopley?
Some of the train stations available in or near Ringwood East And Sopley are Hinton Admiral, Christchurch and New Milton.
Property Price Paid in Ringwood East And Sopley by Year
The average sold property price by year was:
| Year | Average Sold Price | Price Change |
Sold Properties
|
|---|---|---|---|
| 2025 | £530,222 | -49% |
9 Properties |
| 2024 | £792,458 | -4% |
12 Properties |
| 2023 | £827,857 | 20% |
14 Properties |
| 2022 | £665,769 | -2% |
26 Properties |
| 2021 | £680,333 | 4% |
33 Properties |
| 2020 | £649,959 | 11% |
22 Properties |
| 2019 | £579,500 | -6% |
19 Properties |
| 2018 | £612,995 | 18% |
22 Properties |
| 2017 | £504,976 | 7% |
21 Properties |
| 2016 | £468,183 | -21% |
27 Properties |
| 2015 | £567,649 | 26% |
27 Properties |
| 2014 | £420,710 | -15% |
34 Properties |
| 2013 | £485,724 | 33% |
20 Properties |
| 2012 | £325,365 | -40% |
19 Properties |
| 2011 | £456,905 | 27% |
25 Properties |
| 2010 | £331,918 | -10% |
16 Properties |
| 2009 | £365,777 | -54% |
18 Properties |
| 2008 | £563,261 | 15% |
16 Properties |
| 2007 | £476,123 | 24% |
28 Properties |
| 2006 | £364,031 | -24% |
35 Properties |
| 2005 | £453,098 | 23% |
25 Properties |
| 2004 | £347,990 | -5% |
31 Properties |
| 2003 | £364,269 | 21% |
31 Properties |
| 2002 | £287,895 | 14% |
45 Properties |
| 2001 | £248,720 | 11% |
42 Properties |
| 2000 | £221,461 | 5% |
46 Properties |
| 1999 | £210,094 | 10% |
44 Properties |
| 1998 | £189,202 | 7% |
52 Properties |
| 1997 | £175,094 | 27% |
29 Properties |
| 1996 | £128,514 | -3% |
44 Properties |
| 1995 | £132,355 | - |
34 Properties |
Property Price per Property Type in Ringwood East And Sopley
Here you can find historic sold price data in order to help with your property search.
The average Property Paid Price for specific property types in the last three years are:
| Property Type | Average Sold Price | Sold Properties |
|---|---|---|
| Detached House | £806,927.00 | 48 Detached Houses |
| Terraced House | £338,000.00 | 5 Terraced Houses |
| Semi Detached House | £395,625.00 | 4 Semi Detached Houses |
| Flat | £294,125.00 | 4 Flats |

