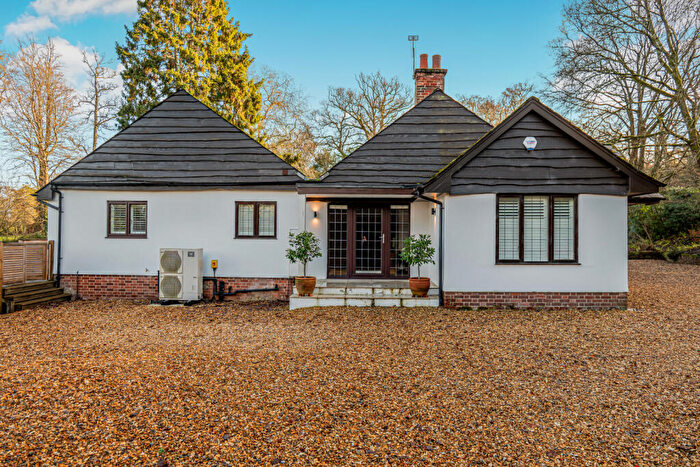
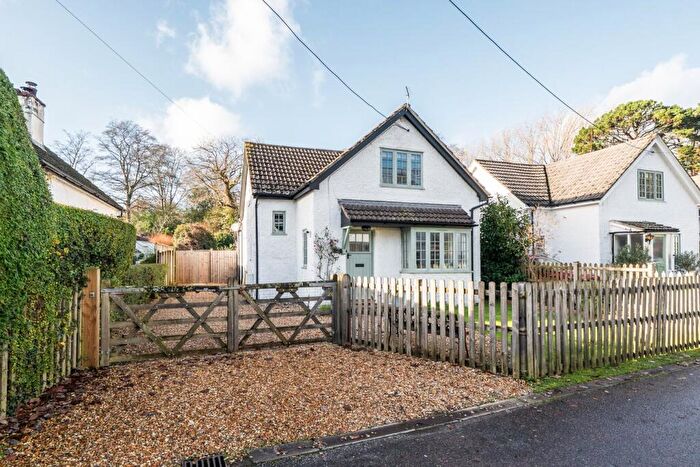
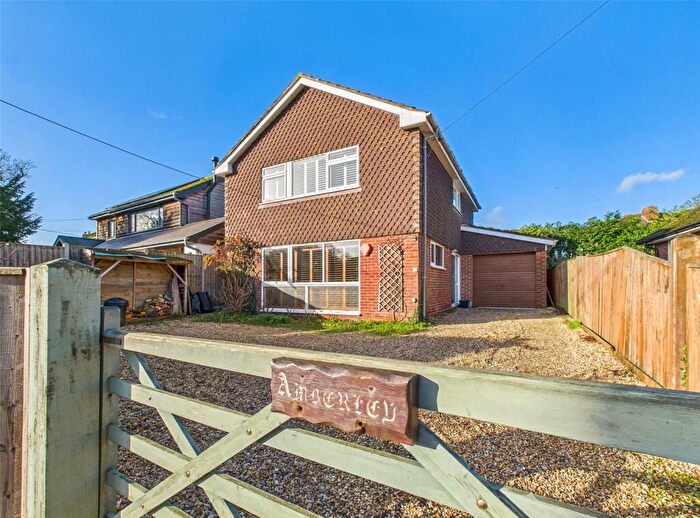
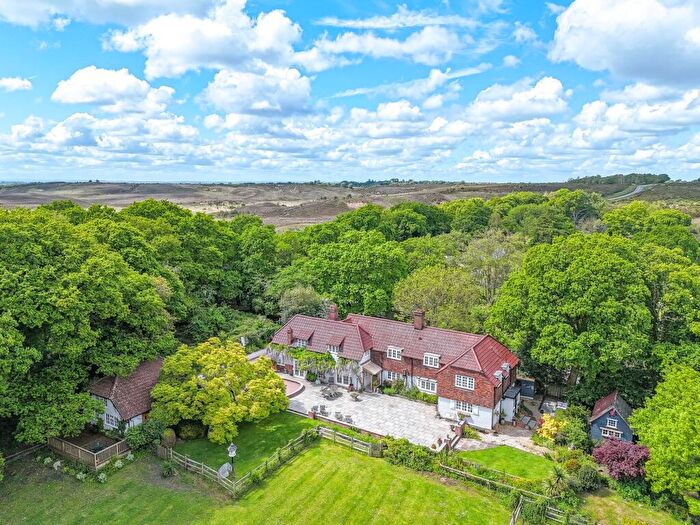
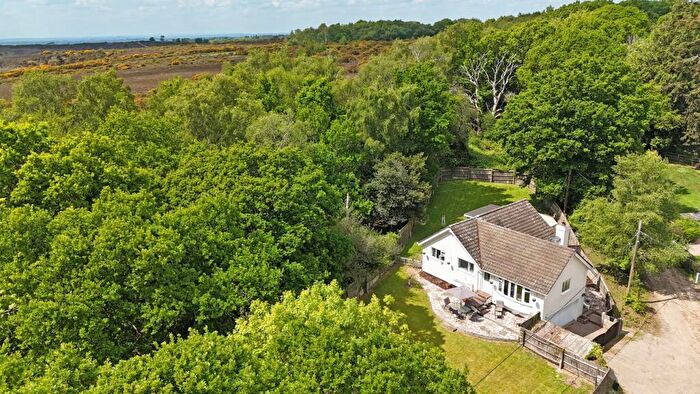
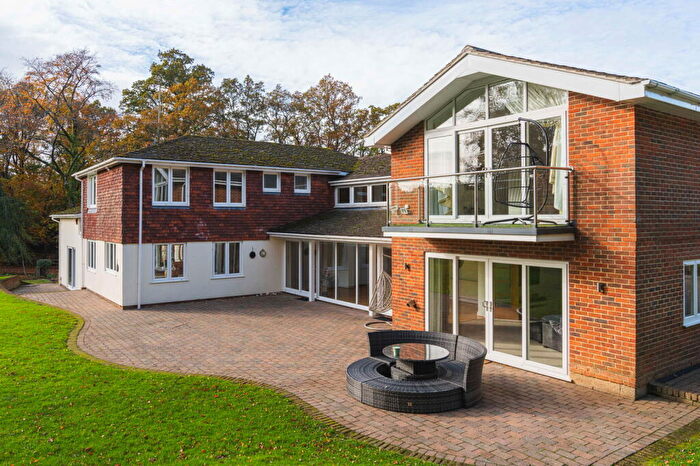
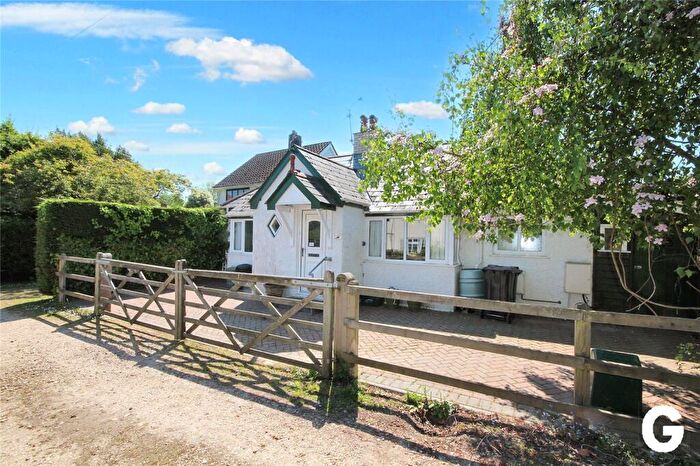
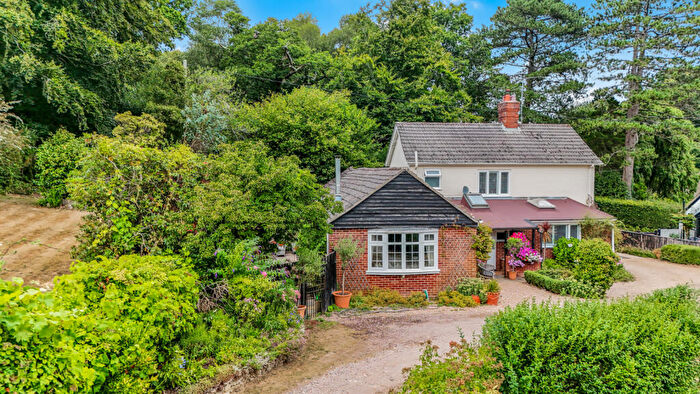
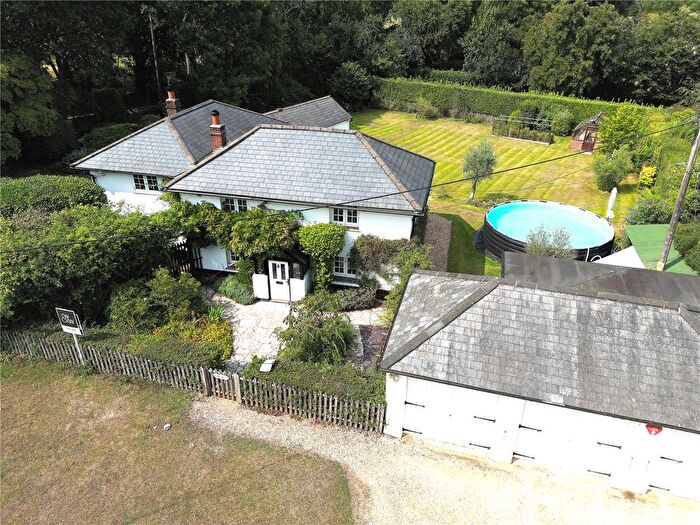
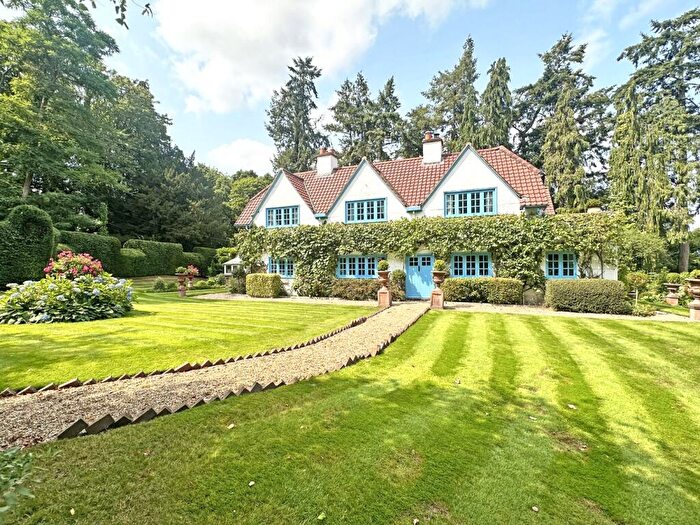
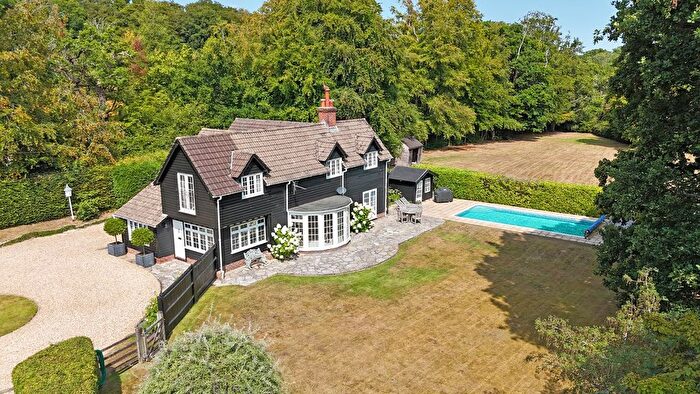
Houses for sale & to rent in Bransgore And Burley, Ringwood
House Prices in Bransgore And Burley
Properties in Bransgore And Burley have an average house price of £1,047,102.00 and had 61 Property Transactions within the last 3 years¹.
Bransgore And Burley is an area in Ringwood, Hampshire with 584 households², where the most expensive property was sold for £2,815,000.00.
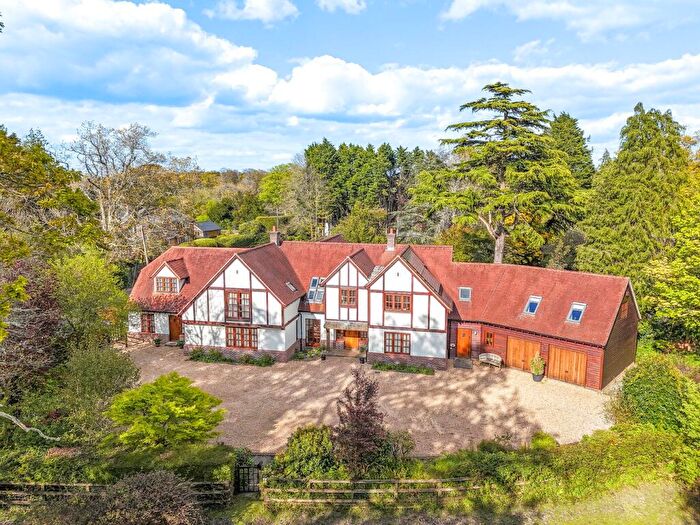
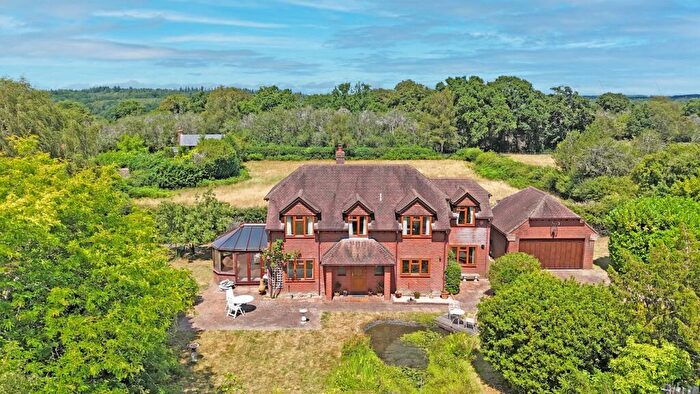
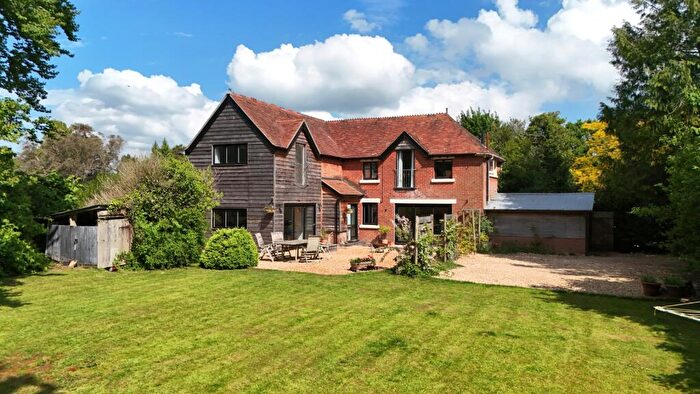
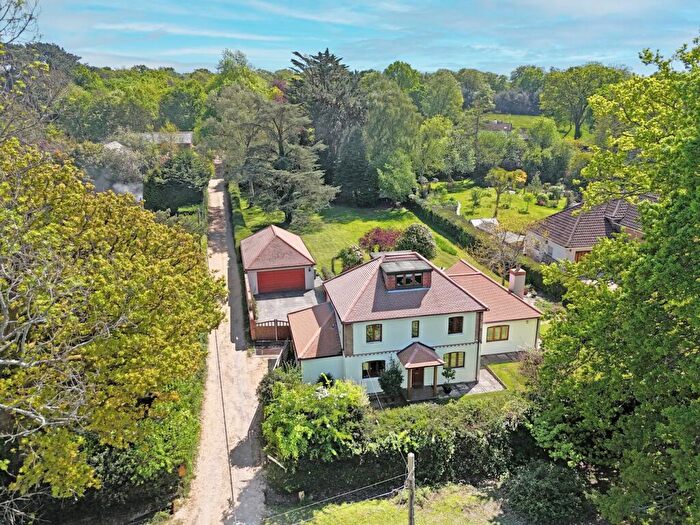
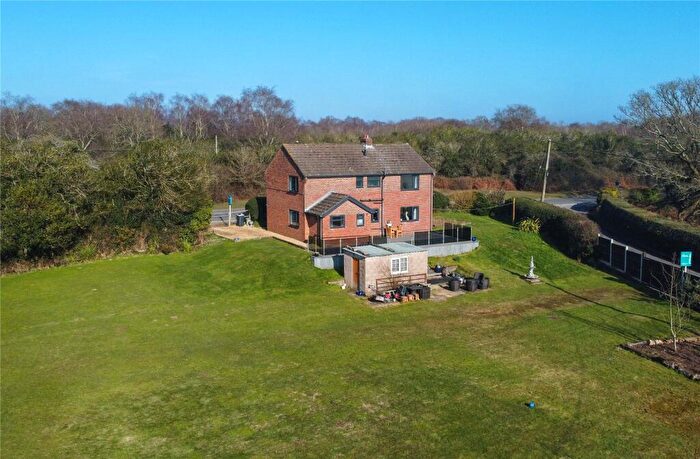
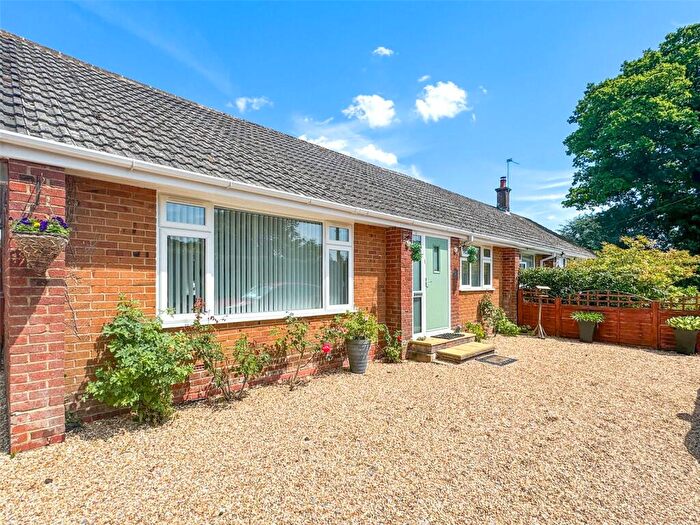
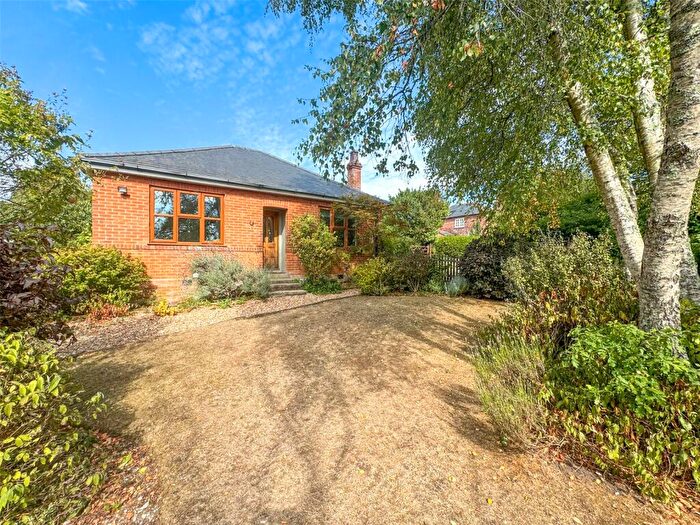
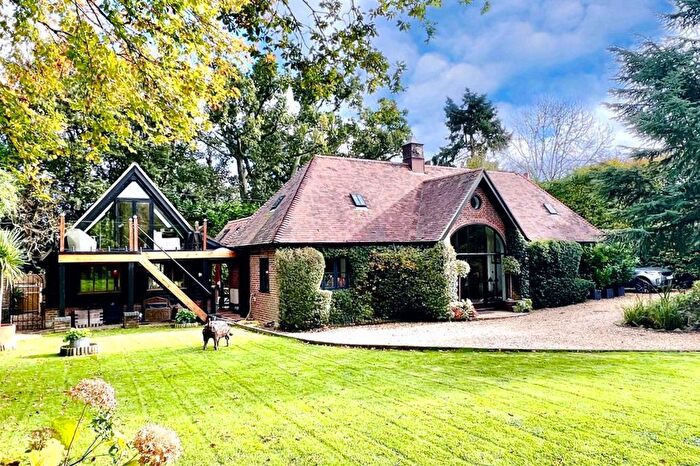
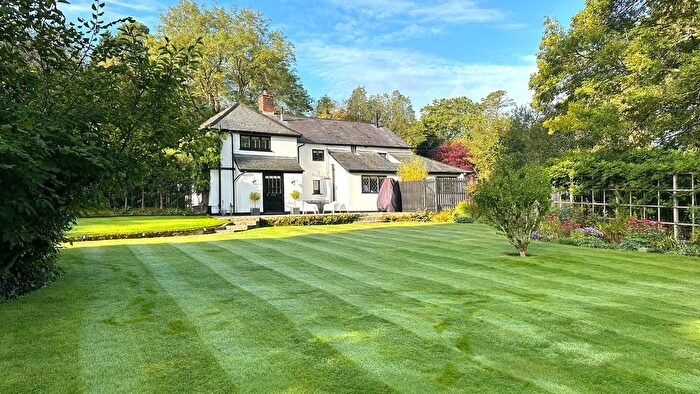
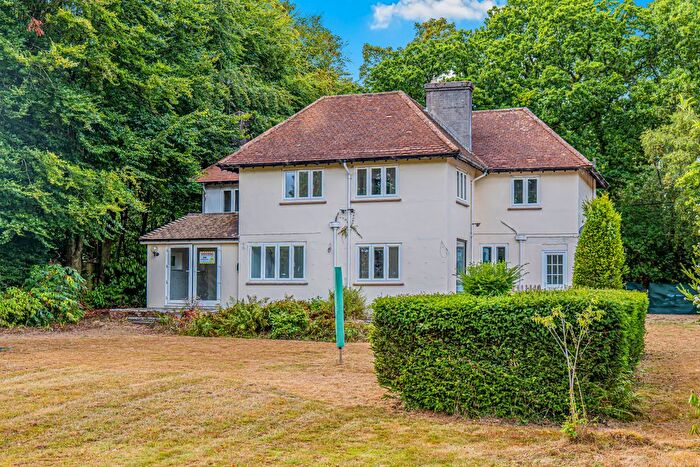
Properties for sale in Bransgore And Burley
Previously listed properties in Bransgore And Burley
Roads and Postcodes in Bransgore And Burley
Navigate through our locations to find the location of your next house in Bransgore And Burley, Ringwood for sale or to rent.
| Streets | Postcodes |
|---|---|
| Beechwood Lane | BH24 4AR BH24 4AS |
| Bennetts Lane | BH24 4AT |
| Bisterne Close | BH24 4AU BH24 4AY BH24 4AZ BH24 4BA |
| Burley Hill | BH24 4HE |
| Burley Lawn | BH24 4DL |
| Burley Street | BH24 4DB BH24 4DD BH24 4HQ BH24 4BZ |
| Castle Hill Lane | BH24 4EW BH24 4HF BH24 4HG |
| Chapel Haye | BH24 4DG |
| Chapel Lane | BH24 4DH BH24 4DJ |
| Church Lane | BH24 4AP BH24 4BD |
| Clough Lane | BH24 4AE |
| Coach Hill Lane | BH24 4HL BH24 4HN |
| Copse Road | BH24 4EG |
| Cott Lane | BH24 4BB |
| Doveys Close | BH24 4BP |
| Esdaile Lane | BH24 4AF |
| Forest Road | BH24 4DE BH24 4DQ |
| Garden Road | BH24 4EA |
| Harry Law Cottages | BH24 4ER |
| Holmsley | BH24 4HX BH24 4HY |
| Honey Lane | BH24 4BX BH24 4EN |
| Howard Close | BH24 4AJ |
| Lester Square | BH24 4BE |
| Longmead Road | BH24 4BY |
| Lyndhurst Road | BH24 4HW |
| Meadow Close | BH24 4EJ |
| Mill Lane | BH24 4HP BH24 4HR |
| Moorhill | BH24 4AH |
| Pound Lane | BH24 4EB BH24 4ED BH24 4EE BH24 4EF |
| Randalls Lane | BH24 4HJ |
| Ringwood Road | BH24 4AD BH24 4BS BH24 4BU |
| Shappen Bottom | BH24 4AG |
| Shappen Hill Lane | BH24 4EP |
| Southfield Lane | BH24 4AX |
| The Cross | BH24 4AA BH24 4AB |
| Turf Croft | BH24 4DF |
| Tyrells Lane | BH24 4DA |
| Vereley | BH24 4HH |
| Warnes Lane | BH24 4EH BH24 4EL BH24 4EQ |
| BH24 3HN BH24 4HS BH24 4HT BH24 4HU |
Transport near Bransgore And Burley
-
Sway Station
-
Hinton Admiral Station
-
New Milton Station
-
Brockenhurst Station
-
Christchurch Station
-
Lymington Town Station
-
Ashurst New Forest Station
-
Beaulieu Road Station
-
Pokesdown Station
-
Lymington Pier Station
- FAQ
- Price Paid By Year
- Property Type Price
Frequently asked questions about Bransgore And Burley
What is the average price for a property for sale in Bransgore And Burley?
The average price for a property for sale in Bransgore And Burley is £1,047,102. This amount is 121% higher than the average price in Ringwood. There are 321 property listings for sale in Bransgore And Burley.
What streets have the most expensive properties for sale in Bransgore And Burley?
The streets with the most expensive properties for sale in Bransgore And Burley are Lyndhurst Road at an average of £1,844,000, Burley Lawn at an average of £1,676,666 and Beechwood Lane at an average of £1,483,333.
What streets have the most affordable properties for sale in Bransgore And Burley?
The streets with the most affordable properties for sale in Bransgore And Burley are Lester Square at an average of £407,500, Esdaile Lane at an average of £598,500 and Randalls Lane at an average of £625,000.
Which train stations are available in or near Bransgore And Burley?
Some of the train stations available in or near Bransgore And Burley are Sway, Hinton Admiral and New Milton.
Property Price Paid in Bransgore And Burley by Year
The average sold property price by year was:
| Year | Average Sold Price | Price Change |
Sold Properties
|
|---|---|---|---|
| 2025 | £901,222 | -19% |
9 Properties |
| 2024 | £1,076,466 | 19% |
18 Properties |
| 2023 | £876,713 | -39% |
15 Properties |
| 2022 | £1,222,904 | 21% |
19 Properties |
| 2021 | £960,264 | 20% |
25 Properties |
| 2020 | £767,493 | -9% |
22 Properties |
| 2019 | £833,791 | 11% |
17 Properties |
| 2018 | £739,100 | -22% |
15 Properties |
| 2017 | £901,264 | 5% |
17 Properties |
| 2016 | £854,657 | 25% |
26 Properties |
| 2015 | £640,755 | -7% |
22 Properties |
| 2014 | £686,003 | 18% |
29 Properties |
| 2013 | £560,684 | 12% |
19 Properties |
| 2012 | £494,184 | -36% |
19 Properties |
| 2011 | £672,947 | 0,1% |
19 Properties |
| 2010 | £672,352 | 21% |
21 Properties |
| 2009 | £530,833 | -44% |
15 Properties |
| 2008 | £765,150 | 4% |
20 Properties |
| 2007 | £736,889 | -2% |
26 Properties |
| 2006 | £751,059 | 13% |
32 Properties |
| 2005 | £653,738 | -21% |
22 Properties |
| 2004 | £792,403 | 30% |
26 Properties |
| 2003 | £553,465 | 17% |
25 Properties |
| 2002 | £458,118 | 28% |
33 Properties |
| 2001 | £328,613 | -5% |
40 Properties |
| 2000 | £345,270 | 22% |
37 Properties |
| 1999 | £268,240 | -9% |
25 Properties |
| 1998 | £293,443 | -11% |
35 Properties |
| 1997 | £325,311 | 28% |
29 Properties |
| 1996 | £234,988 | 31% |
31 Properties |
| 1995 | £162,833 | - |
21 Properties |
Property Price per Property Type in Bransgore And Burley
Here you can find historic sold price data in order to help with your property search.
The average Property Paid Price for specific property types in the last three years are:
| Property Type | Average Sold Price | Sold Properties |
|---|---|---|
| Semi Detached House | £544,218.00 | 8 Semi Detached Houses |
| Detached House | £1,180,762.00 | 49 Detached Houses |
| Terraced House | £415,537.00 | 4 Terraced Houses |

