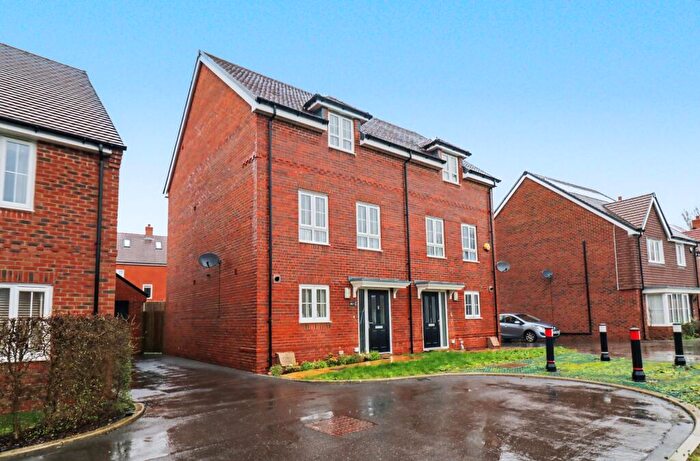
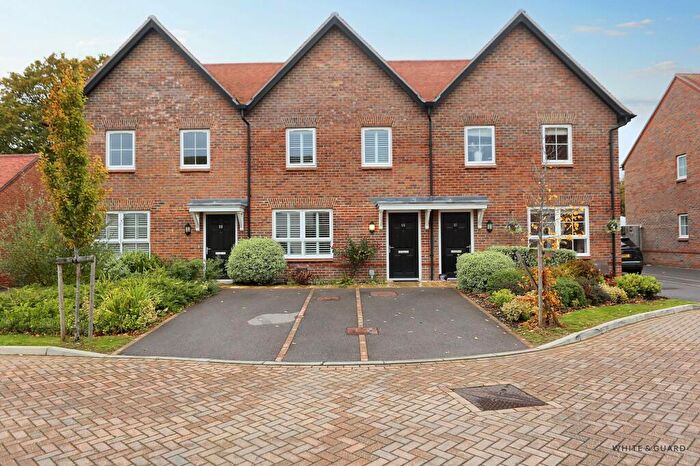
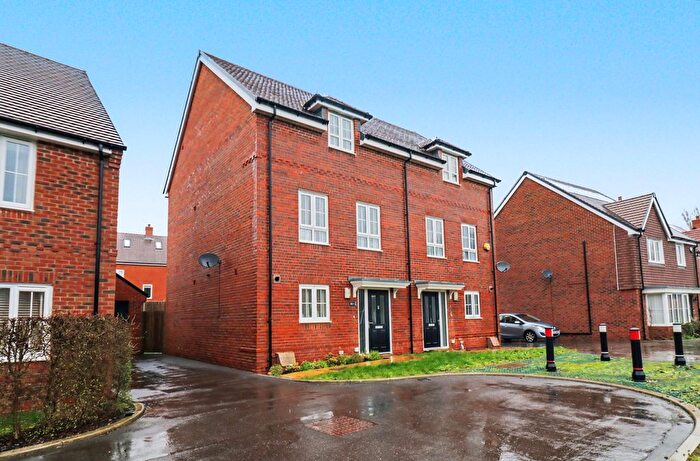
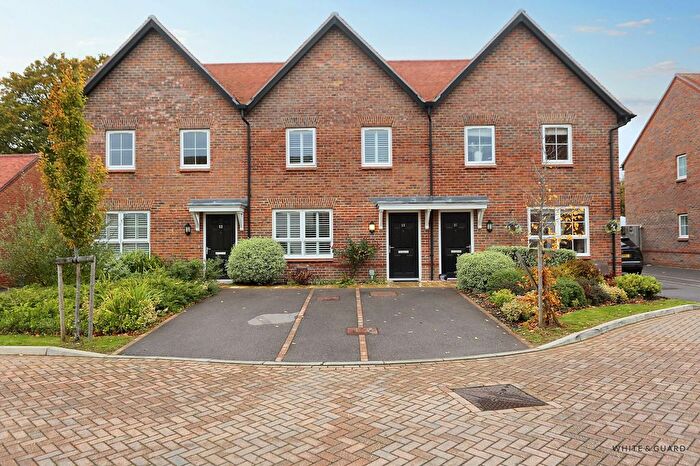
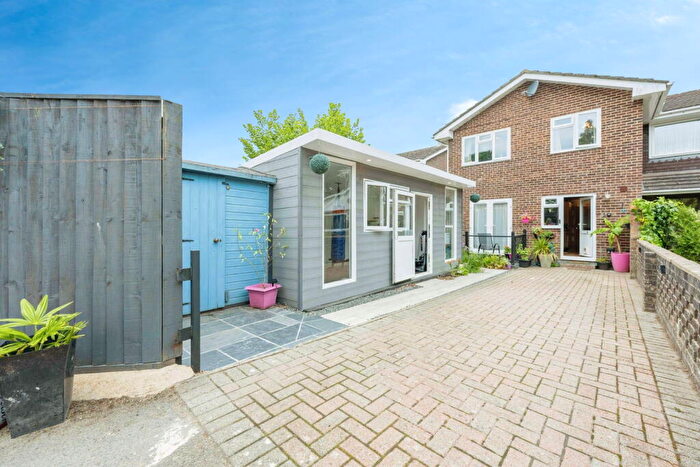
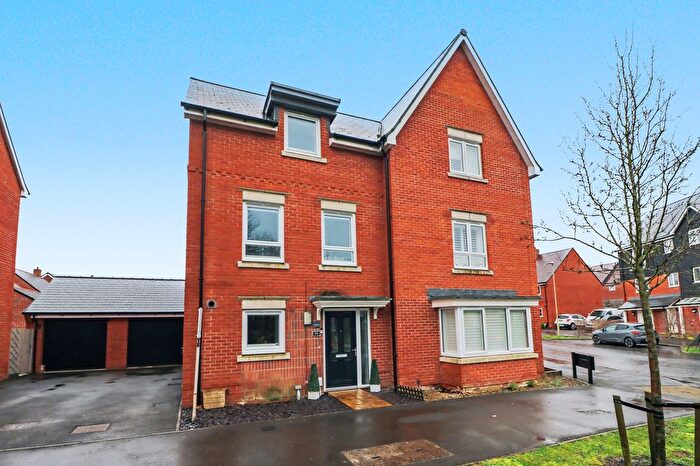
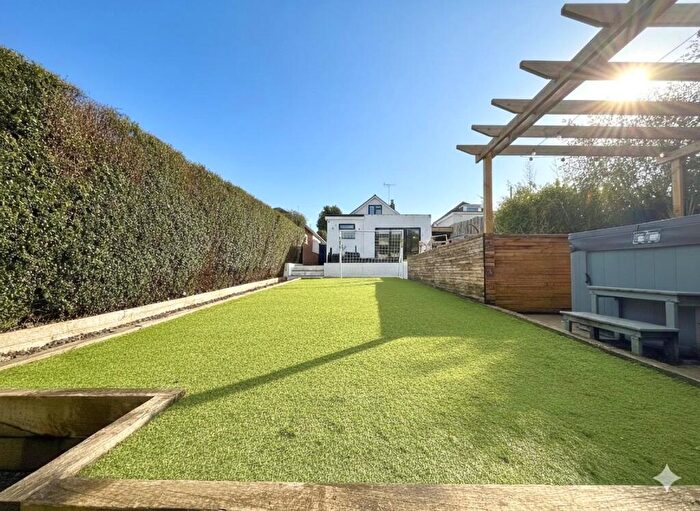
Houses for sale & to rent in Owslebury And Curdridge, Southampton
House Prices in Owslebury And Curdridge
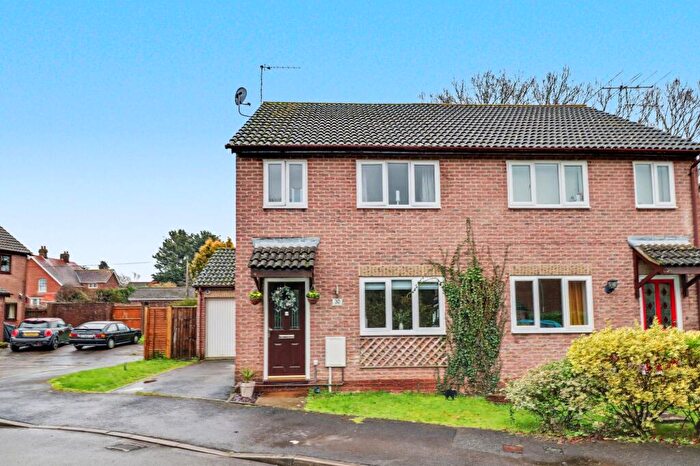
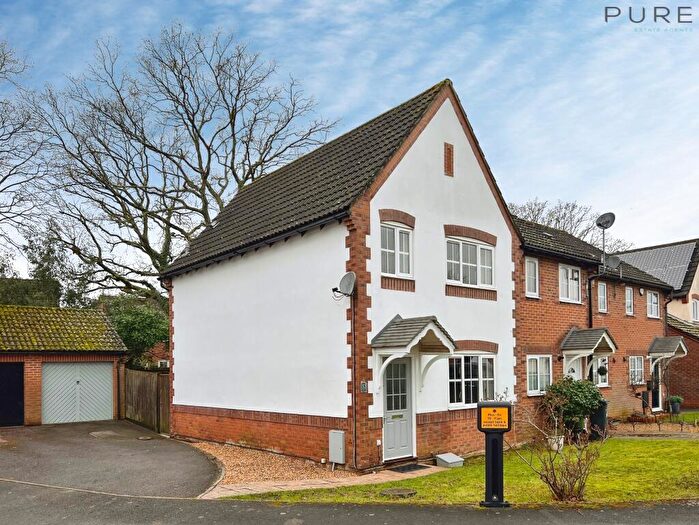
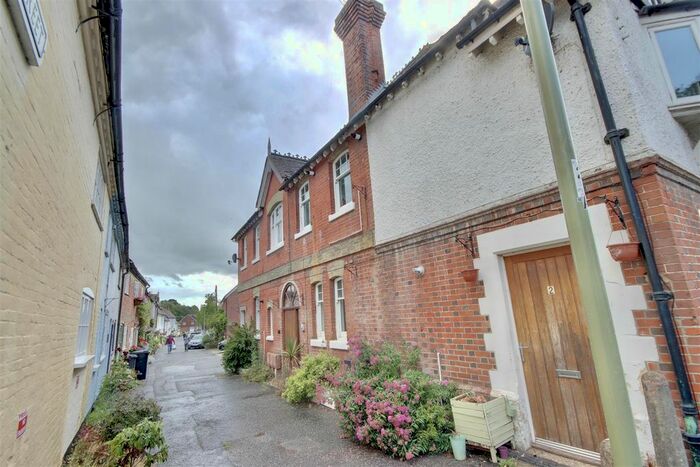
Properties in Owslebury And Curdridge have an average house price of £817,149.00 and had 77 Property Transactions within the last 3 years¹.
Owslebury And Curdridge is an area in Southampton, Hampshire with 1,077 households², where the most expensive property was sold for £2,600,000.00.
Properties for sale in Owslebury And Curdridge
Roads and Postcodes in Owslebury And Curdridge
Navigate through our locations to find the location of your next house in Owslebury And Curdridge, Southampton for sale or to rent.
| Streets | Postcodes |
|---|---|
| Blackdown Lane | SO32 1HS |
| Blind Lane | SO32 2BL |
| Botley Hill | SO30 2DL |
| Botley Road | SO30 2HB SO32 2DQ SO32 2DS SO32 2DU |
| Calcot Lane | SO32 2BN |
| Chapel Lane | SO32 2BB |
| Church Lane | SO32 2DR |
| Church Street | SO32 1JH |
| Clevedon Cottages | SO32 1HE |
| Curbridge | SO30 2HA |
| Curdridge Lane | SO32 2BH SO32 2BJ |
| Durley Brook Road | SO32 2AR |
| Durley Hall Lane | SO32 2AN |
| Durley Mews | SO32 2ER |
| Durley Street | SO32 2AA SO32 2AB |
| Elm Crescent | SO32 1JG |
| Gordon Road | SO32 2BE |
| Greenwood Lane | SO32 2AP |
| Gregory Lane | SO32 2BS |
| Heathen Street | SO32 2BT |
| Kitnocks Hill | SO32 2HJ |
| Kytes Lane | SO32 2AE |
| Lake Road | SO32 2HH |
| Lockhams Road | SO32 2BD |
| Manor Terrace | SO32 2AF |
| Mincingfield Terrace | SO32 2BR |
| Netherhill | SO32 2BP |
| Oak Close | SO32 1JF |
| Oakmore Park | SO32 2NU |
| Outlands Lane | SO30 2HD SO30 2JL |
| Parsonage Lane | SO32 2AD |
| Popes Lane | SO32 1JB |
| Reading Room Lane | SO32 2HE |
| Sciviers Lane | SO32 1HB SO32 2AG |
| Sherecroft Gardens | SO30 2TP |
| Shoe Lane | SO32 1JJ |
| Snakemoor Lane | SO32 2BW |
| St Peters Close | SO32 2HF |
| Stapleford Lane | SO32 2BU |
| The Crescent | SO32 1PZ |
| The Drove | SO32 2EY |
| The Plantation | SO32 2DT |
| The Sawmills | SO32 2EH |
| Upham Street | SO32 1JA SO32 1JD SO32 1PH |
| Vicarage Lane | SO32 2DP |
| Wangfield Lane | SO32 2DA |
| Whitehill | SO32 1JN |
| Wickham Road | SO32 2BA SO32 2HG |
| Widlers Lane | SO32 1JE |
| Winchester Road | SO32 1HA SO32 1HD SO32 1HJ |
| Woodcote | SO32 1HT |
| SO32 1HL SO32 1JL |
Transport near Owslebury And Curdridge
-
Botley Station
-
Hedge End Station
-
Eastleigh Station
-
Southampton Airport (Parkway) Station
-
Bursledon Station
-
Swanwick Station
- FAQ
- Price Paid By Year
- Property Type Price
Frequently asked questions about Owslebury And Curdridge
What is the average price for a property for sale in Owslebury And Curdridge?
The average price for a property for sale in Owslebury And Curdridge is £817,149. This amount is 111% higher than the average price in Southampton. There are 5,847 property listings for sale in Owslebury And Curdridge.
What streets have the most expensive properties for sale in Owslebury And Curdridge?
The streets with the most expensive properties for sale in Owslebury And Curdridge are Blackdown Lane at an average of £2,260,000, Durley Hall Lane at an average of £1,650,000 and Oakmore Park at an average of £1,440,000.
What streets have the most affordable properties for sale in Owslebury And Curdridge?
The streets with the most affordable properties for sale in Owslebury And Curdridge are St Peters Close at an average of £370,000, Curdridge Lane at an average of £430,000 and The Sawmills at an average of £458,083.
Which train stations are available in or near Owslebury And Curdridge?
Some of the train stations available in or near Owslebury And Curdridge are Botley, Hedge End and Eastleigh.
Property Price Paid in Owslebury And Curdridge by Year
The average sold property price by year was:
| Year | Average Sold Price | Price Change |
Sold Properties
|
|---|---|---|---|
| 2025 | £703,989 | -14% |
25 Properties |
| 2024 | £802,524 | -20% |
30 Properties |
| 2023 | £965,681 | 19% |
22 Properties |
| 2022 | £782,210 | 14% |
38 Properties |
| 2021 | £672,637 | -6% |
38 Properties |
| 2020 | £710,338 | 28% |
31 Properties |
| 2019 | £514,789 | -38% |
20 Properties |
| 2018 | £708,814 | 7% |
35 Properties |
| 2017 | £661,578 | 1% |
32 Properties |
| 2016 | £653,884 | 6% |
25 Properties |
| 2015 | £614,382 | 4% |
32 Properties |
| 2014 | £587,294 | 2% |
43 Properties |
| 2013 | £577,950 | 4% |
37 Properties |
| 2012 | £555,965 | 12% |
30 Properties |
| 2011 | £490,319 | -1% |
28 Properties |
| 2010 | £497,560 | -13% |
25 Properties |
| 2009 | £563,214 | 13% |
35 Properties |
| 2008 | £488,275 | 0,4% |
29 Properties |
| 2007 | £486,220 | 8% |
50 Properties |
| 2006 | £444,929 | -4% |
43 Properties |
| 2005 | £461,627 | 13% |
45 Properties |
| 2004 | £402,569 | 11% |
60 Properties |
| 2003 | £358,727 | -2% |
45 Properties |
| 2002 | £365,360 | 8% |
61 Properties |
| 2001 | £335,692 | 9% |
53 Properties |
| 2000 | £304,334 | 25% |
42 Properties |
| 1999 | £229,291 | 6% |
44 Properties |
| 1998 | £216,030 | 19% |
39 Properties |
| 1997 | £174,319 | 8% |
44 Properties |
| 1996 | £159,855 | 7% |
40 Properties |
| 1995 | £147,902 | - |
23 Properties |
Property Price per Property Type in Owslebury And Curdridge
Here you can find historic sold price data in order to help with your property search.
The average Property Paid Price for specific property types in the last three years are:
| Property Type | Average Sold Price | Sold Properties |
|---|---|---|
| Semi Detached House | £535,562.00 | 20 Semi Detached Houses |
| Detached House | £957,419.00 | 53 Detached Houses |
| Terraced House | £366,500.00 | 4 Terraced Houses |

