
Houses for sale in Southampton, Hampshire
House Prices in Southampton
Properties in Southampton have an average house price of £388k and had 8,412 Property Transactions within the last 3 years.¹
Southampton is an area in Hampshire with 88,777 households², where the most expensive property was sold for £4.9M.
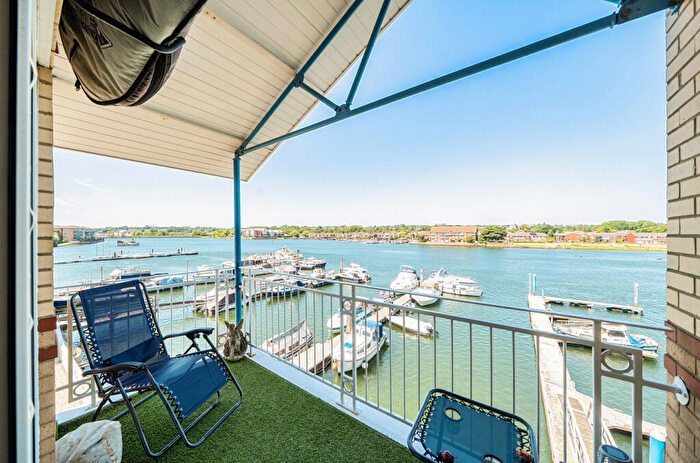
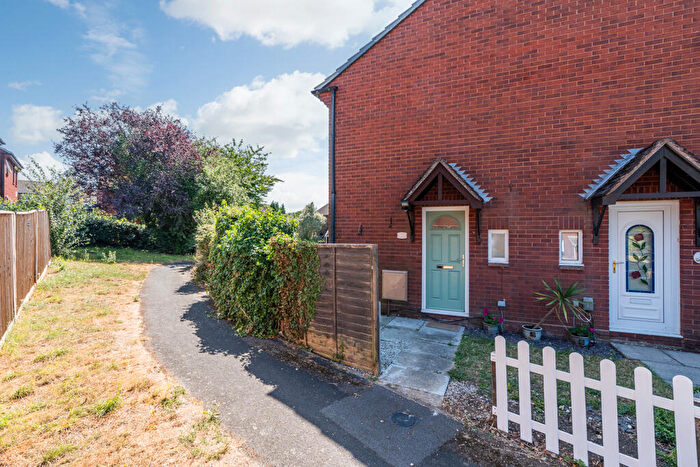
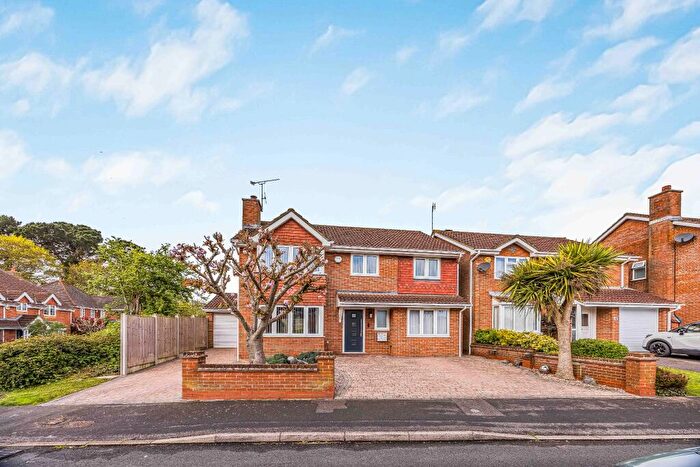
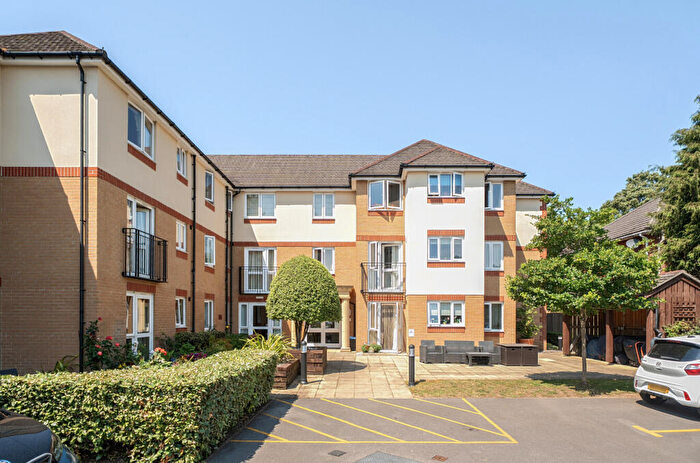
Properties for sale in Southampton
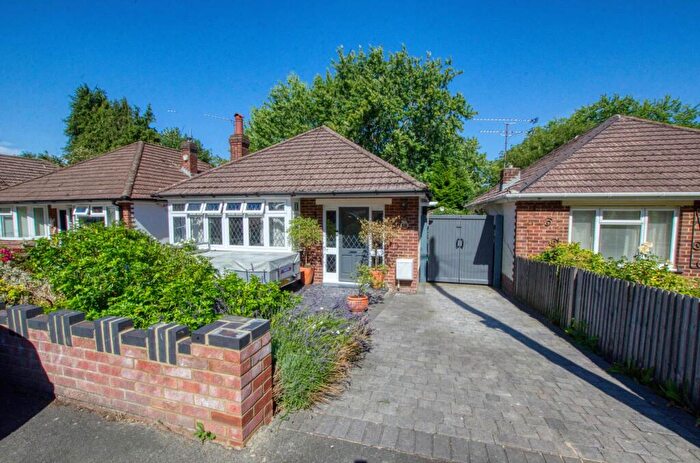
![]()
If you are looking to sell your house, let it out, or receive a property valuation, an expert can help you.
Click the button below to get started.

Neighbourhoods in Southampton
Navigate through our locations to find the location of your next house in Southampton, Hampshire for sale or to rent.
- Bishops Waltham
- Ashurst, Copythorne South And Netley Marsh
- Botley
- Bramshaw, Copythorne North And Minstead
- Brockenhurst And Forest South East
- Bursledon And Old Netley
- Butts Ash And Dibden Purlieu
- Chilworth, Nursling And Rownhams
- Dibden And Hythe East
- Droxford, Soberton And Hambledon
- Fair Oak And Horton Heath
- Fawley, Blackfield And Langley
- Furzedown And Hardley
- Hamble-le-rice And Butlocks Heath
- Hedge End Grange Park
- Hedge End St Johns
- Hedge End Wildern
- Holbury And North Blackfield
- Hythe West And Langdown
- Locks Heath
- Marchwood
- Netley Abbey
- North Baddesley
- Owslebury And Curdridge
- Park Gate
- Sarisbury
- Shedfield
- Swanmore And Newtown
- Titchfield Common
- Totton Central
- Totton East
- Totton North
- Totton South
- Totton West
- Upper Meon Valley
- Warsash
- West End North
- West End South
- Wickham
- Chilworth, Nursling & Rownhams
- Hedge End South
- Bursledon & Hound North
- Hedge End North
- Whiteley and Shedfield
- Hamble & Netley
- Fair Oak & Horton Heath
- Central Meon Valley
- Ampfield & Braishfield
- Redbridge
- Swaythling
- Bassett
- Millbrook
- Coxford
- Harefield
- Peartree
- Bitterne
- Bitterne Park
- Bargate
- Woolston
- Sholing
- Banister & Polygon
- Shirley
- Freemantle
- Fawley, Blackfield, Calshot & Langley
- Hythe South
- Bevois
- Portswood
- Thornhill
- Marchwood & Eling
- Hythe Central
Property price trends in Southampton
According to the latest Land Registry data, the average home in Southampton sold for £423,977 in 2026. That figure comes from a substantial record of 117,532 sales logged over the past 31 years.
Prices have continued to climb over the last three years. Compared with 2023, when the typical sale came in around £389,638, that's a rise of roughly 8.8%.
Looking back five years, average prices are up about 11.6% since 2021, a gain of around £44,107 in cash terms.
Zoom out to the past decade for the fuller picture. Back in 2016, homes here averaged £309,777, so the typical sold price has climbed about 36.9% since then, roughly 3.2% a year. Stretch the view to fifteen years and that annual pace edges up closer to 3.5%.
Frequently asked questions about Southampton
What is the average price for a property for sale in Southampton?
The average price for a property for sale in Southampton is £387,804. This amount is 8% lower than the average price in Hampshire. There are more than 10,000 property listings for sale in Southampton.
What locations have the most expensive properties for sale in Southampton?
The locations with the most expensive properties for sale in Southampton are Wickham at an average of £1,600,000, Brockenhurst And Forest South East at an average of £1,334,500 and Upper Meon Valley at an average of £790,278.
What locations have the most affordable properties for sale in Southampton?
The locations with the most affordable properties for sale in Southampton are Harefield at an average of £181,400, Woolston at an average of £194,134 and Hedge End South at an average of £229,343.
Which train stations are available in or near Southampton?
Some of the train stations available in or near Southampton are Sholing, Woolston and Bitterne.
Property Price Paid in Southampton by Year
The average sold property price by year was:
| Year | Average Sold Price | Price Change |
Sold Properties
|
|---|---|---|---|
| 2026 | £423,977 | 9% |
221 Properties |
| 2025 | £387,182 | 1% |
2,796 Properties |
| 2024 | £384,036 | -1% |
2,883 Properties |
| 2023 | £389,638 | -5% |
2,512 Properties |
| 2022 | £407,381 | 7% |
3,287 Properties |
| 2021 | £379,870 | 4% |
4,350 Properties |
| 2020 | £366,501 | 7% |
3,124 Properties |
| 2019 | £341,088 | -0,1% |
3,532 Properties |
| 2018 | £341,470 | 3% |
3,805 Properties |
| 2017 | £332,872 | 7% |
3,711 Properties |
Property Price per Property Type in Southampton
Here you can find historic sold price data in order to help with your property search.
The average Property Paid Price for specific property types in the last three years are:
| Property Type | Average Sold Price | Sold Properties |
|---|---|---|
| Semi Detached House | £351,115.00 | 2,130 Semi Detached Houses |
| Terraced House | £291,260.00 | 1,921 Terraced Houses |
| Detached House | £546,571.00 | 3,139 Detached Houses |
| Flat | £195,691.00 | 1,222 Flats |
Transport in Southampton
Please see below transportation links in this area:
