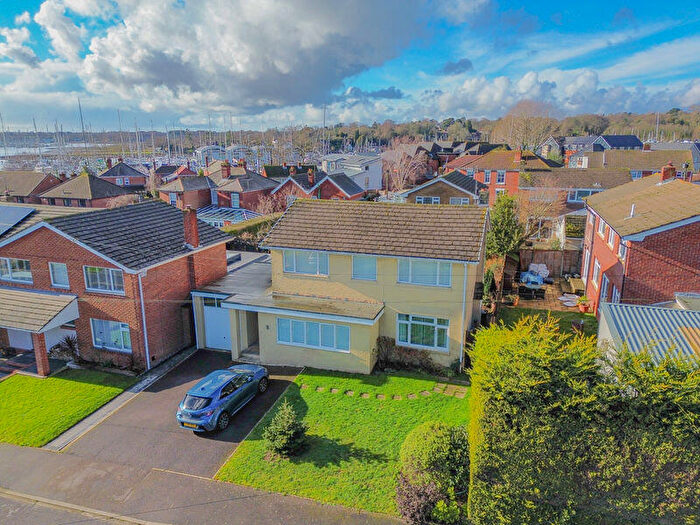
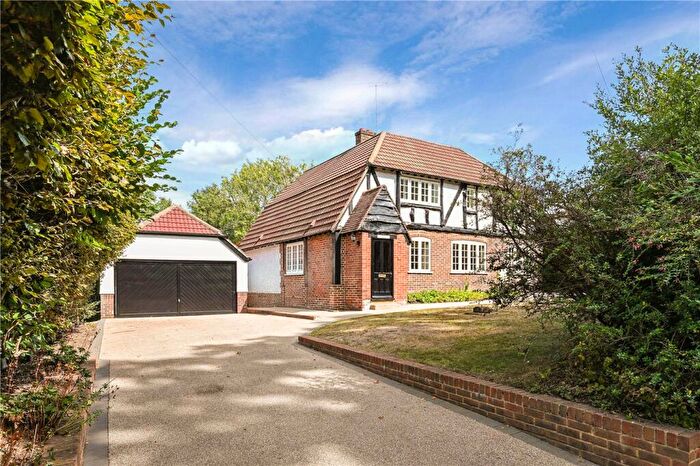
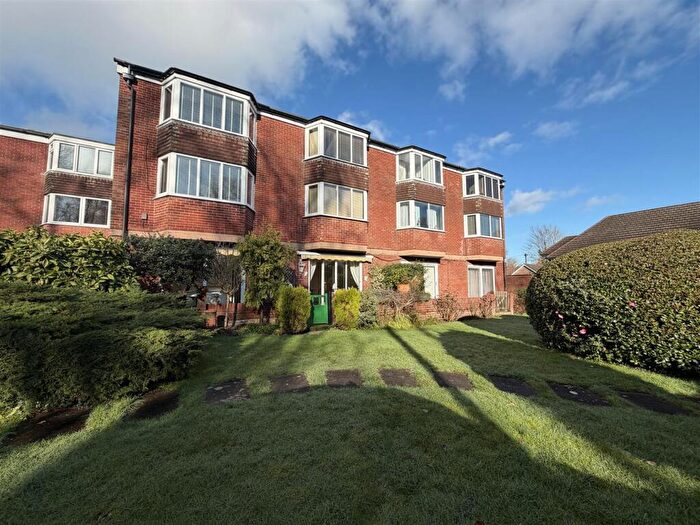
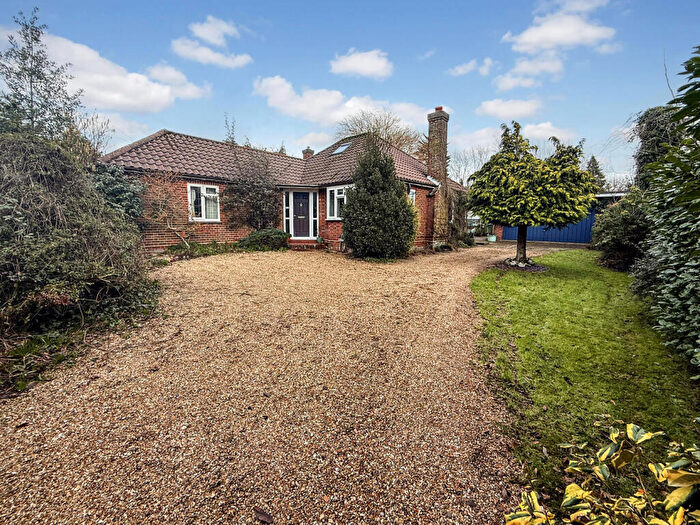
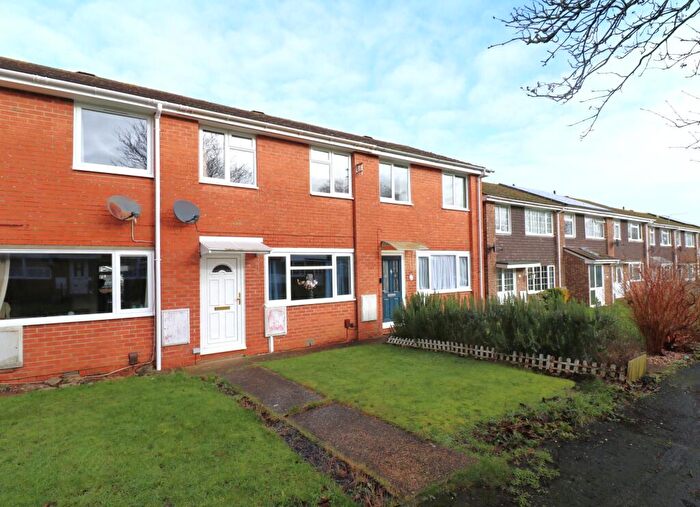
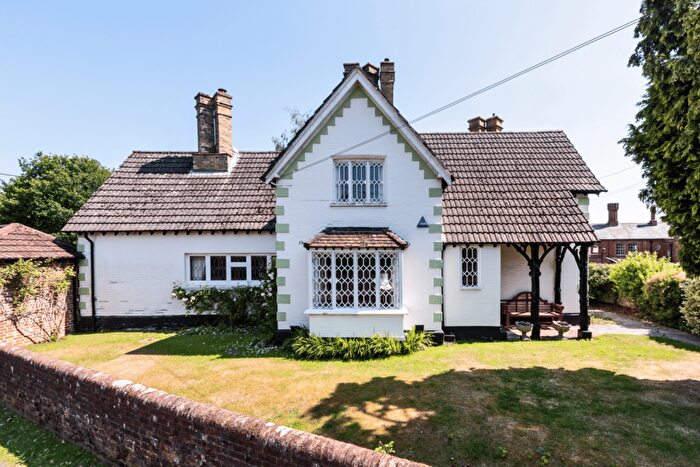
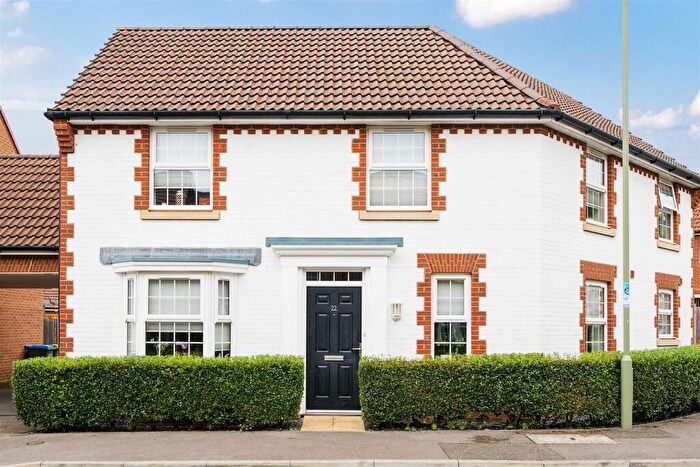
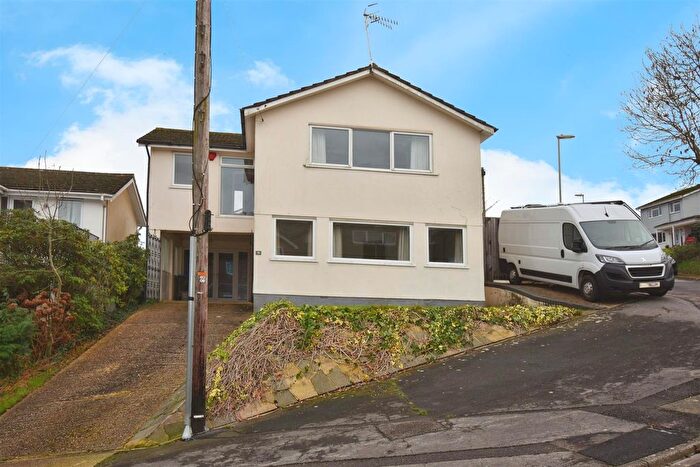
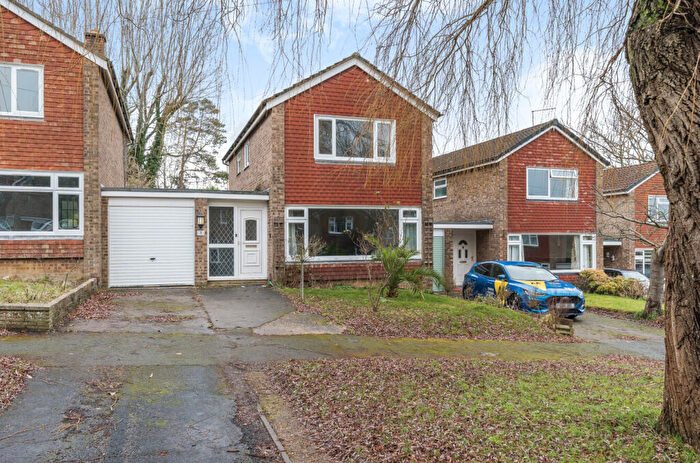
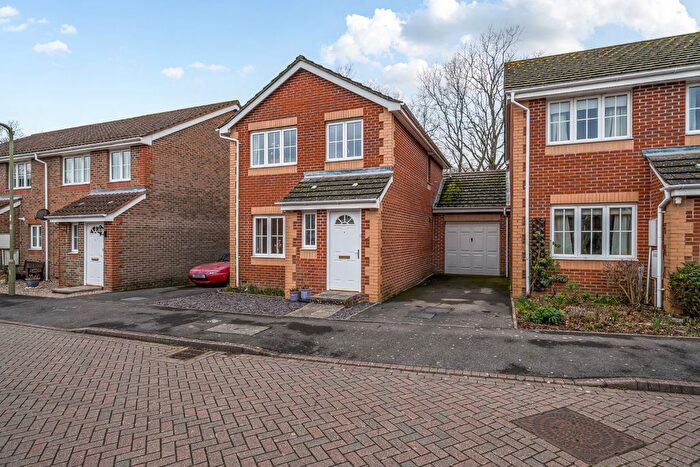
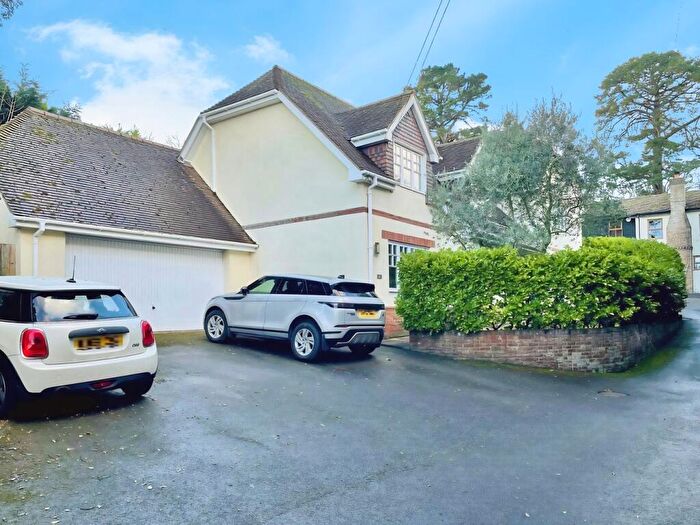
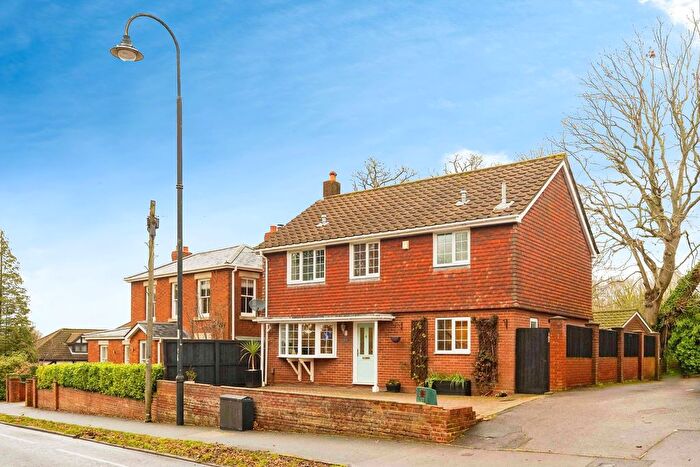
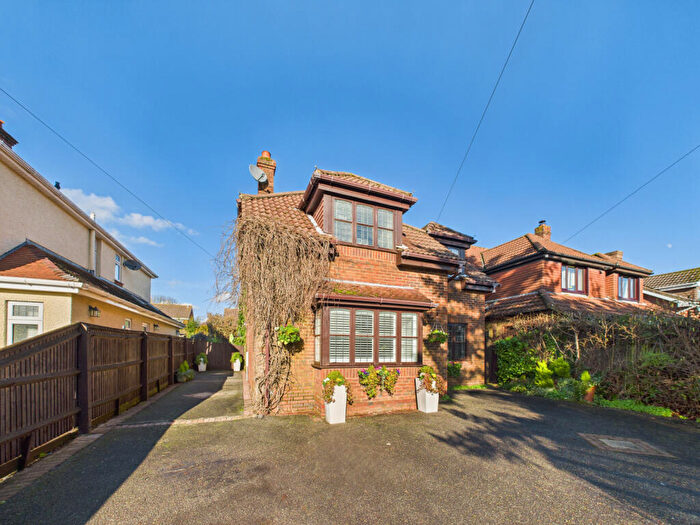
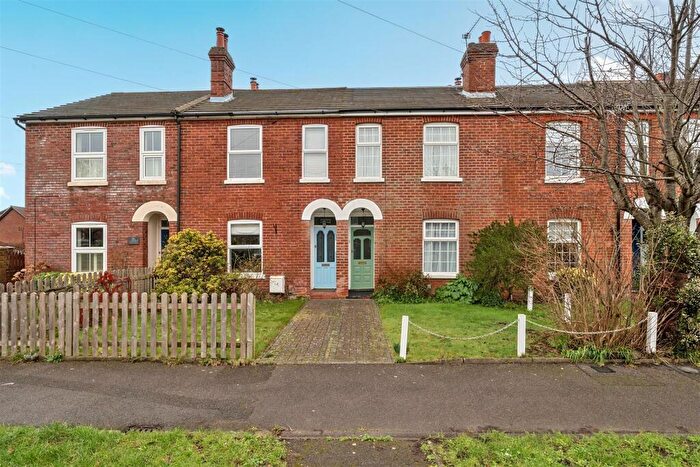
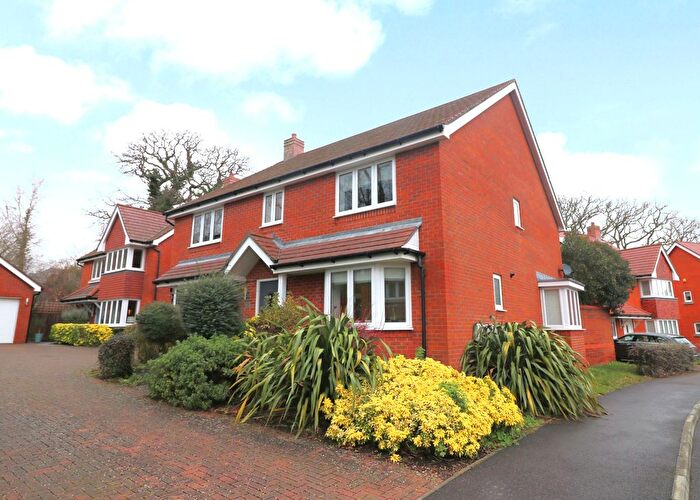
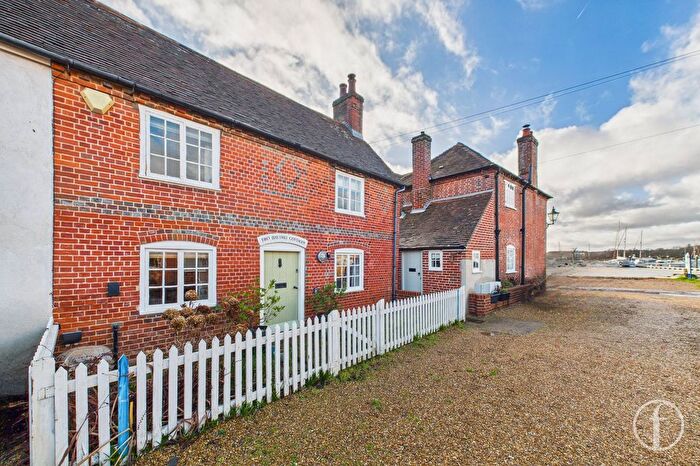
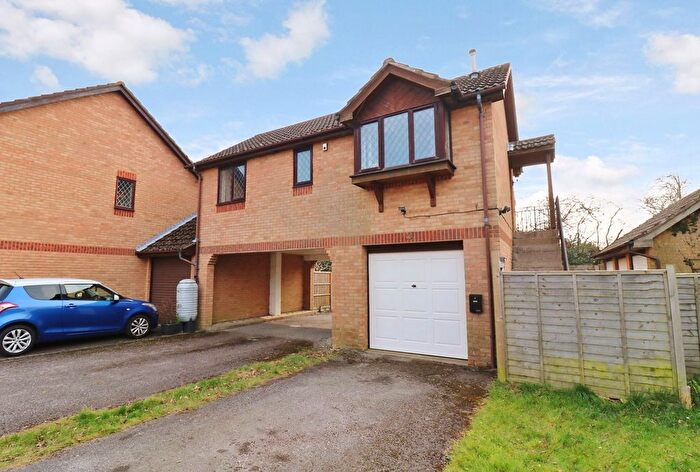
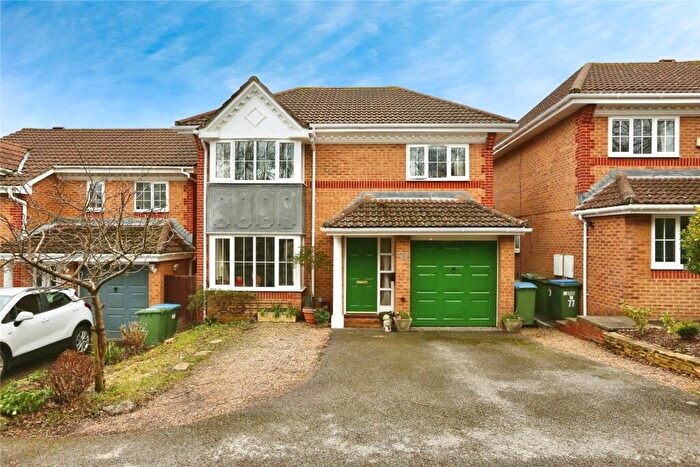
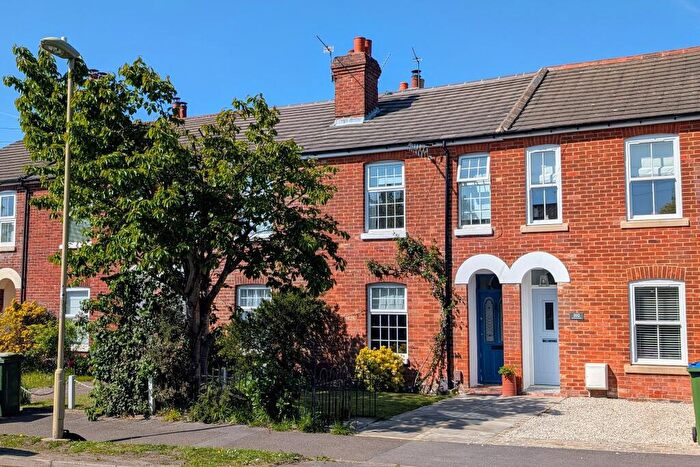
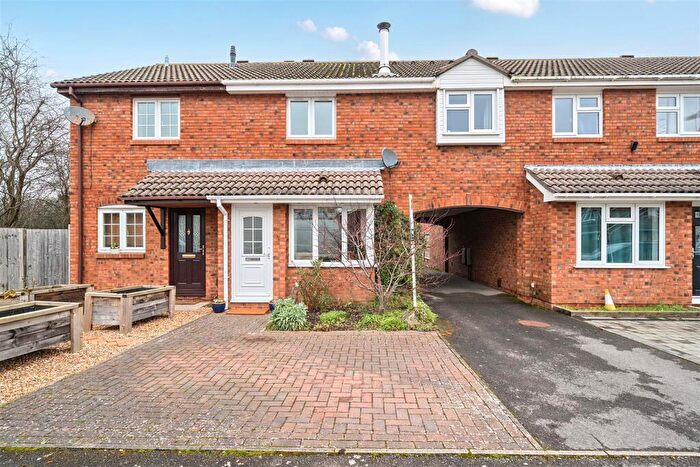
Houses for sale & to rent in Sarisbury, Southampton
House Prices in Sarisbury
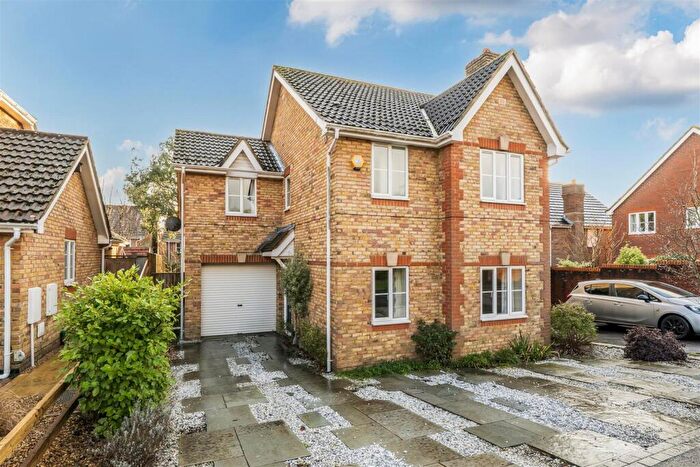
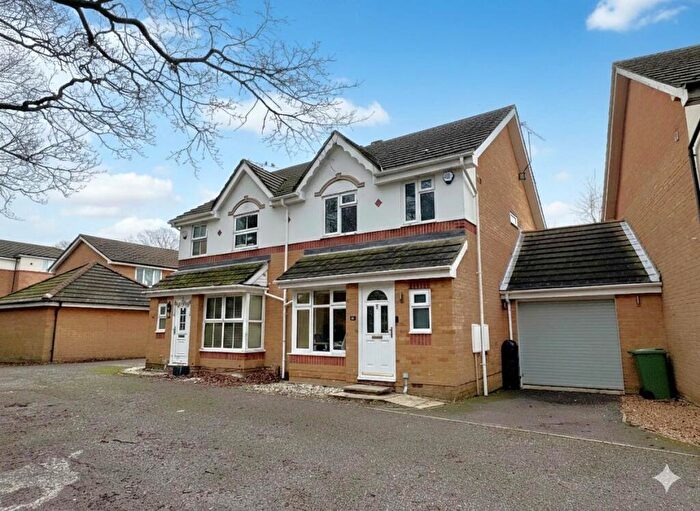
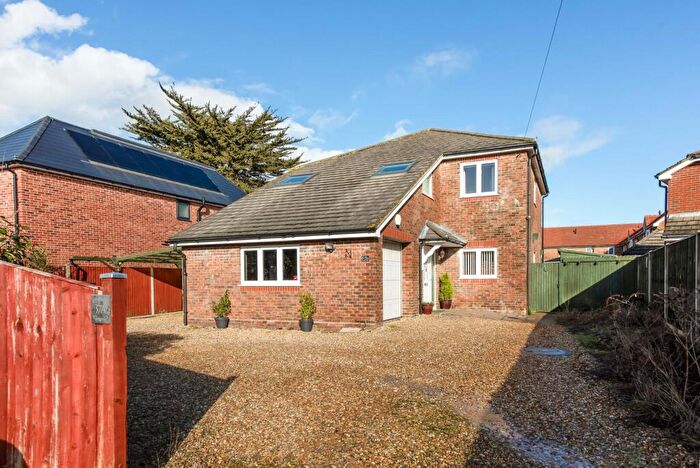
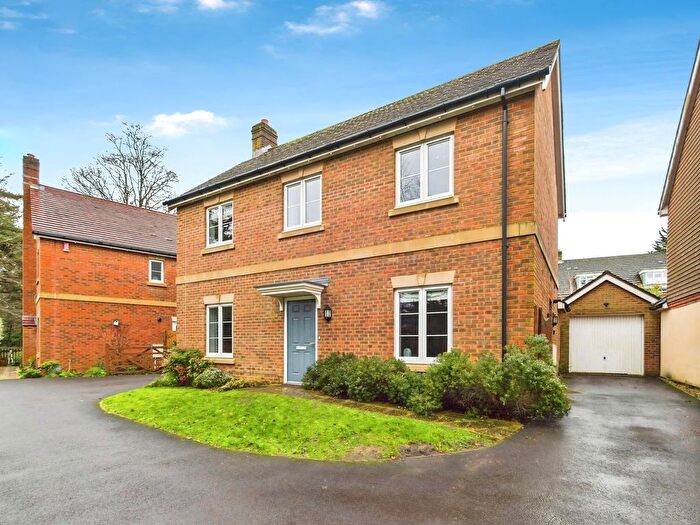
Properties in Sarisbury have an average house price of £548,167.00 and had 128 Property Transactions within the last 3 years¹.
Sarisbury is an area in Southampton, Hampshire with 1,342 households², where the most expensive property was sold for £1,800,000.00.
Properties for sale in Sarisbury
Roads and Postcodes in Sarisbury
Navigate through our locations to find the location of your next house in Sarisbury, Southampton for sale or to rent.
| Streets | Postcodes |
|---|---|
| Allotment Road | SO31 7AP |
| Anglers Way | SO31 7JH |
| Ashley Close | SO31 1FW |
| Barnes Lane | SO31 7BG SO31 7BH SO31 7BA |
| Bentham Way | SO31 7DG |
| Botley Road | SO31 1BJ SO31 1BL SO31 1BP SO31 1BQ SO31 1BS SO31 1BU SO31 1BW SO31 1ZJ |
| Bramble Lane | SO31 7BE |
| Bridge Road | SO31 7EB SO31 7ED SO31 7EE SO31 7EH SO31 7EJ SO31 7EL SO31 7EN SO31 7FL SO31 7FN SO31 1FA |
| Burridge Road | SO31 1BT SO31 1BY |
| Bye Road | SO31 7GX |
| Caigers Green | SO31 1EE |
| Calabrese | SO31 1BG |
| Chapel Road | SO31 7FB |
| Coldeast Close | SO31 7AN |
| Compass Way | SO31 7PR SO31 7PS |
| Crableck Lane | SO31 7AJ SO31 7AL SO31 7LL SO31 7LU |
| Crosstrees | SO31 7LH |
| Danube Drive | SO31 1ER |
| Embsay Road | SO31 7DH |
| Fairlawns | SO31 1EG |
| Glen Road | SO31 7FD SO31 7FE SO31 7FF SO31 7HD |
| Green Lane | SO31 1BN SO31 7DF |
| Halyard Close | SO31 7PA |
| Hawthorn Lane | SO31 7BD |
| Hillside Mews | SO31 7LQ |
| Holly Hill Lane | SO31 6AG SO31 7AB SO31 7AD SO31 7AE SO31 7AF SO31 7AH |
| Lawson Close | SO31 7DJ |
| Lower Swanwick Road | SO31 7HG SO31 7HH |
| Magnolia View | SO31 7PW |
| Mistletoe Gardens | SO31 7HZ |
| Mulberry Lane | SO31 7LJ |
| New Inn Court | SO31 7LF |
| New Road | SO31 7HE |
| Old Swanwick Lane | SO31 7GS |
| Oslands Lane | SO31 7EG |
| Pond Road | SO31 7FJ |
| Quay Haven | SO31 7DE |
| Querida Close | SO31 7JP |
| Regents Gate | SO31 7LB |
| Riverview Terrace | SO31 7GW |
| Rookery Grange | SO31 1DR |
| Rose Bank Close | SO31 7NZ |
| Silvertrees | SO31 7NB |
| Sopwith Way | SO31 7AY |
| Spring Road | SO31 7FG SO31 7FH SO31 7FT |
| St Pauls Road | SO31 7BB |
| Swan Close | SO31 7LA |
| Swanwick Business Centre | SO31 7GB |
| Swanwick Lane | SO31 7DX SO31 7GT SO31 7GY SO31 7GZ SO31 7HA SO31 7HB SO31 7HF |
| Swanwick Shore | SO31 1ZH SO31 1ZL |
| Swanwick Shore Road | SO31 7EF SO31 7HP |
| The Green | SO31 7AA SO31 7AS |
| Toll Gate Road | SO31 7GU |
| Universal Shipyard | SO31 7ZN |
| Walpole Lane | SO31 7AX |
| Wayside | SO31 7JS |
| Whiteley Lane | SO31 1BR |
| Woodlands Close | SO31 7AQ |
| Yew Tree Court | SO31 1EA |
| SO31 1FB SO31 7PZ |
Transport near Sarisbury
- FAQ
- Price Paid By Year
- Property Type Price
Frequently asked questions about Sarisbury
What is the average price for a property for sale in Sarisbury?
The average price for a property for sale in Sarisbury is £548,167. This amount is 42% higher than the average price in Southampton. There are 3,538 property listings for sale in Sarisbury.
What streets have the most expensive properties for sale in Sarisbury?
The streets with the most expensive properties for sale in Sarisbury are Hawthorn Lane at an average of £1,125,000, Green Lane at an average of £1,025,000 and New Road at an average of £975,000.
What streets have the most affordable properties for sale in Sarisbury?
The streets with the most affordable properties for sale in Sarisbury are Crableck Lane at an average of £287,500, Lower Swanwick Road at an average of £289,583 and New Inn Court at an average of £302,000.
Which train stations are available in or near Sarisbury?
Some of the train stations available in or near Sarisbury are Bursledon, Swanwick and Hamble.
Property Price Paid in Sarisbury by Year
The average sold property price by year was:
| Year | Average Sold Price | Price Change |
Sold Properties
|
|---|---|---|---|
| 2025 | £556,933 | 2% |
38 Properties |
| 2024 | £548,118 | 1% |
50 Properties |
| 2023 | £539,900 | -22% |
40 Properties |
| 2022 | £657,124 | 5% |
58 Properties |
| 2021 | £624,814 | 23% |
97 Properties |
| 2020 | £482,143 | -11% |
60 Properties |
| 2019 | £535,044 | 10% |
45 Properties |
| 2018 | £481,211 | -2% |
69 Properties |
| 2017 | £489,295 | -5% |
64 Properties |
| 2016 | £513,909 | 16% |
61 Properties |
| 2015 | £432,434 | 3% |
65 Properties |
| 2014 | £418,031 | -2% |
58 Properties |
| 2013 | £424,601 | 14% |
54 Properties |
| 2012 | £364,355 | -15% |
61 Properties |
| 2011 | £417,271 | 14% |
44 Properties |
| 2010 | £359,513 | 17% |
34 Properties |
| 2009 | £297,342 | -14% |
67 Properties |
| 2008 | £340,343 | -25% |
48 Properties |
| 2007 | £426,179 | 13% |
91 Properties |
| 2006 | £368,953 | 22% |
119 Properties |
| 2005 | £288,935 | -13% |
77 Properties |
| 2004 | £326,815 | 9% |
68 Properties |
| 2003 | £298,280 | 13% |
50 Properties |
| 2002 | £258,350 | -2% |
86 Properties |
| 2001 | £263,541 | 18% |
66 Properties |
| 2000 | £215,920 | 27% |
56 Properties |
| 1999 | £158,269 | 7% |
77 Properties |
| 1998 | £146,992 | 11% |
61 Properties |
| 1997 | £131,223 | 13% |
108 Properties |
| 1996 | £114,210 | -5% |
70 Properties |
| 1995 | £120,044 | - |
62 Properties |
Property Price per Property Type in Sarisbury
Here you can find historic sold price data in order to help with your property search.
The average Property Paid Price for specific property types in the last three years are:
| Property Type | Average Sold Price | Sold Properties |
|---|---|---|
| Semi Detached House | £373,413.00 | 23 Semi Detached Houses |
| Detached House | £726,760.00 | 69 Detached Houses |
| Terraced House | £338,500.00 | 21 Terraced Houses |
| Flat | £288,127.00 | 15 Flats |

