
Houses for sale & to rent in Totton East, Southampton
House Prices in Totton East
Properties in Totton East have an average house price of £308k and had 279 Property Transactions within the last 3 years¹.
Totton East is an area in Southampton, Hampshire with 2,703 households², where the most expensive property was sold for £925k.
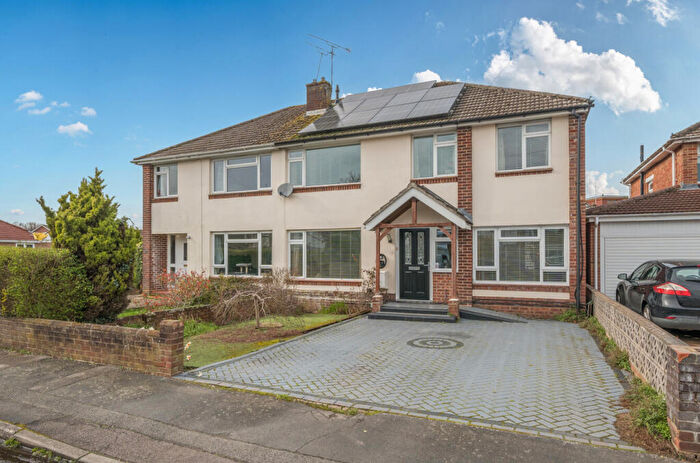
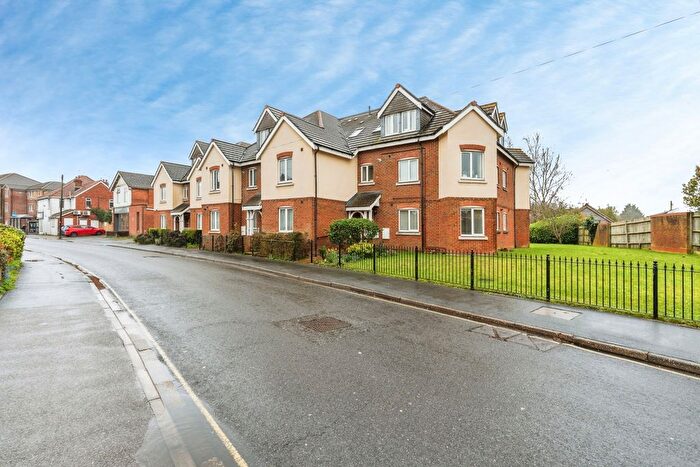
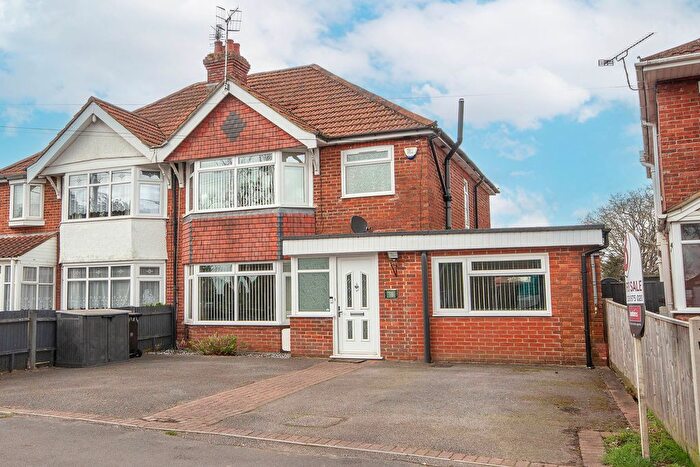
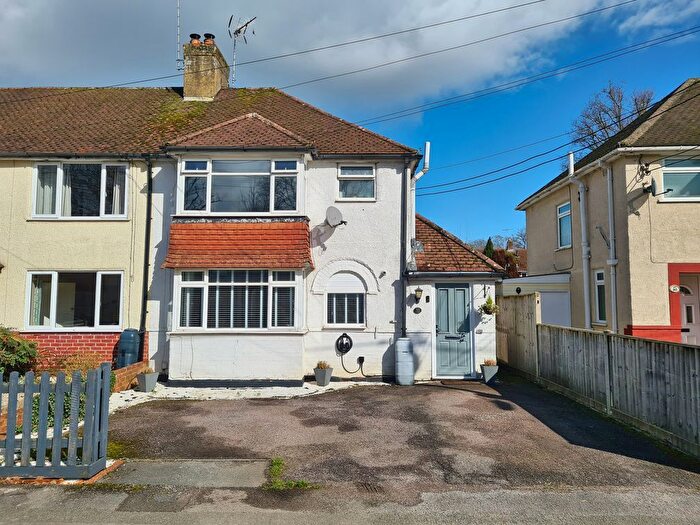
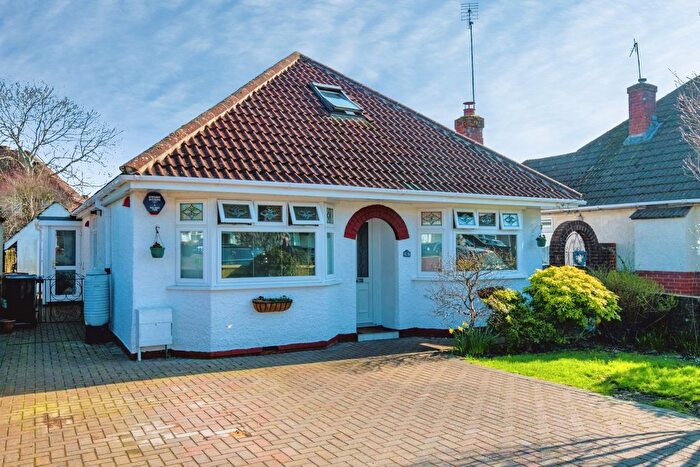
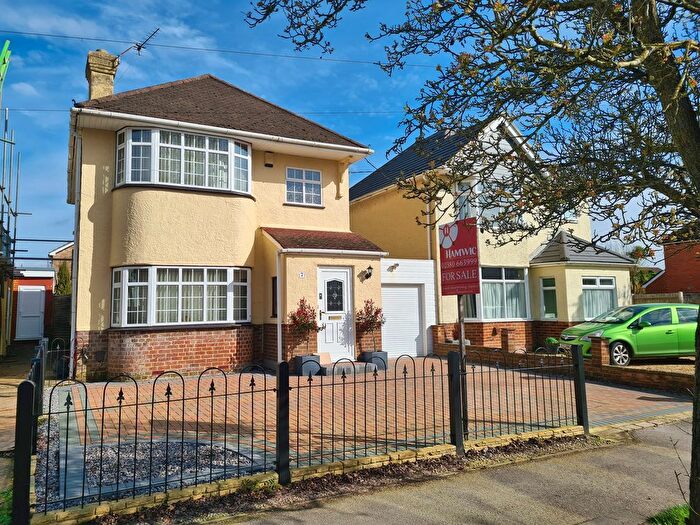
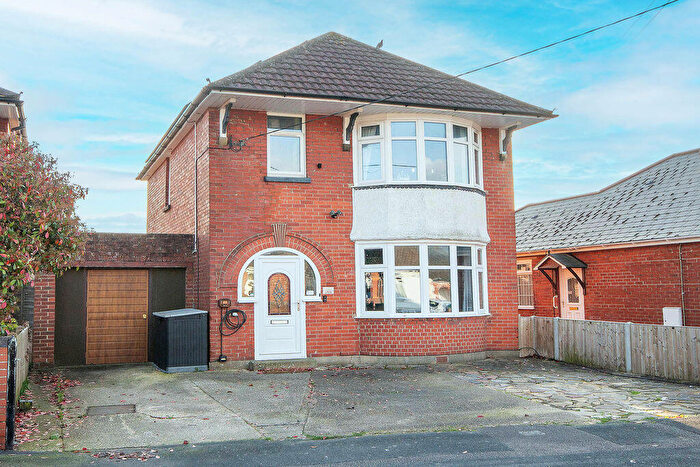
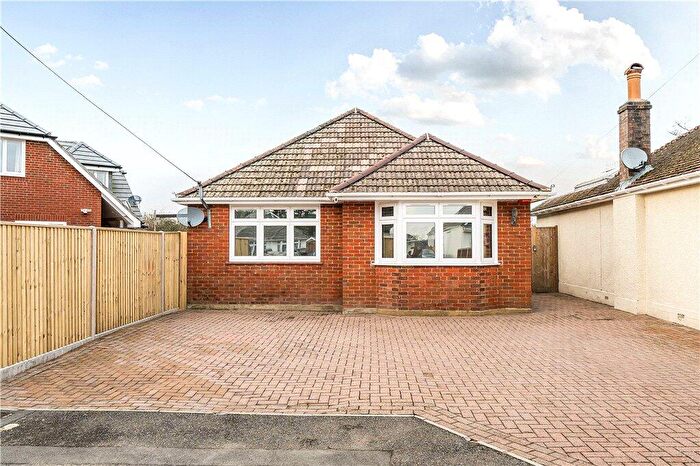
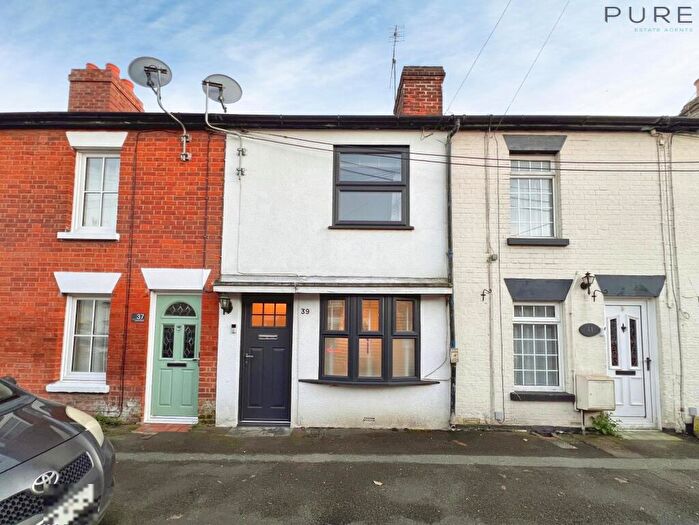
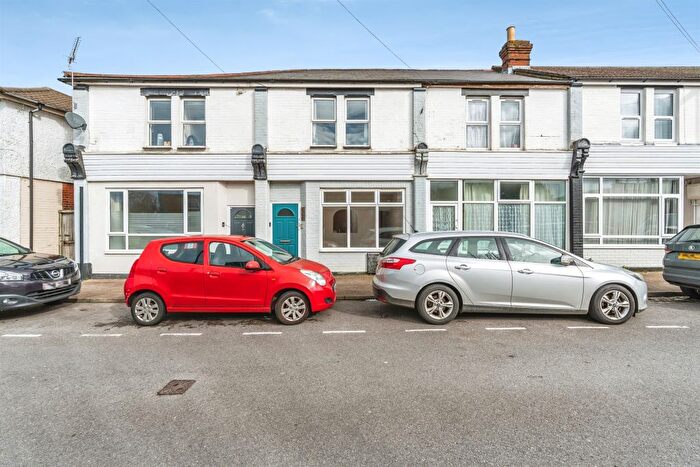
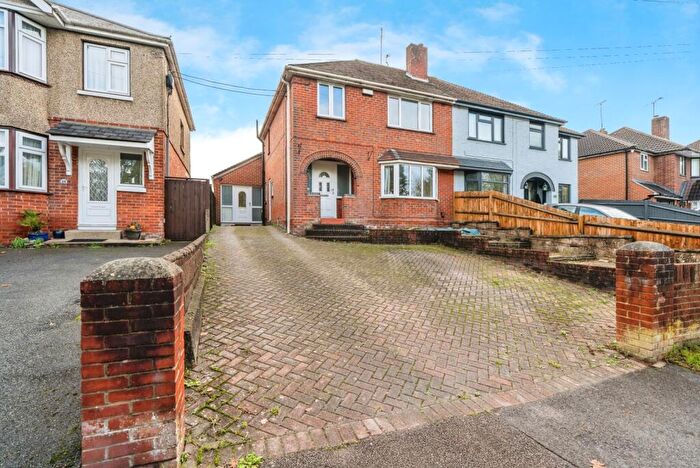
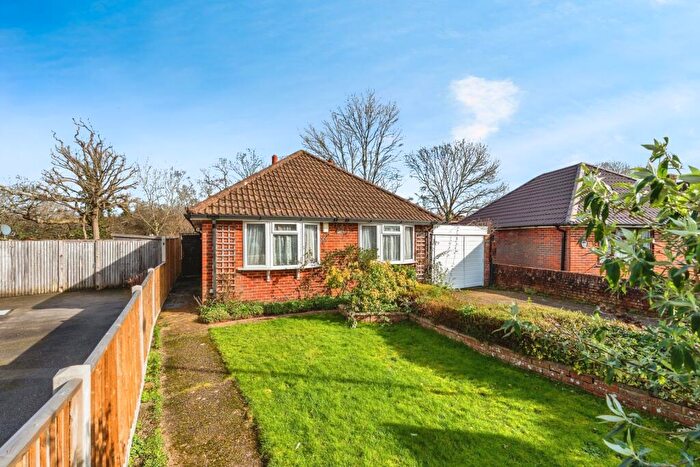
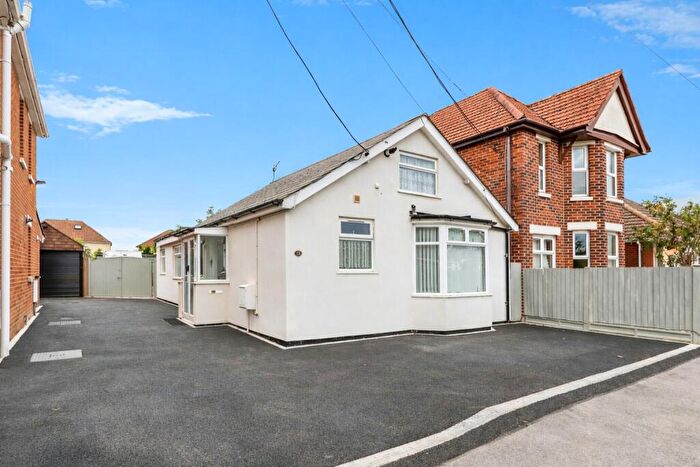
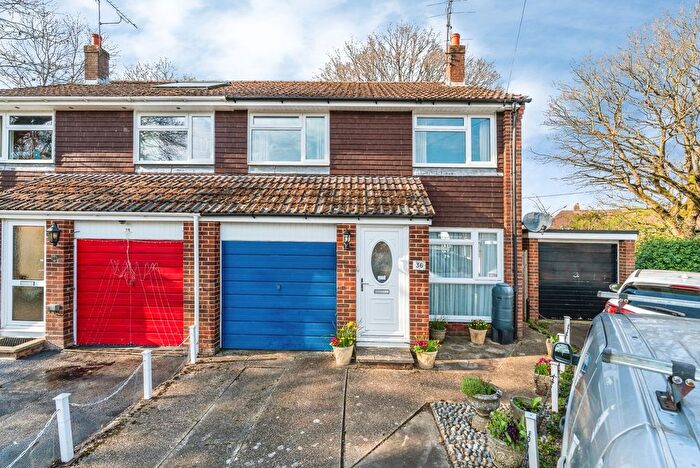
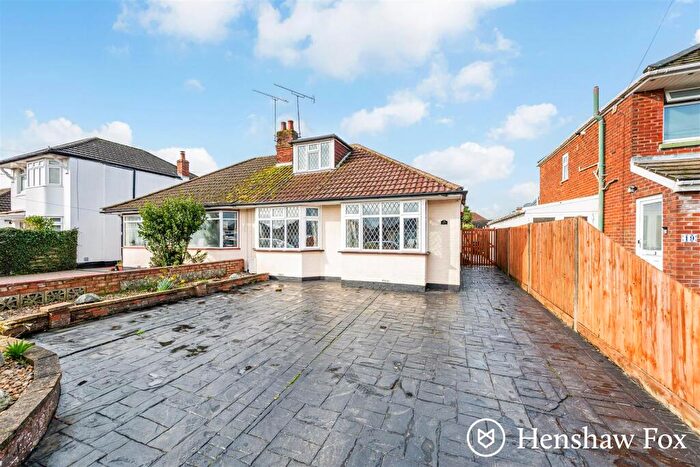
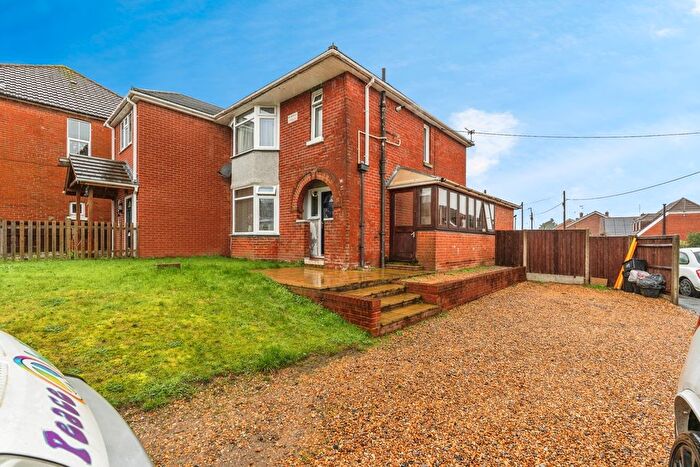
Properties for sale in Totton East
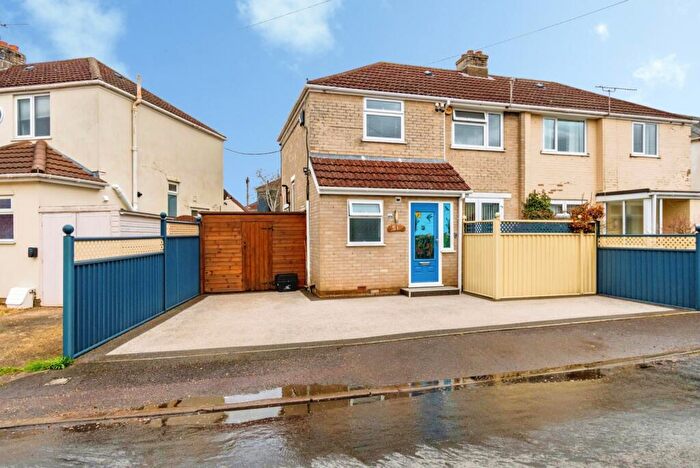
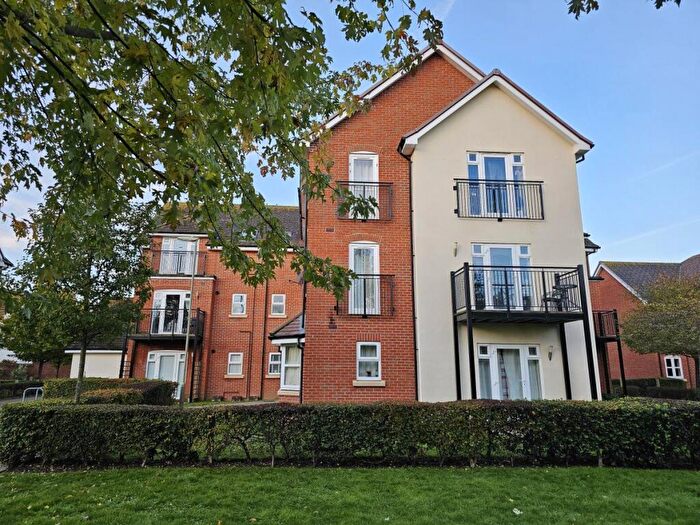
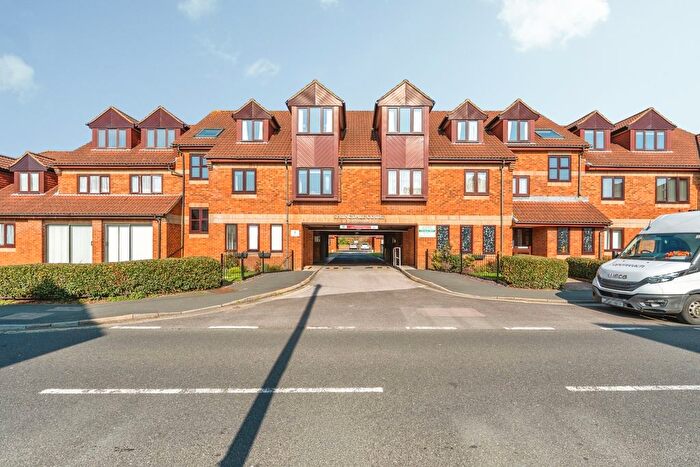
![]()
If you are looking to sell your house, let it out, or receive a property valuation, an expert can help you.
Click the button below to get started.


Roads and Postcodes in Totton East
Navigate through our locations to find the location of your next house in Totton East, Southampton for sale or to rent.
Transport near Totton East

- FAQ
- Price Paid By Year
- Property Type Price
Frequently asked questions about Totton East
What is the average price for a property for sale in Totton East?
The average price for a property for sale in Totton East is £308,109. This amount is 20% lower than the average price in Southampton. There are 1,479 property listings for sale in Totton East.
What streets have the most expensive properties for sale in Totton East?
The streets with the most expensive properties for sale in Totton East are Testwood Avenue at an average of £768,750, Hammonds Way at an average of £450,666 and Greenfields Avenue at an average of £442,562.
What streets have the most affordable properties for sale in Totton East?
The streets with the most affordable properties for sale in Totton East are High Street at an average of £123,400, Old Dairy Close at an average of £176,625 and Treeside Avenue at an average of £187,500.
Which train stations are available in or near Totton East?
Some of the train stations available in or near Totton East are Totton, Redbridge and Ashurst New Forest.
Property Price Paid in Totton East by Year
The average sold property price by year was:
| Year | Average Sold Price | Price Change |
Sold Properties
|
|---|---|---|---|
| 2025 | £334,911 | 8% |
91 Properties |
| 2024 | £306,855 | 9% |
109 Properties |
| 2023 | £278,967 | -16% |
79 Properties |
| 2022 | £324,172 | 15% |
96 Properties |
| 2021 | £275,557 | -1% |
137 Properties |
| 2020 | £277,966 | 5% |
89 Properties |
| 2019 | £264,792 | -2% |
101 Properties |
| 2018 | £269,241 | 4% |
93 Properties |
| 2017 | £258,908 | 2% |
105 Properties |
| 2016 | £253,645 | 13% |
113 Properties |
| 2015 | £219,745 | 1% |
122 Properties |
| 2014 | £216,775 | 4% |
110 Properties |
| 2013 | £208,639 | 8% |
124 Properties |
| 2012 | £192,729 | -2% |
117 Properties |
| 2011 | £197,224 | 5% |
78 Properties |
| 2010 | £186,469 | 1% |
91 Properties |
| 2009 | £184,123 | 0,1% |
77 Properties |
| 2008 | £183,859 | -8% |
81 Properties |
| 2007 | £198,588 | 5% |
139 Properties |
| 2006 | £189,155 | 10% |
156 Properties |
| 2005 | £171,087 | -11% |
132 Properties |
| 2004 | £190,121 | 13% |
169 Properties |
| 2003 | £164,834 | 23% |
121 Properties |
| 2002 | £126,450 | 13% |
139 Properties |
| 2001 | £109,536 | 3% |
130 Properties |
| 2000 | £105,750 | 21% |
122 Properties |
| 1999 | £83,447 | 14% |
150 Properties |
| 1998 | £72,027 | 7% |
96 Properties |
| 1997 | £67,236 | 13% |
118 Properties |
| 1996 | £58,616 | 2% |
107 Properties |
| 1995 | £57,587 | - |
103 Properties |
Property Price per Property Type in Totton East
Here you can find historic sold price data in order to help with your property search.
The average Property Paid Price for specific property types in the last three years are:
| Property Type | Average Sold Price | Sold Properties |
|---|---|---|
| Flat | £165,802.00 | 46 Flats |
| Semi Detached House | £320,362.00 | 93 Semi Detached Houses |
| Detached House | £411,905.00 | 85 Detached Houses |
| Terraced House | £246,000.00 | 55 Terraced Houses |