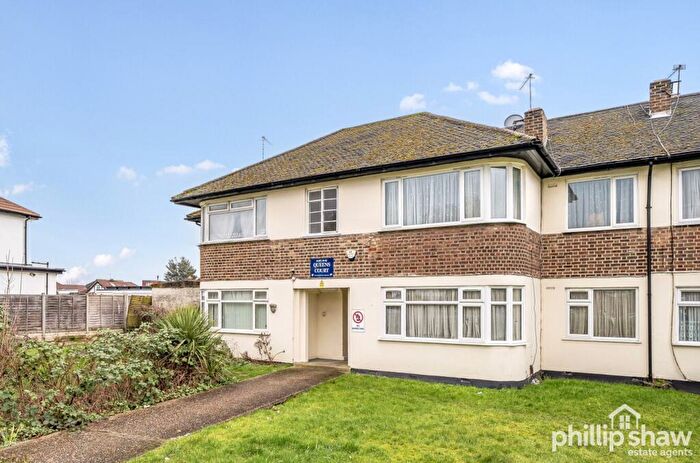
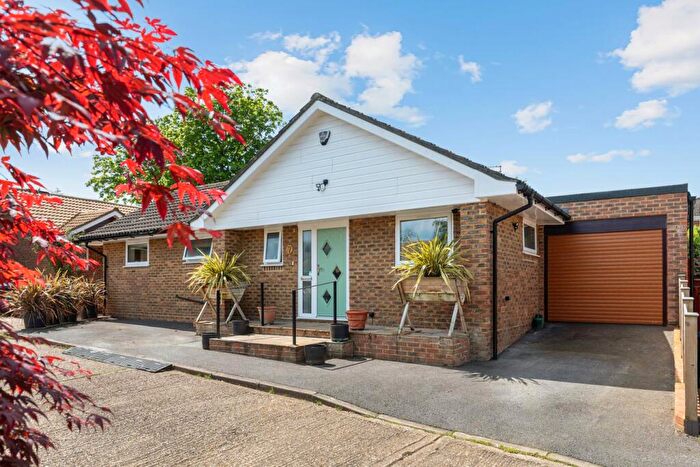
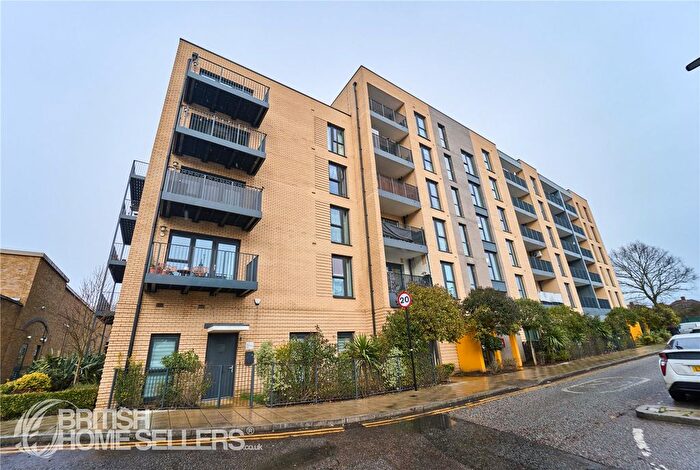
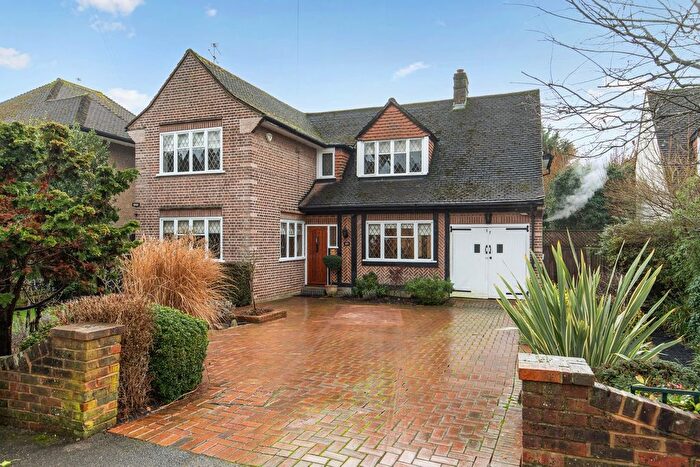
Houses for sale & to rent in Stanmore, Harrow London Borough
House Prices in Stanmore
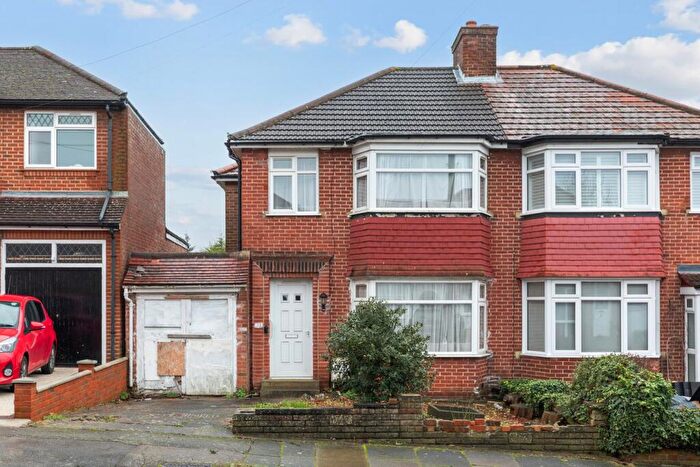
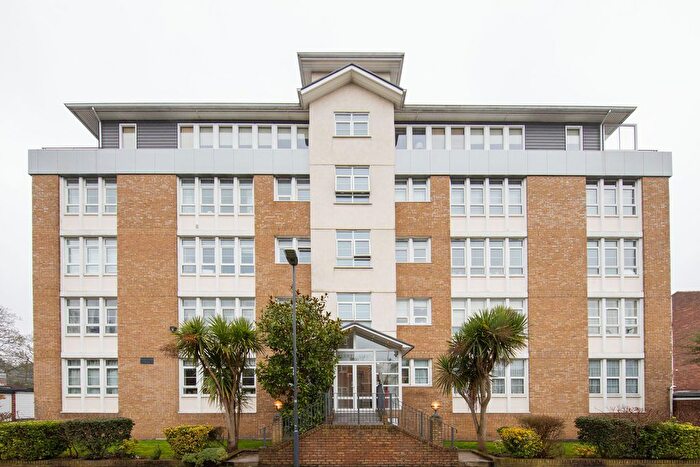
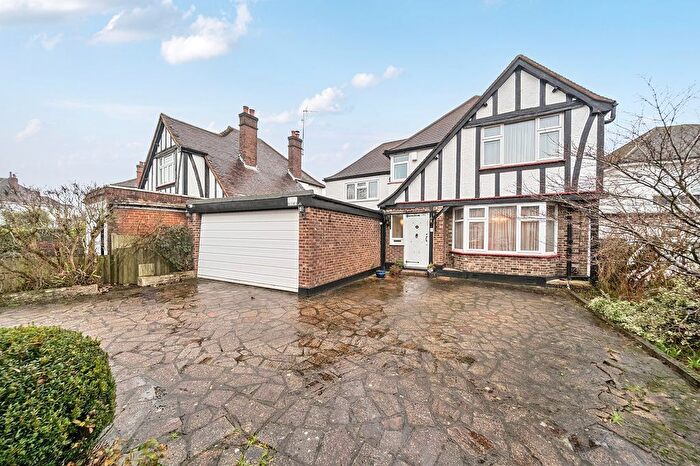
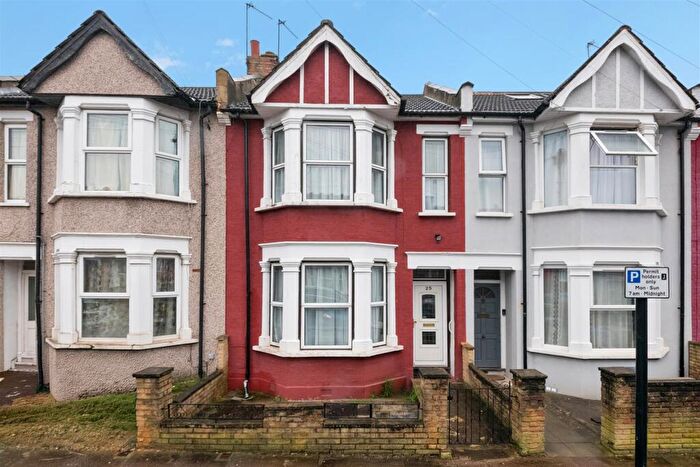
Properties in this part of Stanmore within the Harrow London Borough have an average house price of £661,417.00 and had 871 Property Transactions within the last 3 years.¹ This area has 12,689 households² , where the most expensive property was sold for £4,500,000.00.
Properties for sale in Stanmore
Neighbourhoods in Stanmore
Navigate through our locations to find the location of your next house in Stanmore, Harrow London Borough for sale or to rent.
Transport in Stanmore
Please see below transportation links in this area:
-
Stanmore Station
-
Canons Park Station
-
Edgware Station
-
Queensbury Station
-
Harrow and Wealdstone Station
-
Kenton Station
-
Headstone Lane Station
-
Burnt Oak Station
-
Northwick Park Station
-
Kingsbury Station
- FAQ
- Price Paid By Year
- Property Type Price
Frequently asked questions about Stanmore
What is the average price for a property for sale in Stanmore?
The average price for a property for sale in Stanmore is £661,417. This amount is 17% higher than the average price in Harrow London Borough. There are more than 10,000 property listings for sale in Stanmore.
What locations have the most expensive properties for sale in Stanmore?
The locations with the most expensive properties for sale in Stanmore are Harrow Weald at an average of £895,000, Stanmore Park at an average of £753,568 and Belmont at an average of £644,756.
What locations have the most affordable properties for sale in Stanmore?
The locations with the most affordable properties for sale in Stanmore are Kenton East at an average of £325,000, Queensbury at an average of £484,072 and Canons at an average of £623,561.
Which train stations are available in or near Stanmore?
Some of the train stations available in or near Stanmore are Harrow and Wealdstone, Kenton and Headstone Lane.
Which tube stations are available in or near Stanmore?
Some of the tube stations available in or near Stanmore are Stanmore, Canons Park and Edgware.
Property Price Paid in Stanmore by Year
The average sold property price by year was:
| Year | Average Sold Price | Price Change |
Sold Properties
|
|---|---|---|---|
| 2025 | £627,898 | -5% |
265 Properties |
| 2024 | £660,786 | -5% |
338 Properties |
| 2023 | £695,357 | 2% |
268 Properties |
| 2022 | £679,929 | 1% |
380 Properties |
| 2021 | £676,311 | 12% |
481 Properties |
| 2020 | £597,644 | 2% |
314 Properties |
| 2019 | £583,095 | -3% |
373 Properties |
| 2018 | £598,748 | -4% |
354 Properties |
| 2017 | £625,555 | 3% |
402 Properties |
| 2016 | £605,890 | -3% |
446 Properties |
| 2015 | £625,698 | 7% |
559 Properties |
| 2014 | £584,220 | 18% |
480 Properties |
| 2013 | £477,014 | 8% |
485 Properties |
| 2012 | £438,600 | 6% |
362 Properties |
| 2011 | £413,077 | 6% |
367 Properties |
| 2010 | £389,126 | 4% |
404 Properties |
| 2009 | £372,629 | -10% |
262 Properties |
| 2008 | £408,523 | -4% |
310 Properties |
| 2007 | £423,060 | 10% |
610 Properties |
| 2006 | £379,171 | 5% |
691 Properties |
| 2005 | £359,229 | -0,2% |
555 Properties |
| 2004 | £360,005 | 9% |
626 Properties |
| 2003 | £326,752 | 13% |
647 Properties |
| 2002 | £285,175 | 21% |
722 Properties |
| 2001 | £225,845 | 8% |
598 Properties |
| 2000 | £207,315 | 7% |
567 Properties |
| 1999 | £191,974 | 12% |
612 Properties |
| 1998 | £169,572 | 10% |
545 Properties |
| 1997 | £152,488 | 25% |
509 Properties |
| 1996 | £113,920 | 5% |
494 Properties |
| 1995 | £108,639 | - |
384 Properties |
Property Price per Property Type in Stanmore
Here you can find historic sold price data in order to help with your property search.
The average Property Paid Price for specific property types in the last three years are:
| Property Type | Average Sold Price | Sold Properties |
|---|---|---|
| Semi Detached House | £661,867.00 | 297 Semi Detached Houses |
| Detached House | £1,265,122.00 | 139 Detached Houses |
| Terraced House | £628,071.00 | 88 Terraced Houses |
| Flat | £427,658.00 | 347 Flats |

