
Houses for sale & to rent in Kenton East, Stanmore
House Prices in Kenton East
Properties in this part of Kenton East within Stanmore have an average house price of £325,000.00 and had 1 Property Transaction within the last 3 years¹. This area has 130 households² , where the most expensive property was sold for £325,000.00.
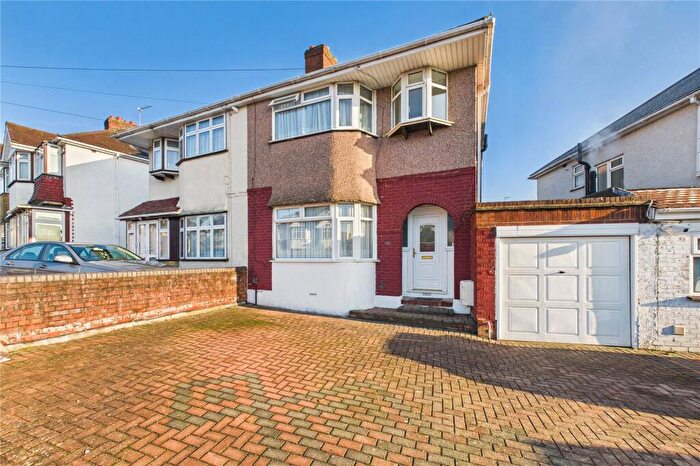
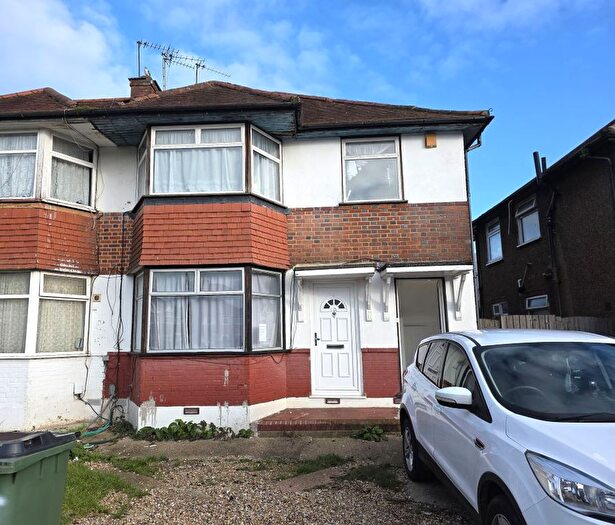
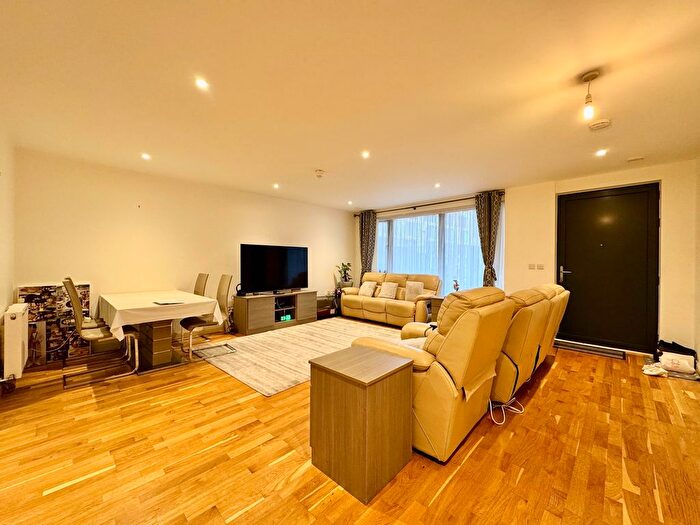
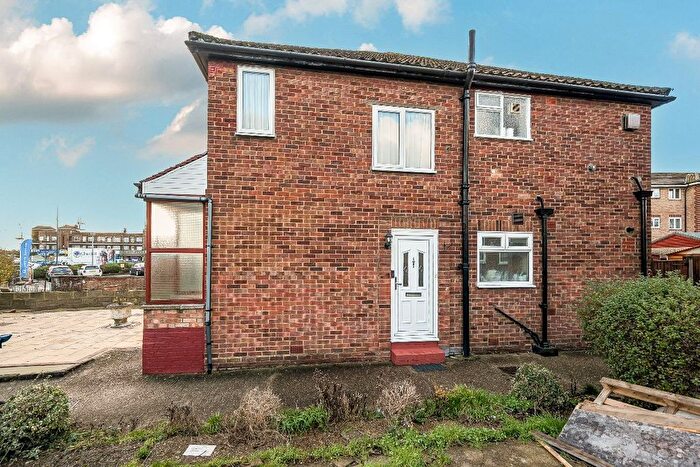
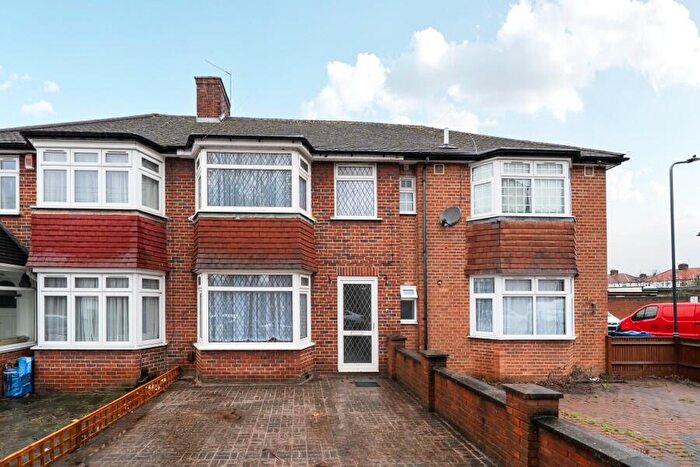
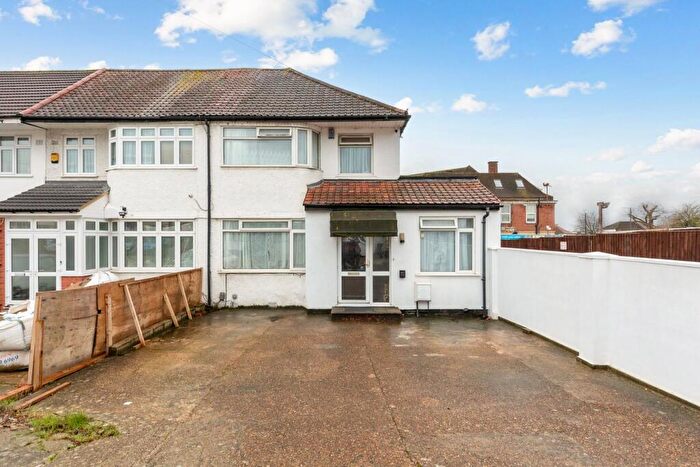
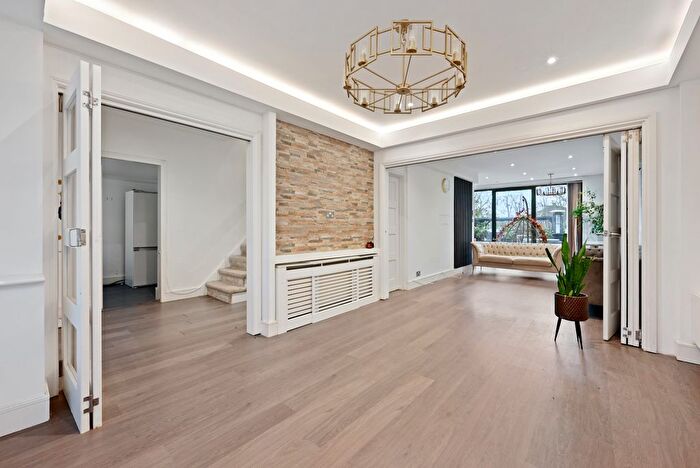
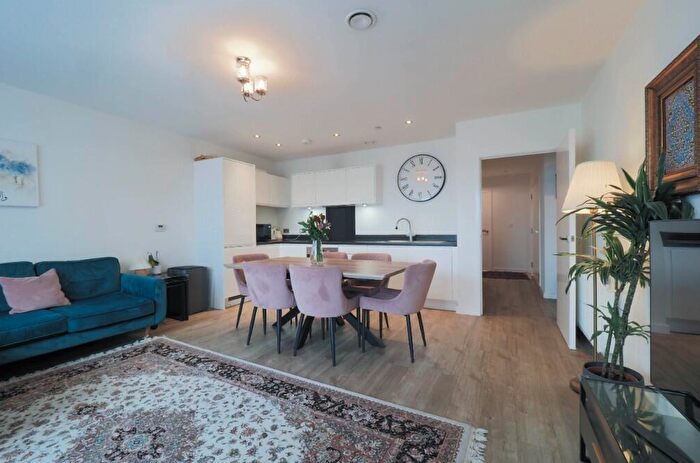
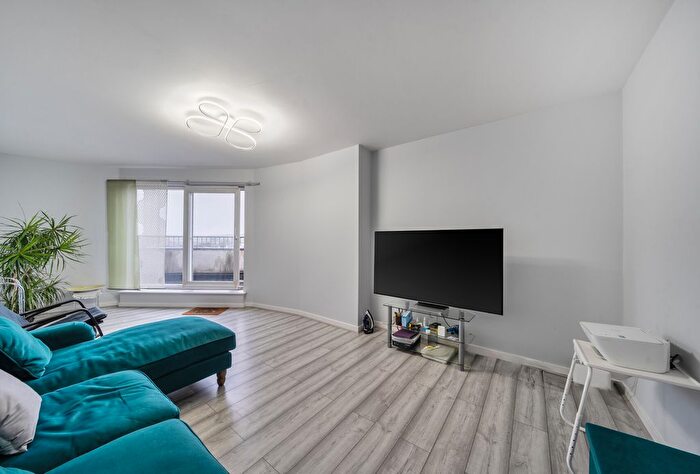
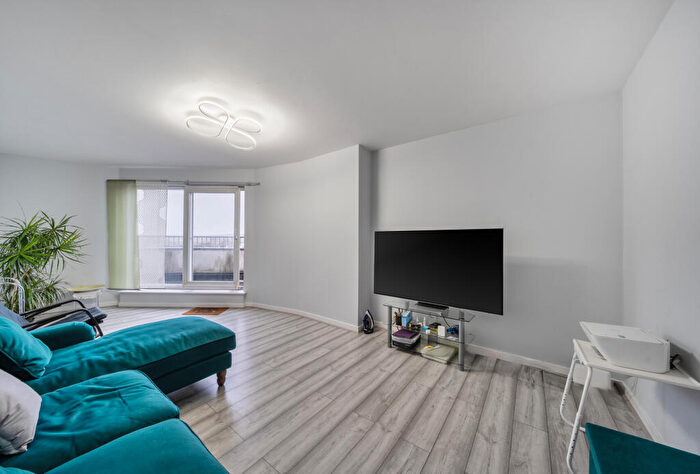
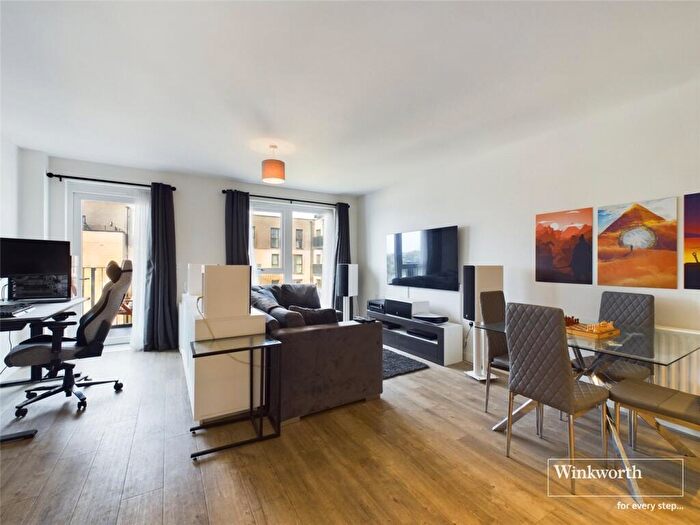
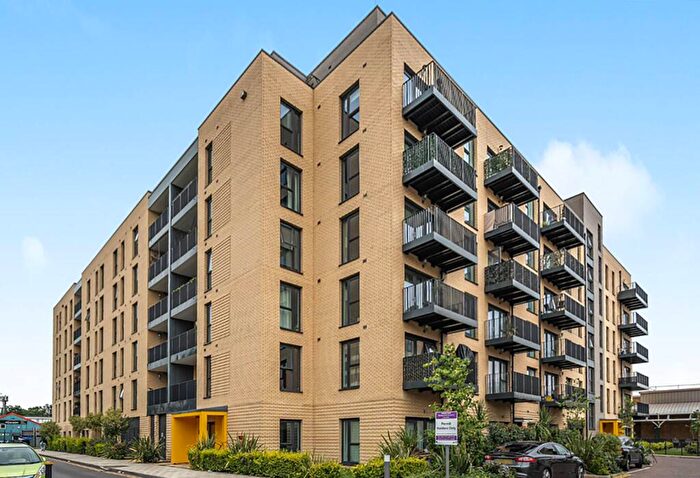
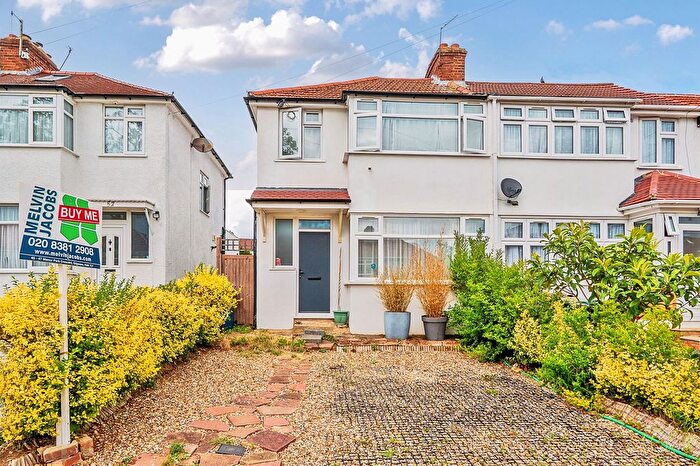
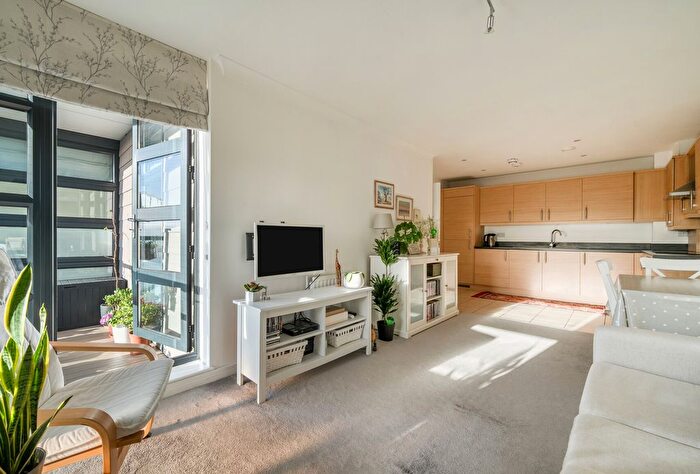
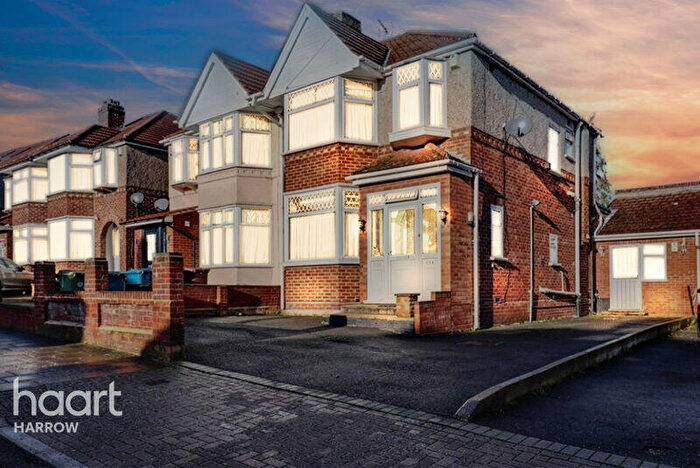
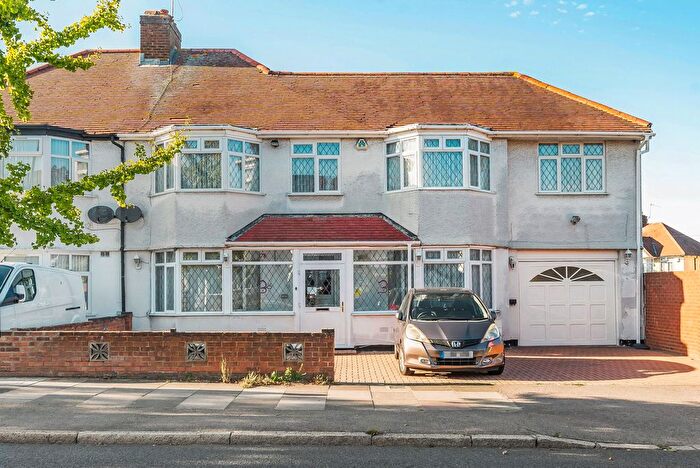
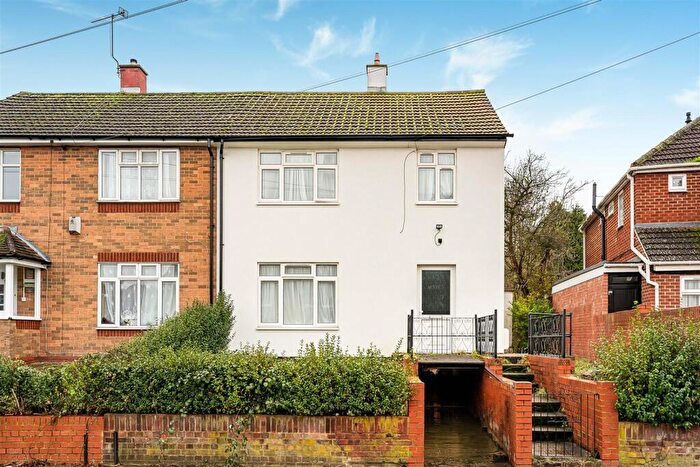
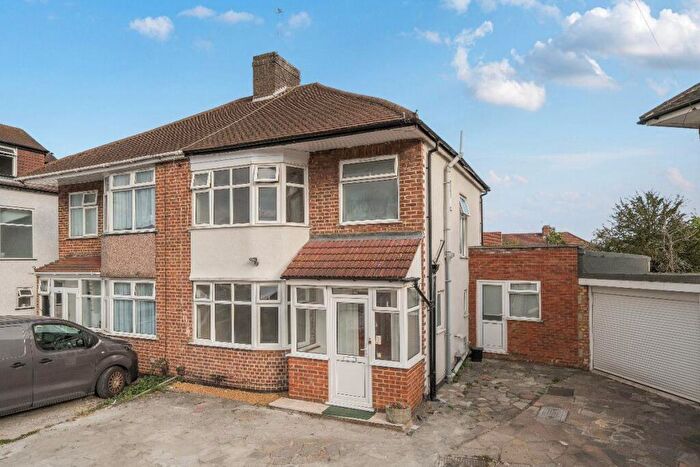
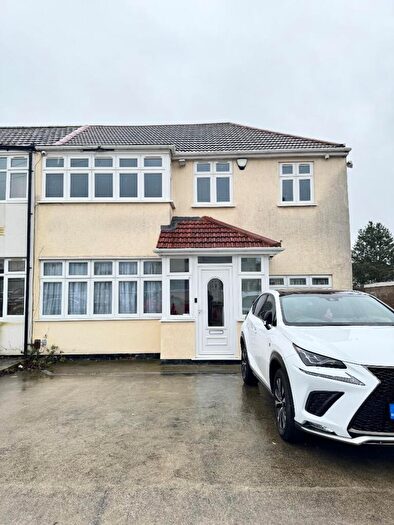
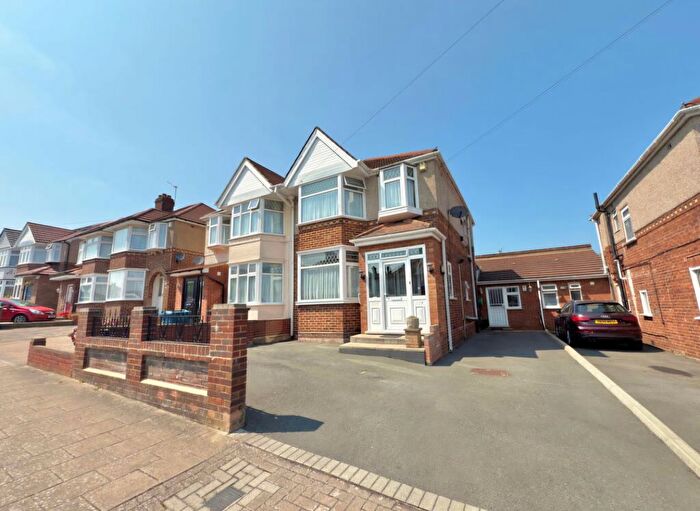
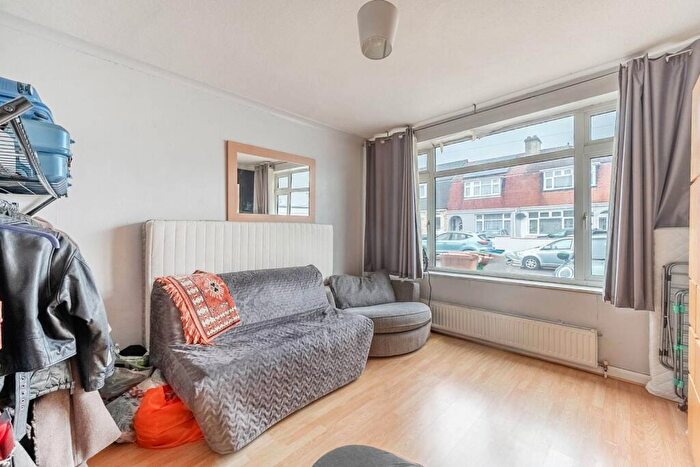
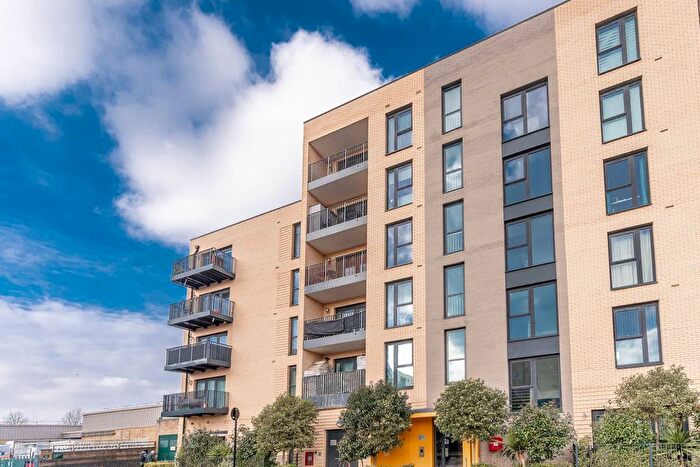
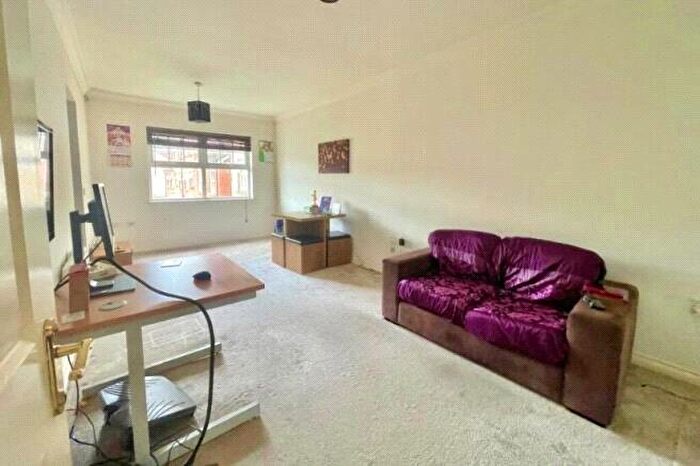
Properties for sale in Kenton East
![]()
If you are looking to sell your house, let it out, or receive a property valuation, an expert can help you.
Click the button below to get started.

Roads and Postcodes in Kenton East
Navigate through our locations to find the location of your next house in Kenton East, Stanmore for sale or to rent.
| Streets | Postcodes |
|---|---|
| Chichester Court | HA7 1EF HA7 1GF HA7 1GG HA7 1GH |
| Honeypot Lane | HA7 1ES HA7 1ET HA7 1HH HA7 1GL |
| Leefe Robinson Mews | HA7 1GE |
| Mary Close | HA7 1HG |
| Ruth Close | HA7 1HQ |
Transport near Kenton East
-
 Queensbury Station
 -
Kingsbury Station
-
Canons Park Station
-
Burnt Oak Station
-

 Kenton Station
 -
Preston Road Station
-
Northwick Park Station
-
Edgware Station
-
Colindale Station
-
South Kenton Station
- FAQ
- Price Paid By Year
- Property Type Price
Frequently asked questions about Kenton East
What is the average price for a property for sale in Kenton East?
The average price for a property for sale in Kenton East is £325,000. This amount is 51% lower than the average price in Stanmore. There are 1,482 property listings for sale in Kenton East.
Which train stations are available in or near Kenton East?
Some of the train stations available in or near Kenton East are Kenton and South Kenton.
Which tube stations are available in or near Kenton East?
Some of the tube stations available in or near Kenton East are Queensbury, Kingsbury and Canons Park.
Property Price Paid in Kenton East by Year
The average sold property price by year was:
| Year | Average Sold Price | Price Change |
Sold Properties
|
|---|---|---|---|
| 2025 | £325,000 | 38% |
1 Property |
| 2019 | £200,000 | -68% |
2 Properties |
| 2018 | £336,250 | -1% |
2 Properties |
| 2017 | £339,000 | 12% |
1 Property |
| 2015 | £300,000 | 30% |
1 Property |
| 2013 | £210,000 | 2% |
1 Property |
| 2011 | £205,000 | 5% |
1 Property |
| 2010 | £195,000 | 24% |
1 Property |
| 2008 | £148,000 | -27% |
1 Property |
| 2007 | £188,000 | 3% |
1 Property |
| 2005 | £182,000 | 9% |
1 Property |
| 2004 | £165,125 | 9% |
4 Properties |
| 2003 | £150,000 | 19% |
2 Properties |
| 2002 | £121,500 | -0,4% |
2 Properties |
| 2001 | £122,000 | 39% |
1 Property |
| 1999 | £74,950 | 1% |
1 Property |
| 1998 | £74,400 | 46% |
2 Properties |
| 1997 | £40,000 | -28% |
1 Property |
| 1996 | £51,000 | - |
2 Properties |
Property Price per Property Type in Kenton East
Here you can find historic sold price data in order to help with your property search.
The average Property Paid Price for specific property types in the last three years are:
| Property Type | Average Sold Price | Sold Properties |
|---|---|---|
| Flat | £325,000.00 | 1 Flat |