
Houses for sale & to rent in Queensbury, Stanmore
House Prices in Queensbury
Properties in this part of Queensbury within Stanmore have an average house price of £484k and had 104 Property Transactions within the last 3 years¹. This area has 2,219 households² , where the most expensive property was sold for £1.8M.
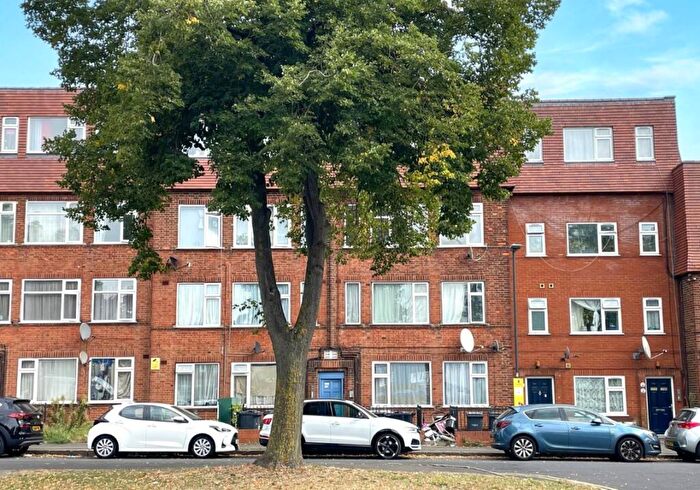
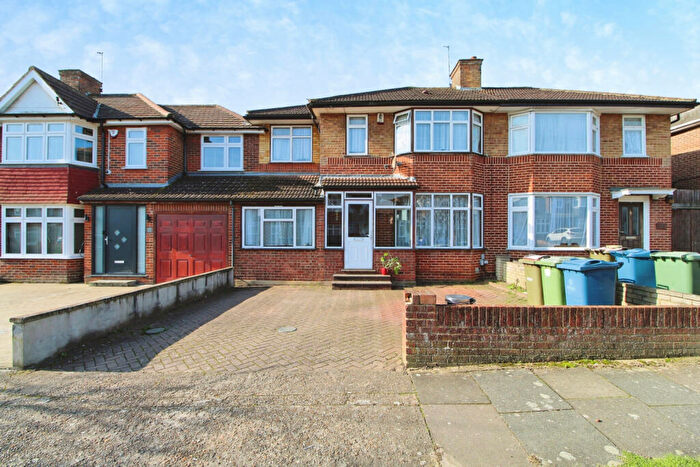
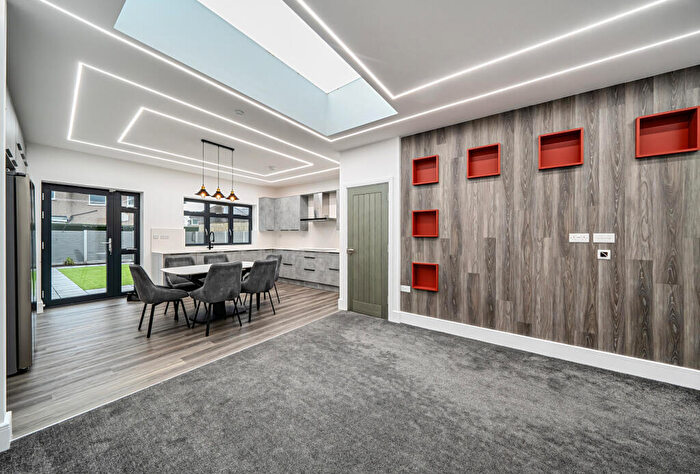
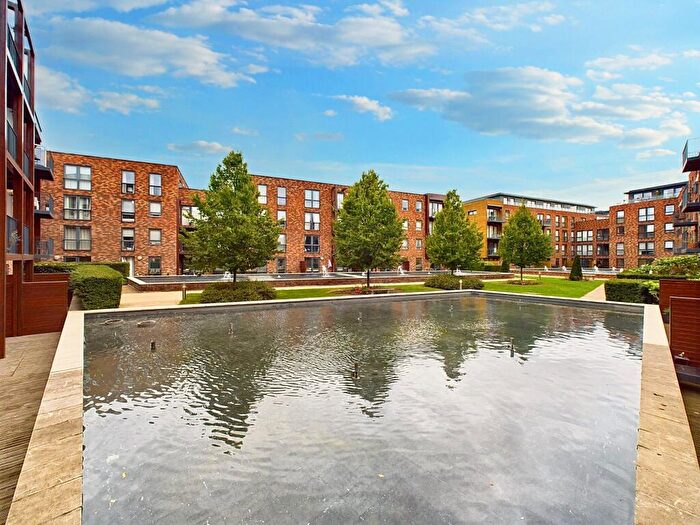
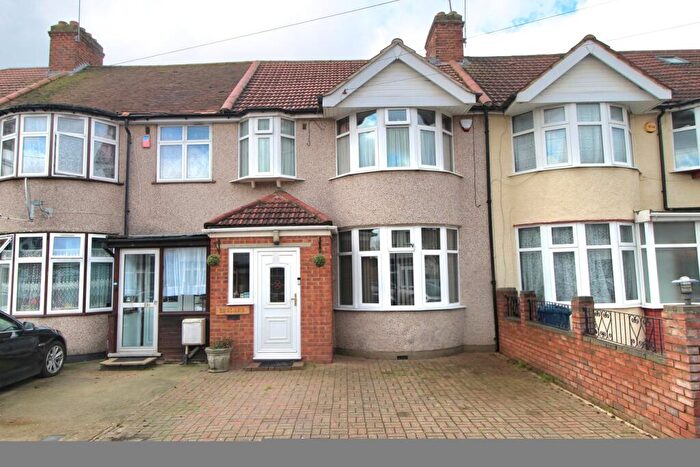
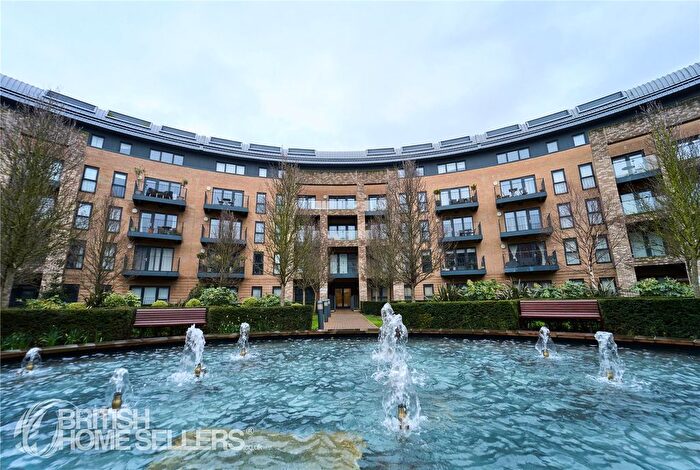
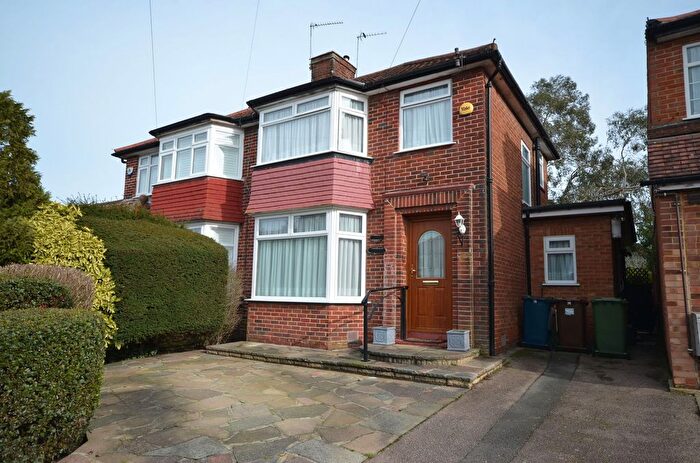
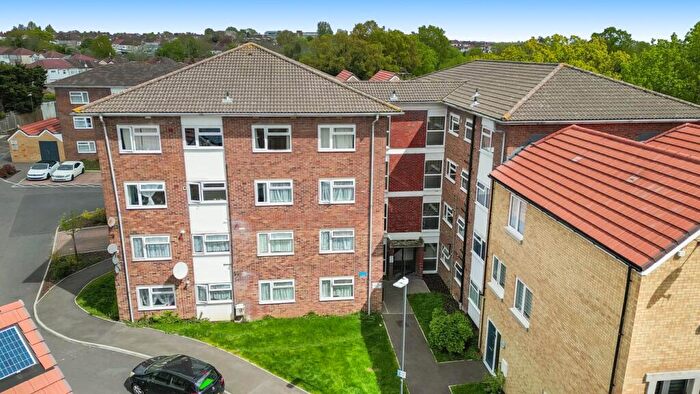
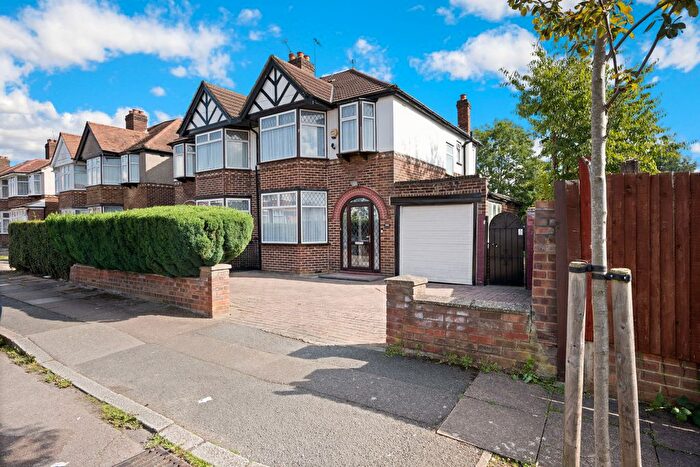
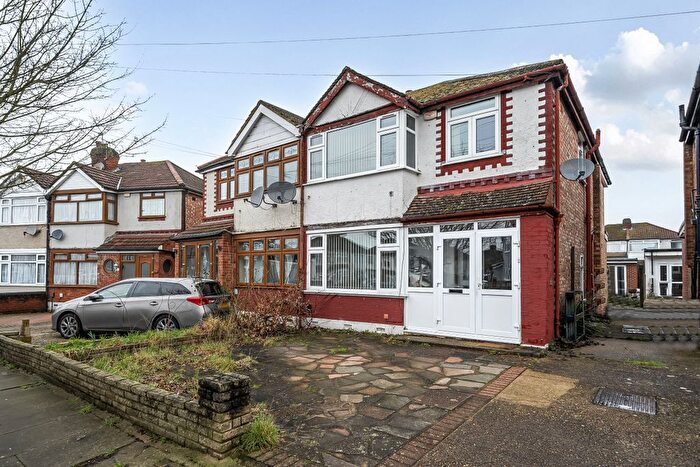
Properties for sale in Queensbury

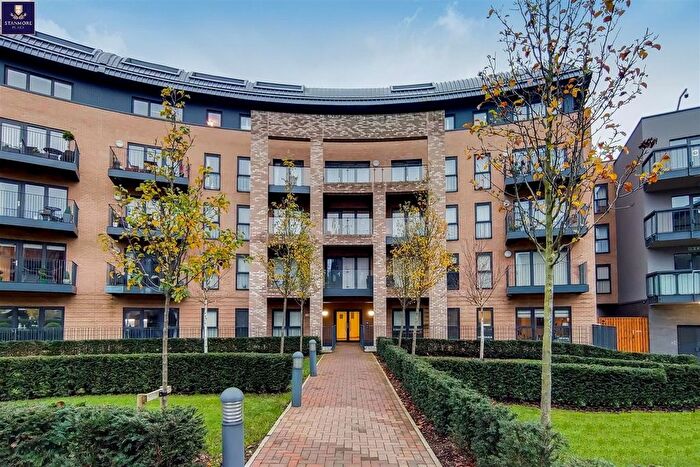
![]()
If you are looking to sell your house, let it out, or receive a property valuation, an expert can help you.
Click the button below to get started.


Roads and Postcodes in Queensbury
Navigate through our locations to find the location of your next house in Queensbury, Stanmore for sale or to rent.
Transport near Queensbury
-
 Queensbury Station
 -
Canons Park Station
-
Kingsbury Station
-

 Kenton Station
 -
Burnt Oak Station
-
Northwick Park Station
-
Stanmore Station
-
Harrow and Wealdstone Station
-
Edgware Station
-
Preston Road Station
- FAQ
- Price Paid By Year
- Property Type Price
Frequently asked questions about Queensbury
What is the average price for a property for sale in Queensbury?
The average price for a property for sale in Queensbury is £484,072. This amount is 27% lower than the average price in Stanmore. There are 1,529 property listings for sale in Queensbury.
What streets have the most expensive properties for sale in Queensbury?
The streets with the most expensive properties for sale in Queensbury are Dalston Gardens at an average of £921,666, Ennerdale Avenue at an average of £815,000 and Collins Avenue at an average of £710,000.
What streets have the most affordable properties for sale in Queensbury?
The streets with the most affordable properties for sale in Queensbury are Everton Drive at an average of £299,200, Lowther Road at an average of £318,333 and Chichester Court at an average of £325,000.
Which train stations are available in or near Queensbury?
Some of the train stations available in or near Queensbury are Kenton and Harrow and Wealdstone.
Which tube stations are available in or near Queensbury?
Some of the tube stations available in or near Queensbury are Queensbury, Canons Park and Kingsbury.
Property Price Paid in Queensbury by Year
The average sold property price by year was:
| Year | Average Sold Price | Price Change |
Sold Properties
|
|---|---|---|---|
| 2025 | £479,977 | 12% |
33 Properties |
| 2024 | £421,154 | -38% |
42 Properties |
| 2023 | £579,853 | 20% |
29 Properties |
| 2022 | £463,608 | -5% |
50 Properties |
| 2021 | £484,810 | 7% |
55 Properties |
| 2020 | £452,000 | 4% |
40 Properties |
| 2019 | £433,691 | -3% |
34 Properties |
| 2018 | £447,728 | -1% |
59 Properties |
| 2017 | £452,395 | 9% |
43 Properties |
| 2016 | £413,756 | 5% |
39 Properties |
| 2015 | £395,112 | 6% |
61 Properties |
| 2014 | £372,578 | 13% |
56 Properties |
| 2013 | £325,736 | 5% |
62 Properties |
| 2012 | £308,692 | 6% |
38 Properties |
| 2011 | £290,345 | 12% |
49 Properties |
| 2010 | £256,322 | -5% |
69 Properties |
| 2009 | £268,700 | -6% |
35 Properties |
| 2008 | £285,365 | 12% |
43 Properties |
| 2007 | £250,944 | 6% |
86 Properties |
| 2006 | £235,790 | 4% |
104 Properties |
| 2005 | £227,351 | 1% |
103 Properties |
| 2004 | £225,336 | 10% |
124 Properties |
| 2003 | £202,341 | 14% |
99 Properties |
| 2002 | £174,732 | 9% |
124 Properties |
| 2001 | £159,527 | 13% |
121 Properties |
| 2000 | £139,180 | 19% |
107 Properties |
| 1999 | £113,410 | 9% |
123 Properties |
| 1998 | £103,448 | 19% |
92 Properties |
| 1997 | £83,977 | 16% |
100 Properties |
| 1996 | £70,948 | -2% |
99 Properties |
| 1995 | £72,450 | - |
85 Properties |
Property Price per Property Type in Queensbury
Here you can find historic sold price data in order to help with your property search.
The average Property Paid Price for specific property types in the last three years are:
| Property Type | Average Sold Price | Sold Properties |
|---|---|---|
| Semi Detached House | £587,755.00 | 49 Semi Detached Houses |
| Detached House | £946,875.00 | 4 Detached Houses |
| Terraced House | £552,000.00 | 11 Terraced Houses |
| Flat | £292,100.00 | 40 Flats |