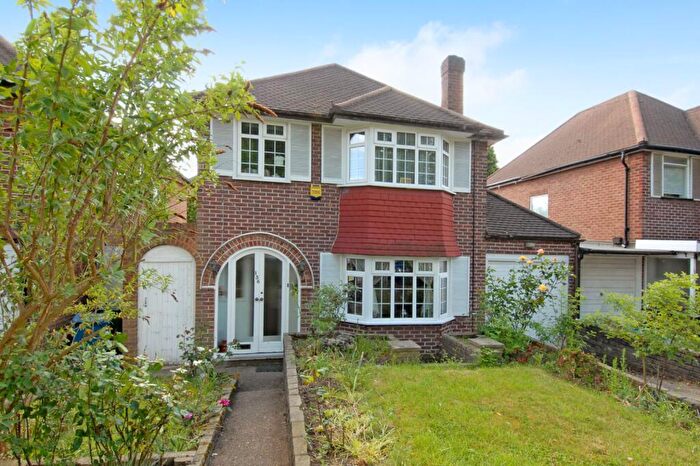
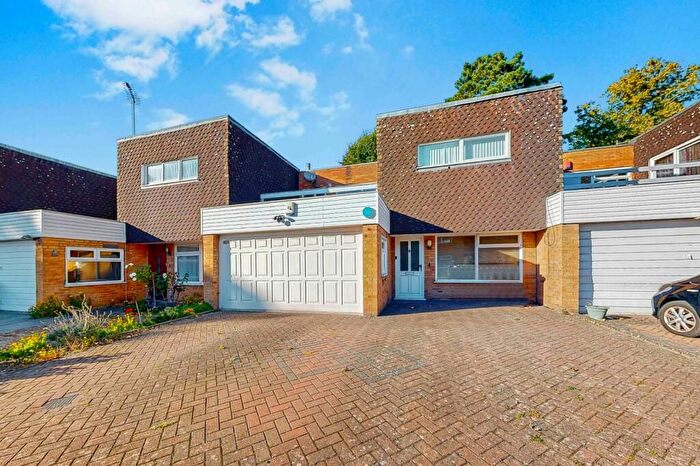
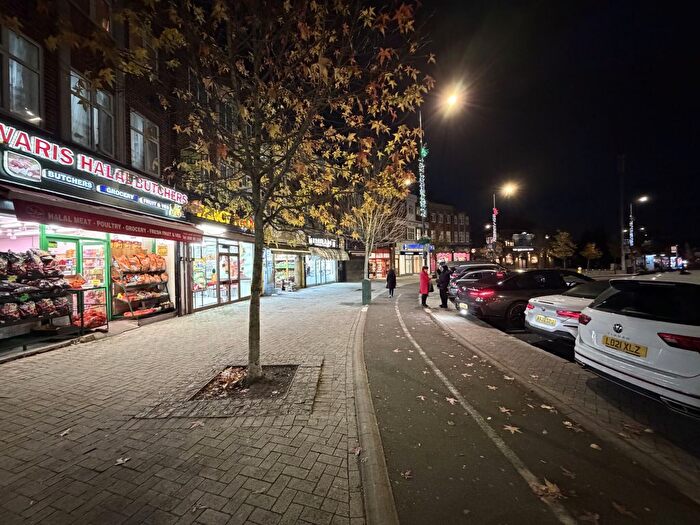
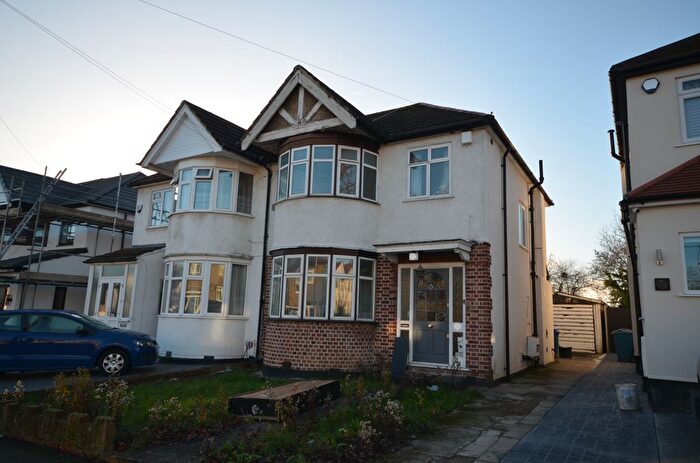
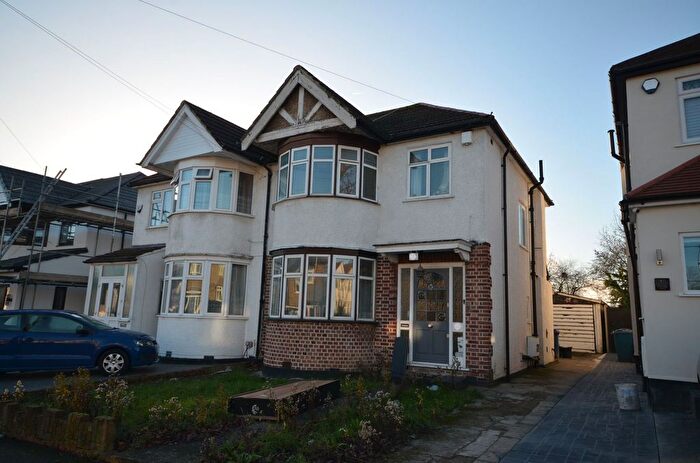
Houses for sale & to rent in HA7 2QA, Belmont Lane, Belmont, Stanmore
House Prices in HA7 2QA, Belmont Lane, Belmont
Properties in HA7 2QA have no sales history available within the last 3 years. HA7 2QA is a postcode in Belmont Lane located in Belmont, an area in Stanmore, Harrow London Borough, with 16 households².
Properties for sale near HA7 2QA, Belmont Lane
Price Paid in Belmont Lane, HA7 2QA, Belmont
71 Belmont Lane, HA7 2QA, Belmont Stanmore
Property 71 has been sold 2 times. The last time it was sold was in 05/12/2018 and the sold price was £740,000.00.
This semi detached house, sold as a freehold on 05/12/2018, is a 102 sqm detached house with an EPC rating of D.
| Date | Price | Property Type | Tenure | Classification |
|---|---|---|---|---|
| 05/12/2018 | £740,000.00 | Semi Detached House | freehold | Established Building |
| 23/11/2007 | £455,000.00 | Semi Detached House | freehold | Established Building |
95 Belmont Lane, HA7 2QA, Belmont Stanmore
Property 95 has been sold 2 times. The last time it was sold was in 31/07/2018 and the sold price was £810,000.00.
This semi detached house, sold as a freehold on 31/07/2018, is a 127 sqm detached house with an EPC rating of C.
| Date | Price | Property Type | Tenure | Classification |
|---|---|---|---|---|
| 31/07/2018 | £810,000.00 | Semi Detached House | freehold | Established Building |
| 01/08/2014 | £620,000.00 | Semi Detached House | freehold | Established Building |
79 Belmont Lane, HA7 2QA, Belmont Stanmore
Property 79 has been sold 3 times. The last time it was sold was in 30/05/2017 and the sold price was £815,000.00.
This detached house, sold as a freehold on 30/05/2017, is a 130 sqm detached house with an EPC rating of E.
| Date | Price | Property Type | Tenure | Classification |
|---|---|---|---|---|
| 30/05/2017 | £815,000.00 | Detached House | freehold | Established Building |
| 04/09/2008 | £530,000.00 | Detached House | freehold | Established Building |
| 14/06/1996 | £144,000.00 | Detached House | freehold | Established Building |
73 Belmont Lane, HA7 2QA, Belmont Stanmore
Property 73 has been sold 1 time. The last time it was sold was in 10/11/2015 and the sold price was £665,000.00.
This semi detached house, sold as a freehold on 10/11/2015, is a 90 sqm detached house with an EPC rating of E.
| Date | Price | Property Type | Tenure | Classification |
|---|---|---|---|---|
| 10/11/2015 | £665,000.00 | Semi Detached House | freehold | Established Building |
85 Belmont Lane, HA7 2QA, Belmont Stanmore
Property 85 has been sold 1 time. The last time it was sold was in 19/12/2013 and the sold price was £620,000.00.
This detached house, sold as a freehold on 19/12/2013, is a 121 sqm detached house with an EPC rating of D.
| Date | Price | Property Type | Tenure | Classification |
|---|---|---|---|---|
| 19/12/2013 | £620,000.00 | Detached House | freehold | Established Building |
81 Belmont Lane, HA7 2QA, Belmont Stanmore
Property 81 has been sold 1 time. The last time it was sold was in 13/11/2013 and the sold price was £605,000.00.
This semi detached house, sold as a freehold on 13/11/2013, is a 102 sqm detached house with an EPC rating of E.
| Date | Price | Property Type | Tenure | Classification |
|---|---|---|---|---|
| 13/11/2013 | £605,000.00 | Semi Detached House | freehold | Established Building |
75 Belmont Lane, HA7 2QA, Belmont Stanmore
Property 75 has been sold 1 time. The last time it was sold was in 21/07/2010 and the sold price was £520,000.00.
This detached house, sold as a freehold on 21/07/2010, is a 124 sqm detached house with an EPC rating of E.
| Date | Price | Property Type | Tenure | Classification |
|---|---|---|---|---|
| 21/07/2010 | £520,000.00 | Detached House | freehold | Established Building |
89 Belmont Lane, HA7 2QA, Belmont Stanmore
Property 89 has been sold 1 time. The last time it was sold was in 02/08/2007 and the sold price was £532,000.00.
This detached house, sold as a freehold on 02/08/2007, is a 106 sqm detached house with an EPC rating of D.
| Date | Price | Property Type | Tenure | Classification |
|---|---|---|---|---|
| 02/08/2007 | £532,000.00 | Detached House | freehold | Established Building |
67 Belmont Lane, HA7 2QA, Belmont Stanmore
Property 67 has been sold 1 time. The last time it was sold was in 30/11/2001 and the sold price was £350,000.00.
This is a Semi Detached House which was sold as a freehold in 30/11/2001
| Date | Price | Property Type | Tenure | Classification |
|---|---|---|---|---|
| 30/11/2001 | £350,000.00 | Semi Detached House | freehold | Established Building |
91 Belmont Lane, HA7 2QA, Belmont Stanmore
Property 91 has been sold 1 time. The last time it was sold was in 25/09/1998 and the sold price was £198,000.00.
This is a Semi Detached House which was sold as a freehold in 25/09/1998
| Date | Price | Property Type | Tenure | Classification |
|---|---|---|---|---|
| 25/09/1998 | £198,000.00 | Semi Detached House | freehold | Established Building |
93 Belmont Lane, HA7 2QA, Belmont Stanmore
Property 93 has been sold 1 time. The last time it was sold was in 02/10/1996 and the sold price was £135,000.00.
This is a Detached House which was sold as a freehold in 02/10/1996
| Date | Price | Property Type | Tenure | Classification |
|---|---|---|---|---|
| 02/10/1996 | £135,000.00 | Detached House | freehold | Established Building |
77 BELMONT LANE STANMORE, HA7 2QA, Belmont Stanmore
This is a 117 square meter Detached House with an EPC rating of D. Currently, there is no transaction history available for this property.
Postcodes in Belmont Lane, Belmont
Navigate through other locations in Belmont Lane, Belmont, Stanmore to see more property listings for sale or to rent.
Transport near HA7 2QA, Belmont Lane
-
Canons Park Station
-
Stanmore Station
-
Queensbury Station
-
Harrow and Wealdstone Station
-
Edgware Station
-
Kenton Station
-
Northwick Park Station
-
Burnt Oak Station
-
Headstone Lane Station
-
Kingsbury Station
House price paid reports for HA7 2QA, Belmont Lane
Click on the buttons below to see price paid reports by year or property price:
- Price Paid By Year
Property Price Paid in HA7 2QA, Belmont Lane by Year
The average sold property price by year was:
| Year | Average Sold Price | Price Change |
Sold Properties
|
|---|---|---|---|
| 2018 | £775,000 | -5% |
2 Properties |
| 2017 | £815,000 | 18% |
1 Property |
| 2015 | £665,000 | 7% |
1 Property |
| 2014 | £620,000 | 1% |
1 Property |
| 2013 | £612,500 | 15% |
2 Properties |
| 2010 | £520,000 | -2% |
1 Property |
| 2008 | £530,000 | 7% |
1 Property |
| 2007 | £493,500 | 29% |
2 Properties |
| 2001 | £350,000 | 43% |
1 Property |
| 1998 | £198,000 | 30% |
1 Property |
| 1996 | £139,500 | - |
2 Properties |

