
Houses for sale & to rent in Brooklands, Romford
House Prices in Brooklands
Properties in this part of Brooklands within Romford have an average house price of £382k and had 589 Property Transactions within the last 3 years¹. This area has 6,084 households² , where the most expensive property was sold for £2.29M.
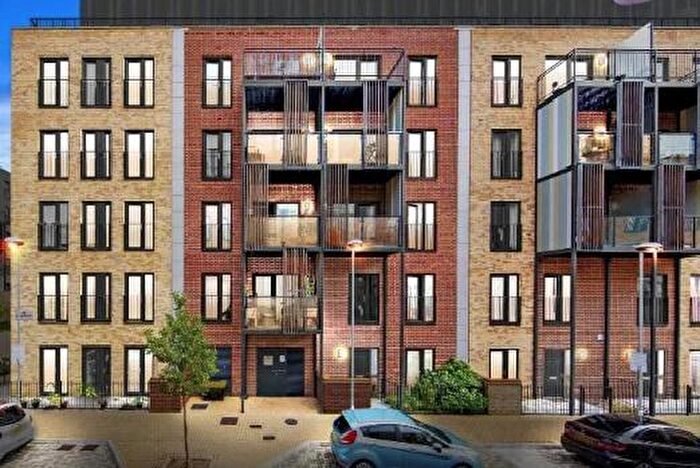
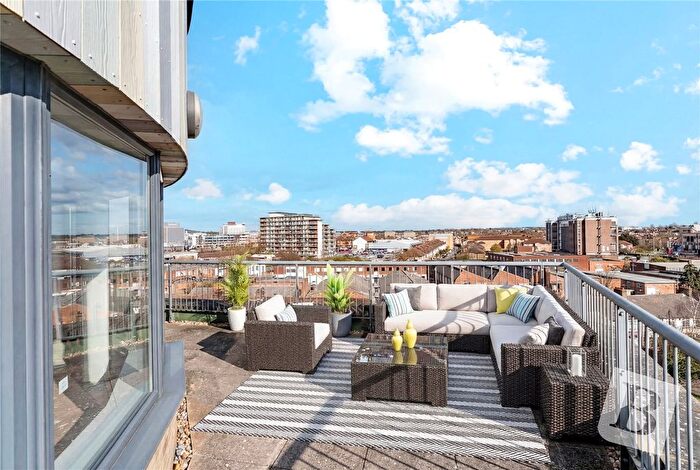
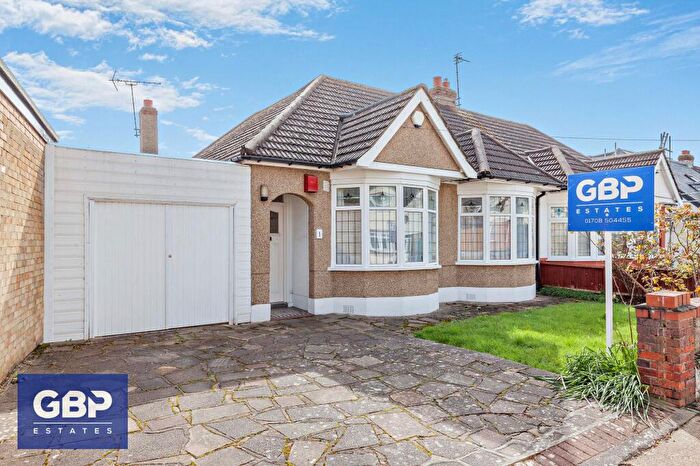
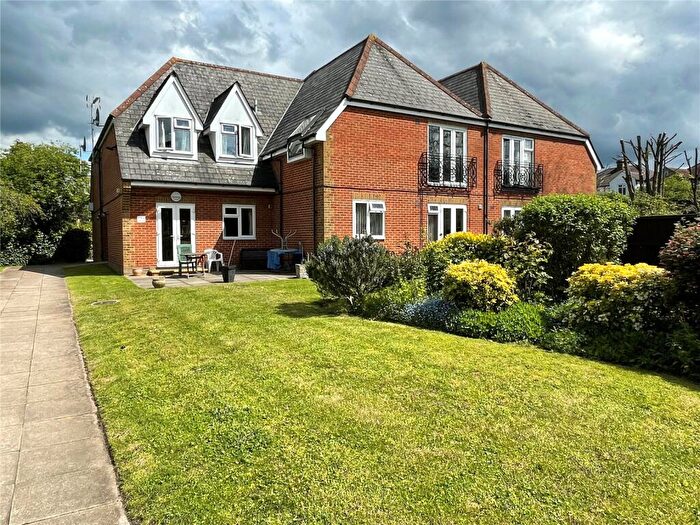
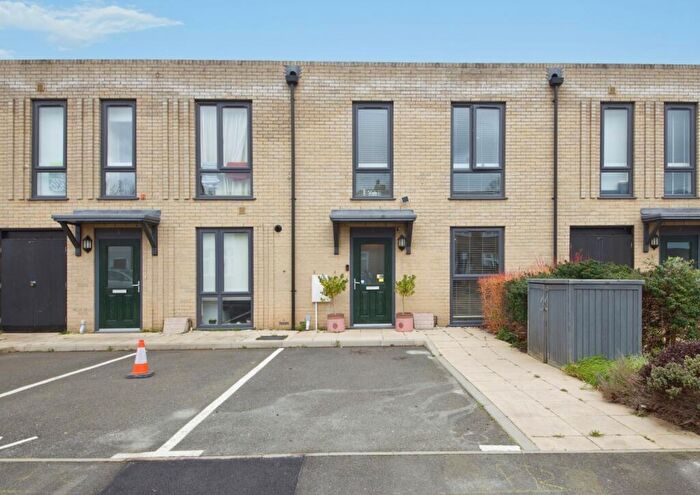
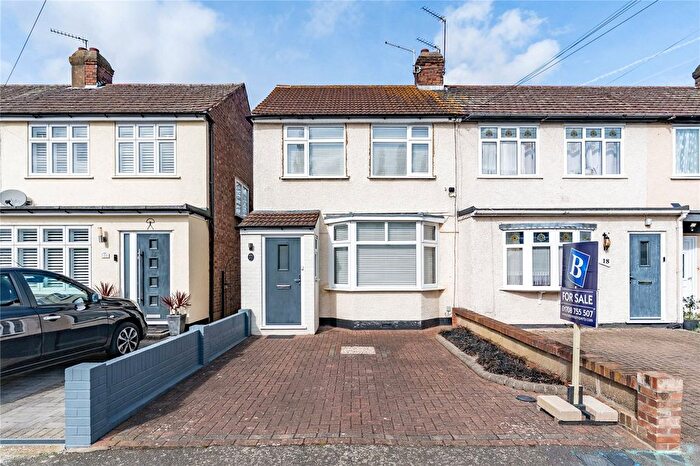
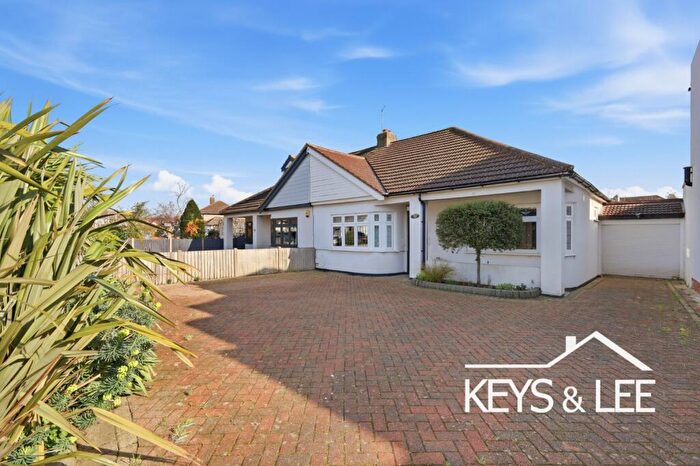
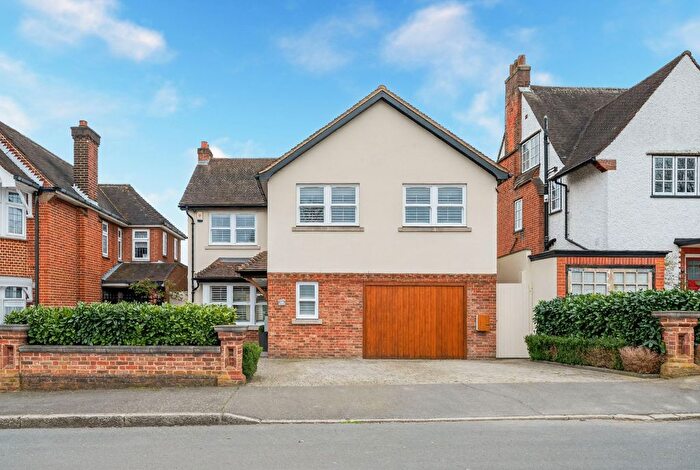
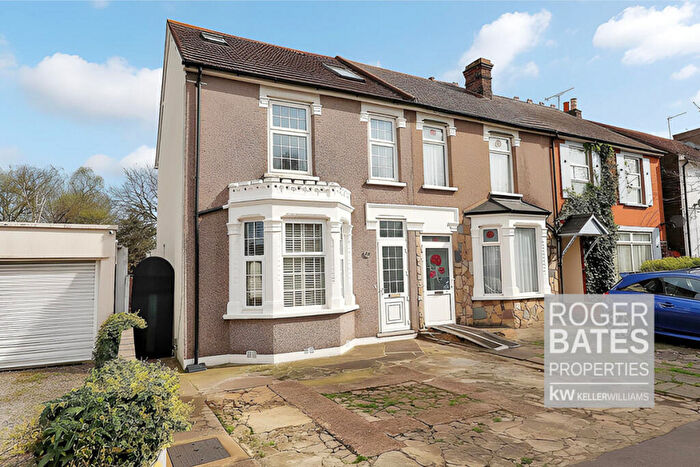
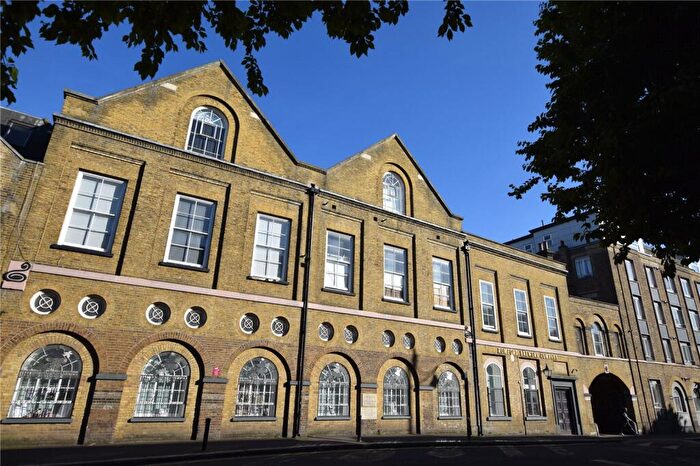
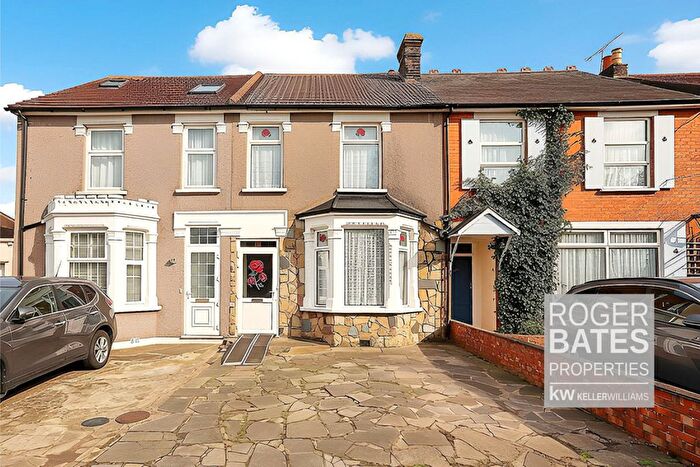
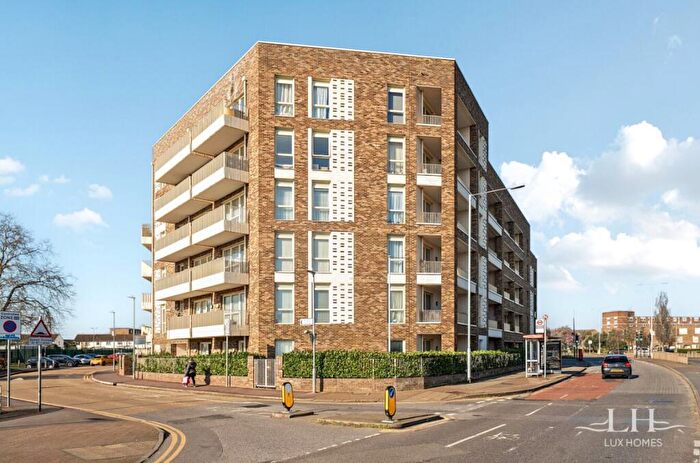
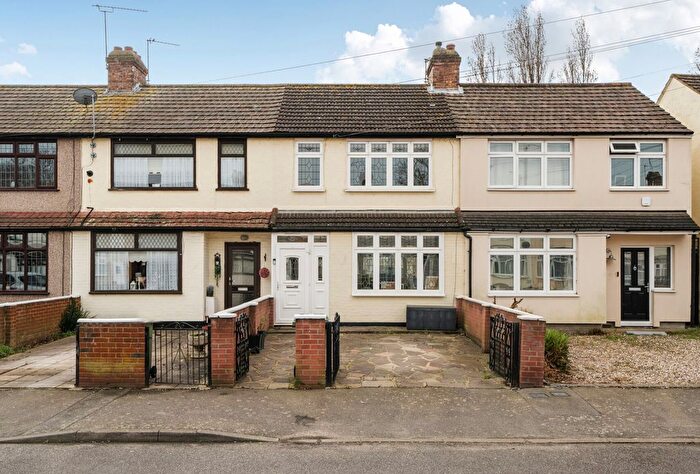
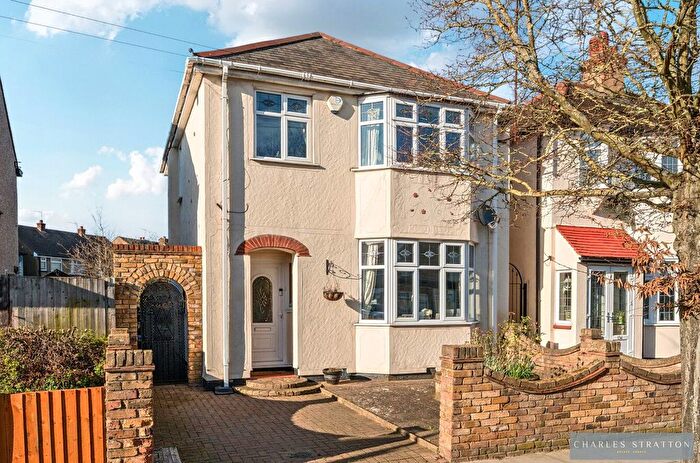
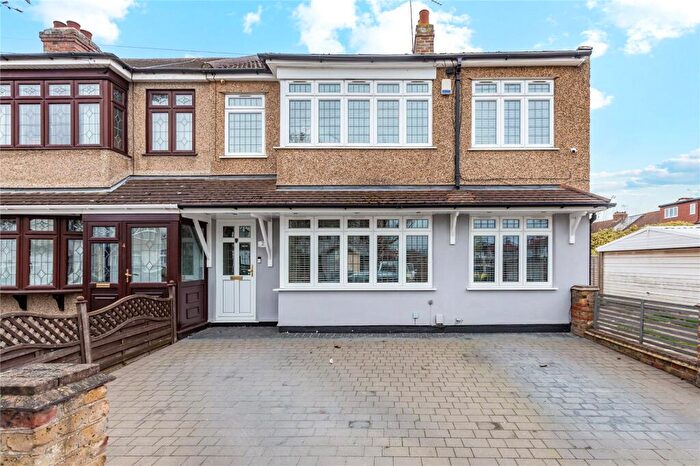
Properties for sale in Brooklands


![]()
If you are looking to sell your house, let it out, or receive a property valuation, an expert can help you.
Click the button below to get started.


Roads and Postcodes in Brooklands
Navigate through our locations to find the location of your next house in Brooklands, Romford for sale or to rent.
Transport near Brooklands
-


 Romford Station
 -
Gidea Park Station
-
Chadwell Heath Station
-
 Dagenham East Station
 -
Elm Park Station
-
Emerson Park Station
-
Dagenham Heathway Station
-
Hornchurch Station
-
Goodmayes Station
-
Becontree Station
- FAQ
- Price Paid By Year
- Property Type Price
Frequently asked questions about Brooklands
What is the average price for a property for sale in Brooklands?
The average price for a property for sale in Brooklands is £382,091. This amount is 9% lower than the average price in Romford. There are 6,677 property listings for sale in Brooklands.
What streets have the most expensive properties for sale in Brooklands?
The streets with the most expensive properties for sale in Brooklands are Kimberley Avenue at an average of £602,500, Cedar Road at an average of £579,413 and Linden Street at an average of £551,666.
What streets have the most affordable properties for sale in Brooklands?
The streets with the most affordable properties for sale in Brooklands are Holland Close at an average of £167,500, South Street at an average of £179,250 and Barkwood Close at an average of £186,000.
Which train stations are available in or near Brooklands?
Some of the train stations available in or near Brooklands are Romford, Gidea Park and Chadwell Heath.
Which tube stations are available in or near Brooklands?
Some of the tube stations available in or near Brooklands are Dagenham East, Elm Park and Dagenham Heathway.
Property Price Paid in Brooklands by Year
The average sold property price by year was:
| Year | Average Sold Price | Price Change |
Sold Properties
|
|---|---|---|---|
| 2025 | £395,746 | 3% |
186 Properties |
| 2024 | £383,016 | 4% |
208 Properties |
| 2023 | £368,080 | -2% |
195 Properties |
| 2022 | £376,766 | 1% |
267 Properties |
| 2021 | £372,688 | 12% |
324 Properties |
| 2020 | £329,497 | 2% |
197 Properties |
| 2019 | £322,963 | 2% |
252 Properties |
| 2018 | £316,696 | -2% |
289 Properties |
| 2017 | £322,328 | 13% |
273 Properties |
| 2016 | £278,838 | 16% |
322 Properties |
| 2015 | £233,719 | 7% |
488 Properties |
| 2014 | £216,330 | 8% |
343 Properties |
| 2013 | £198,271 | 9% |
371 Properties |
| 2012 | £179,919 | -9% |
251 Properties |
| 2011 | £196,899 | -3% |
147 Properties |
| 2010 | £203,029 | 12% |
161 Properties |
| 2009 | £178,665 | -18% |
141 Properties |
| 2008 | £211,257 | 2% |
190 Properties |
| 2007 | £206,157 | 7% |
436 Properties |
| 2006 | £191,012 | 7% |
322 Properties |
| 2005 | £178,180 | 1% |
332 Properties |
| 2004 | £176,018 | 9% |
318 Properties |
| 2003 | £160,183 | 17% |
310 Properties |
| 2002 | £133,503 | 19% |
333 Properties |
| 2001 | £107,932 | 9% |
332 Properties |
| 2000 | £97,803 | 21% |
278 Properties |
| 1999 | £77,601 | 7% |
303 Properties |
| 1998 | £72,277 | 12% |
232 Properties |
| 1997 | £63,781 | 8% |
265 Properties |
| 1996 | £58,987 | 1% |
264 Properties |
| 1995 | £58,424 | - |
202 Properties |
Property Price per Property Type in Brooklands
Here you can find historic sold price data in order to help with your property search.
The average Property Paid Price for specific property types in the last three years are:
| Property Type | Average Sold Price | Sold Properties |
|---|---|---|
| Semi Detached House | £457,591.00 | 154 Semi Detached Houses |
| Detached House | £501,746.00 | 19 Detached Houses |
| Terraced House | £434,148.00 | 233 Terraced Houses |
| Flat | £239,854.00 | 183 Flats |