
Houses for sale & to rent in Romford Town, Romford
House Prices in Romford Town
Properties in this part of Romford Town within Romford have an average house price of £380,194.00 and had 635 Property Transactions within the last 3 years¹. This area has 6,237 households² , where the most expensive property was sold for £1,157,000.00.
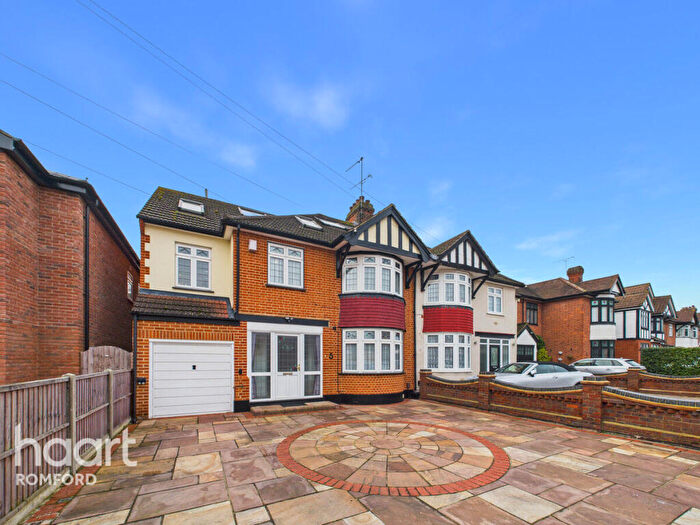
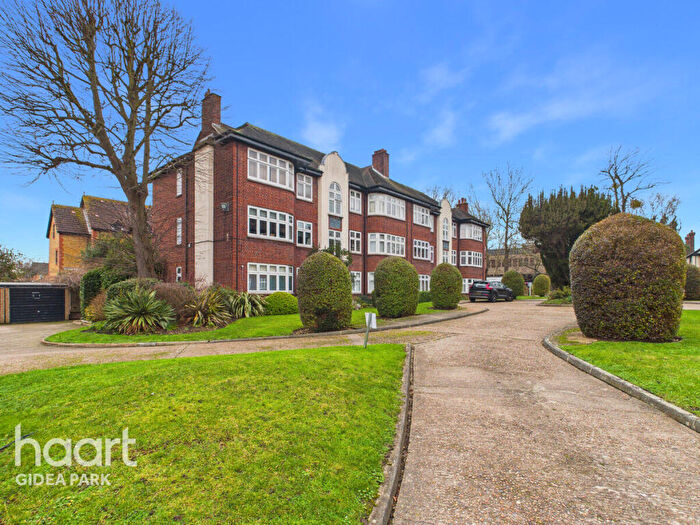
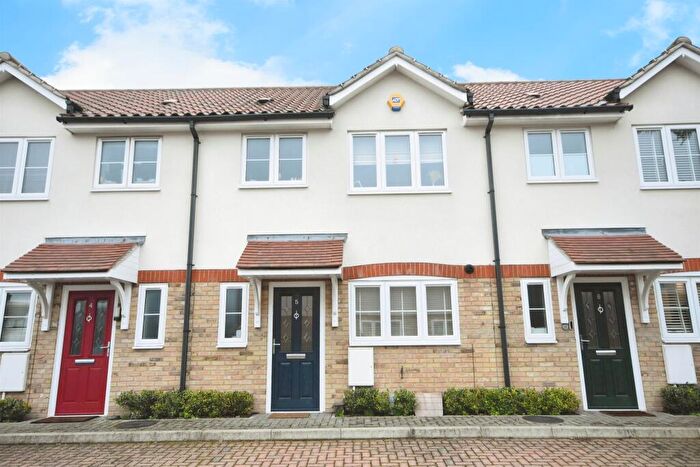
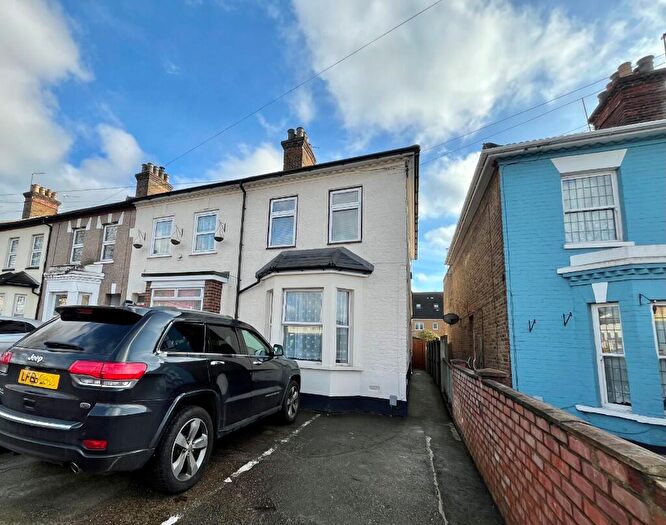
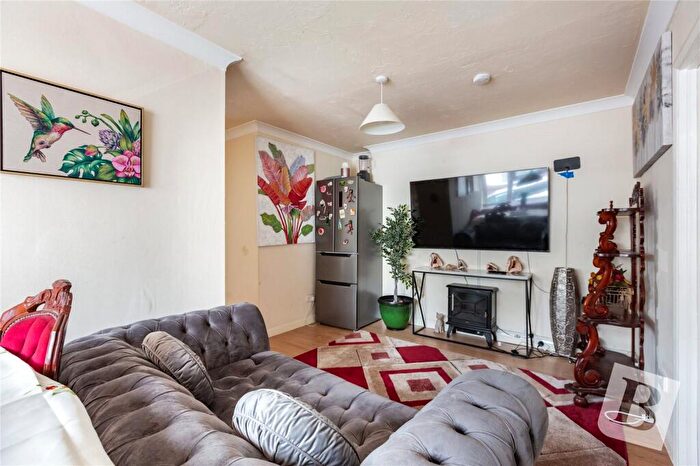
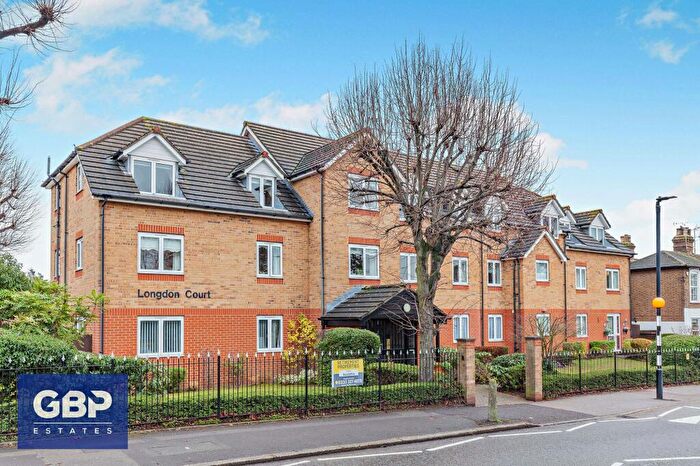
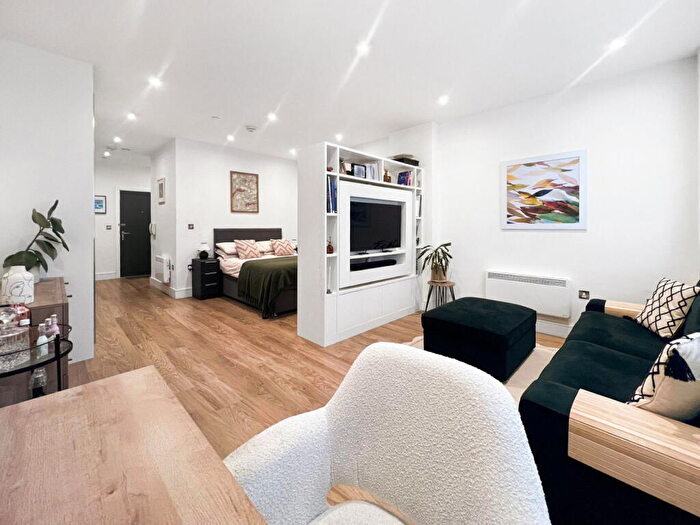
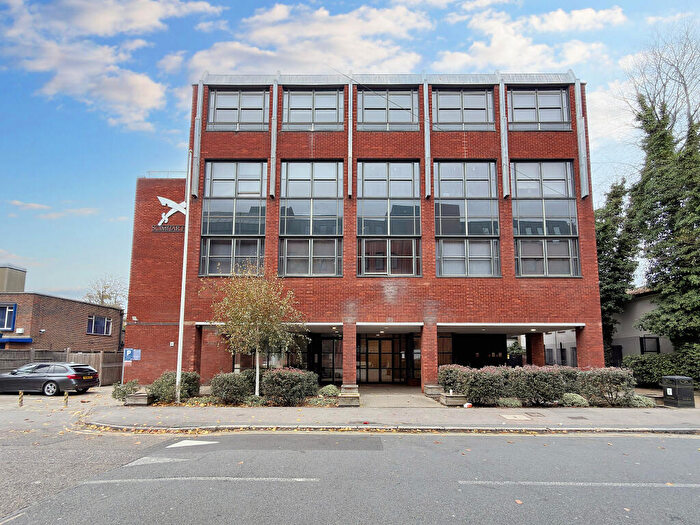
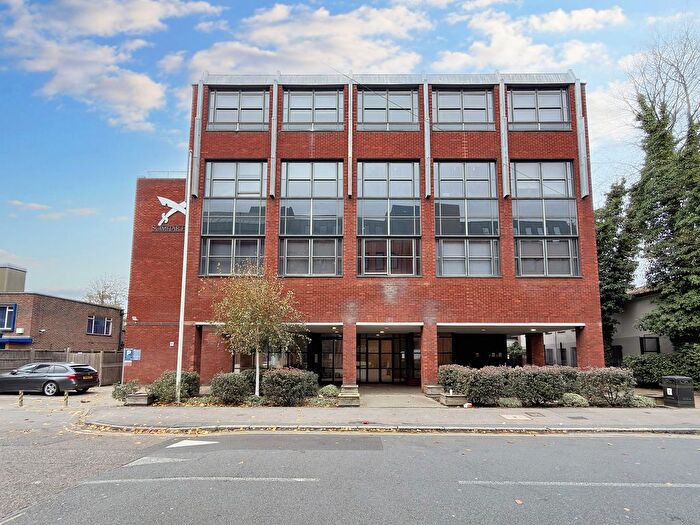
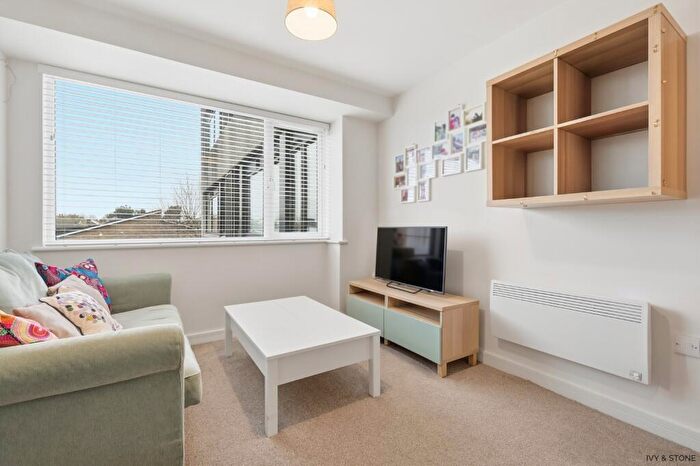
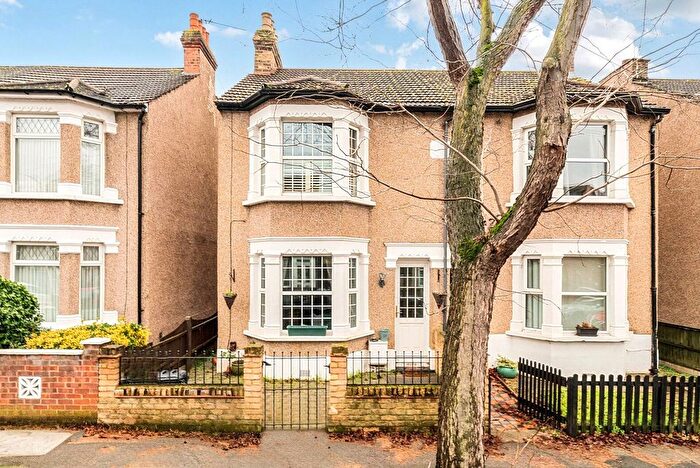
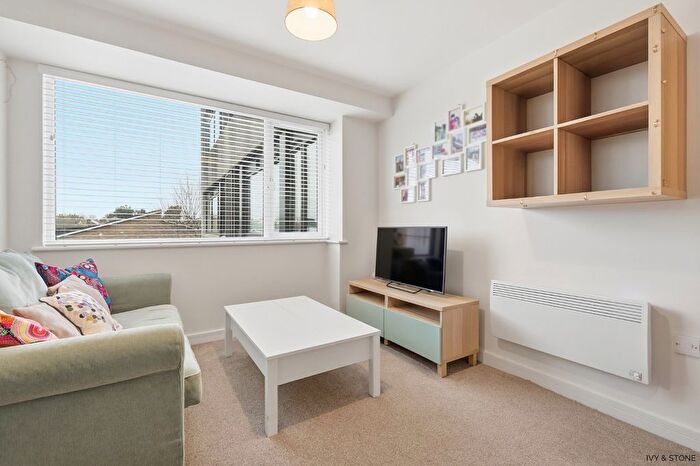
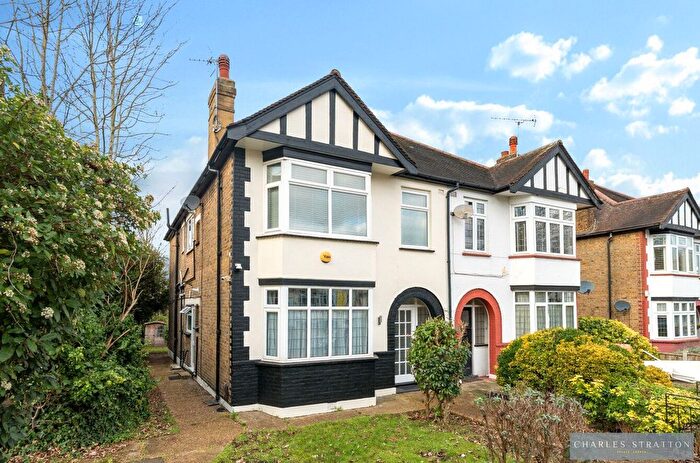
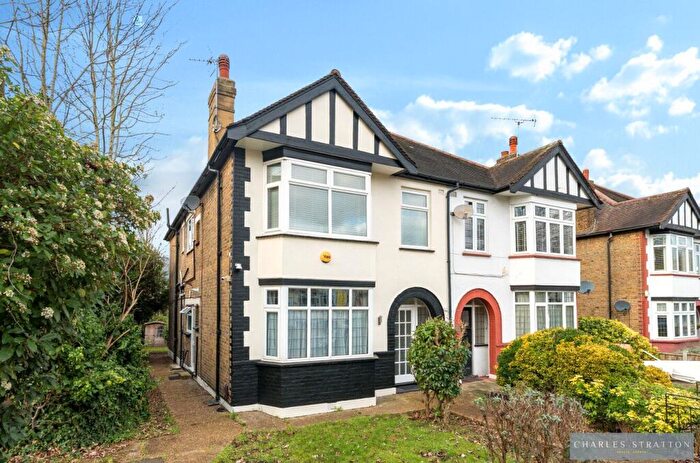
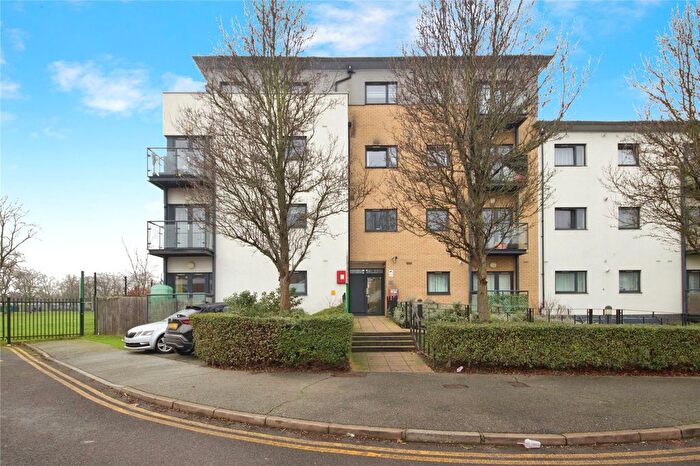
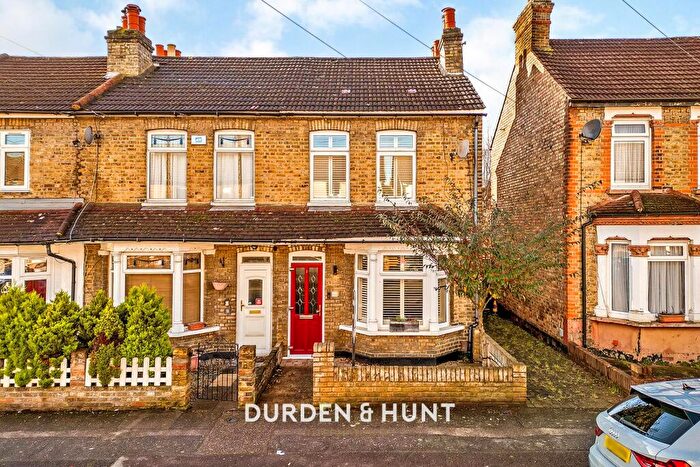
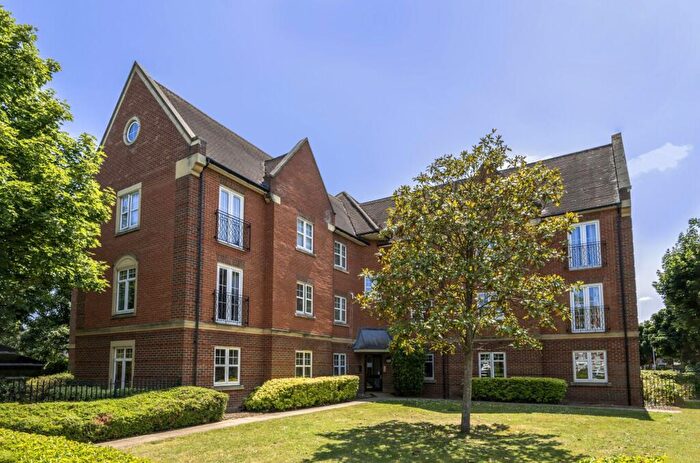
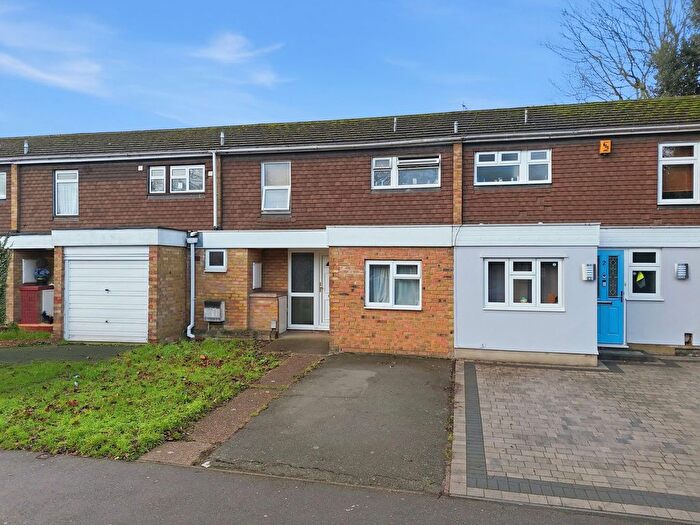
Properties for sale in Romford Town

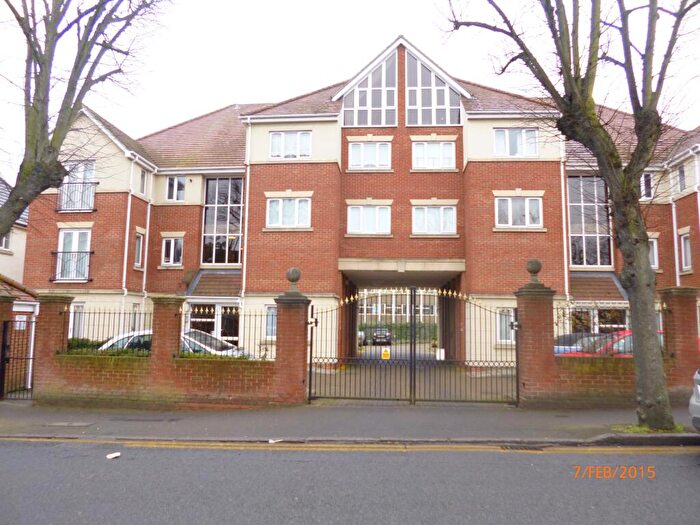
![]()
If you are looking to sell your house, let it out, or receive a property valuation, an expert can help you.
Click the button below to get started.

Roads and Postcodes in Romford Town
Navigate through our locations to find the location of your next house in Romford Town, Romford for sale or to rent.
Transport near Romford Town
-


 Romford Station
 -
Gidea Park Station
-
Emerson Park Station
-
 Elm Park Station
 -
Hornchurch Station
-
Harold Wood Station
-
Upminster Bridge Station
-
Dagenham East Station
-
Chadwell Heath Station
- FAQ
- Price Paid By Year
- Property Type Price
Frequently asked questions about Romford Town
What is the average price for a property for sale in Romford Town?
The average price for a property for sale in Romford Town is £380,194. This amount is 9% lower than the average price in Romford. There are 2,552 property listings for sale in Romford Town.
What streets have the most expensive properties for sale in Romford Town?
The streets with the most expensive properties for sale in Romford Town are Dickens Way at an average of £1,075,000, Lake Rise at an average of £892,600 and Oaklands Avenue at an average of £853,750.
What streets have the most affordable properties for sale in Romford Town?
The streets with the most affordable properties for sale in Romford Town are Loom Grove at an average of £95,000, Angel Way at an average of £112,043 and Admiral Lodge at an average of £133,740.
Which train stations are available in or near Romford Town?
Some of the train stations available in or near Romford Town are Romford, Gidea Park and Emerson Park.
Which tube stations are available in or near Romford Town?
Some of the tube stations available in or near Romford Town are Elm Park, Hornchurch and Upminster Bridge.
Property Price Paid in Romford Town by Year
The average sold property price by year was:
| Year | Average Sold Price | Price Change |
Sold Properties
|
|---|---|---|---|
| 2025 | £413,580 | 12% |
170 Properties |
| 2024 | £364,080 | -2% |
254 Properties |
| 2023 | £372,693 | 1% |
211 Properties |
| 2022 | £368,277 | 0,4% |
326 Properties |
| 2021 | £366,697 | 4% |
397 Properties |
| 2020 | £350,366 | 6% |
299 Properties |
| 2019 | £329,161 | -2% |
311 Properties |
| 2018 | £337,078 | 10% |
269 Properties |
| 2017 | £301,949 | 5% |
334 Properties |
| 2016 | £287,519 | - |
441 Properties |
| 2015 | £287,662 | 13% |
285 Properties |
| 2014 | £249,425 | 13% |
340 Properties |
| 2013 | £217,296 | 3% |
228 Properties |
| 2012 | £210,409 | -5% |
196 Properties |
| 2011 | £220,806 | 9% |
208 Properties |
| 2010 | £201,202 | 4% |
215 Properties |
| 2009 | £192,174 | -9% |
224 Properties |
| 2008 | £209,479 | -3% |
258 Properties |
| 2007 | £216,480 | 6% |
601 Properties |
| 2006 | £204,143 | 5% |
420 Properties |
| 2005 | £193,819 | -2% |
292 Properties |
| 2004 | £197,785 | 12% |
370 Properties |
| 2003 | £173,658 | 16% |
380 Properties |
| 2002 | £146,558 | 10% |
511 Properties |
| 2001 | £132,325 | 20% |
445 Properties |
| 2000 | £106,225 | -2% |
291 Properties |
| 1999 | £108,519 | 22% |
333 Properties |
| 1998 | £84,399 | 9% |
310 Properties |
| 1997 | £76,581 | 14% |
314 Properties |
| 1996 | £66,121 | - |
260 Properties |
| 1995 | £66,138 | - |
220 Properties |
Property Price per Property Type in Romford Town
Here you can find historic sold price data in order to help with your property search.
The average Property Paid Price for specific property types in the last three years are:
| Property Type | Average Sold Price | Sold Properties |
|---|---|---|
| Semi Detached House | £534,402.00 | 150 Semi Detached Houses |
| Detached House | £698,096.00 | 39 Detached Houses |
| Terraced House | £480,068.00 | 124 Terraced Houses |
| Flat | £231,393.00 | 322 Flats |