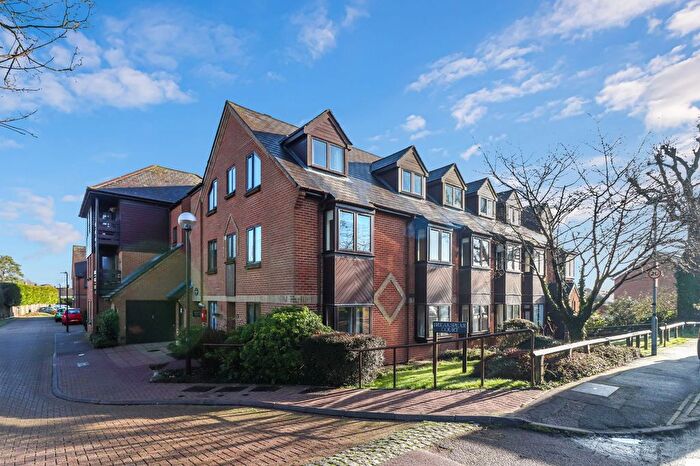
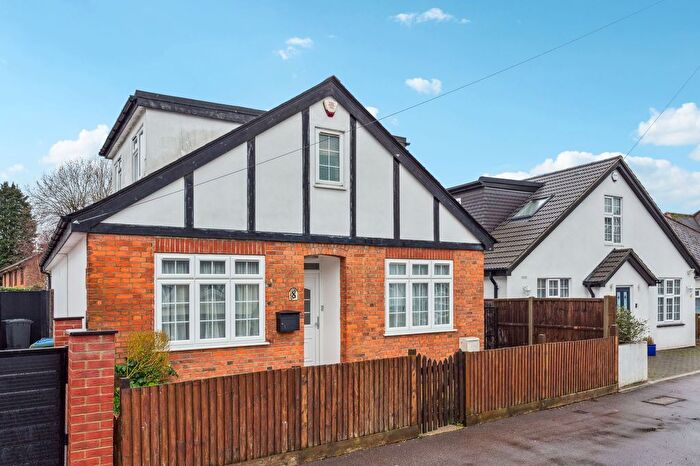
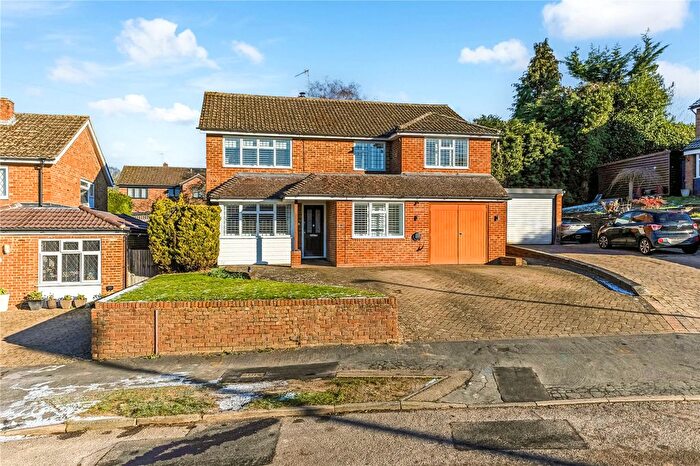
Houses for sale & to rent in Abbots Langley And Bedmond, Abbots Langley
House Prices in Abbots Langley And Bedmond
Properties in Abbots Langley And Bedmond have an average house price of £534,063.00 and had 179 Property Transactions within the last 3 years¹.
Abbots Langley And Bedmond is an area in Abbots Langley, Hertfordshire with 2,260 households², where the most expensive property was sold for £1,510,000.00.
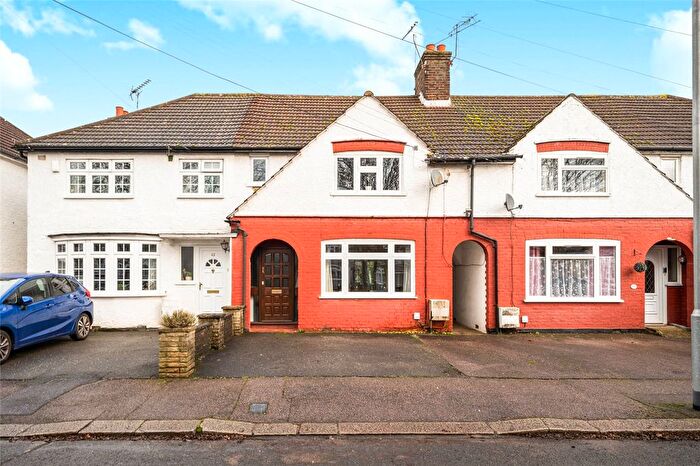
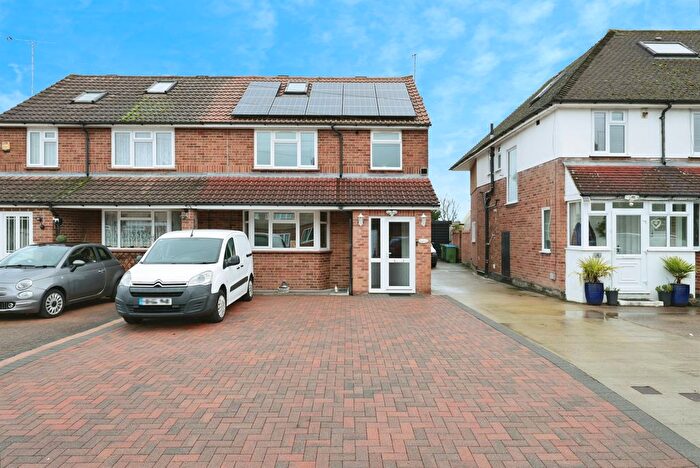
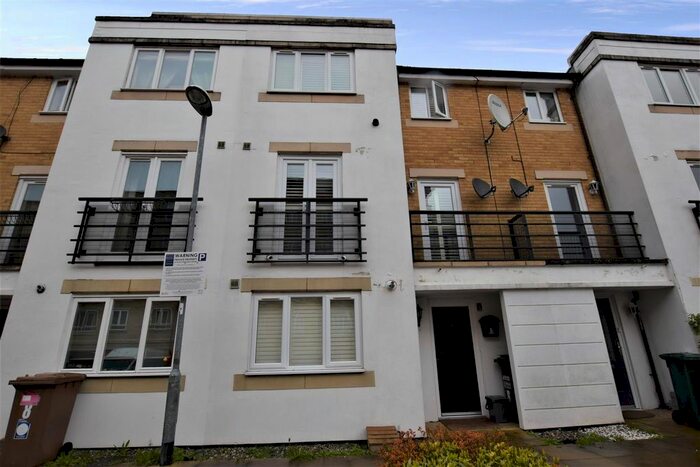
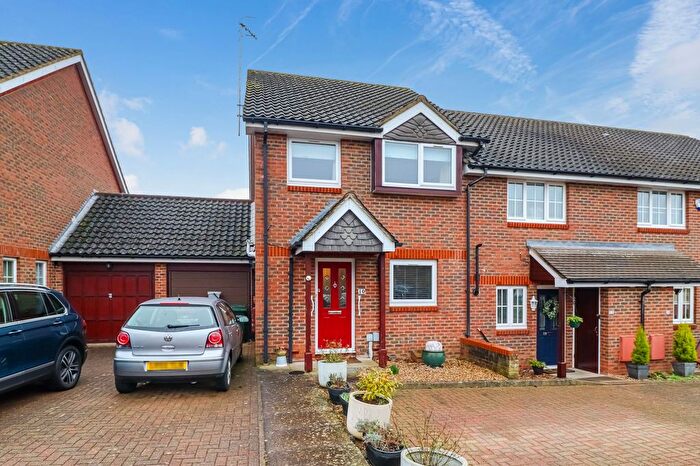
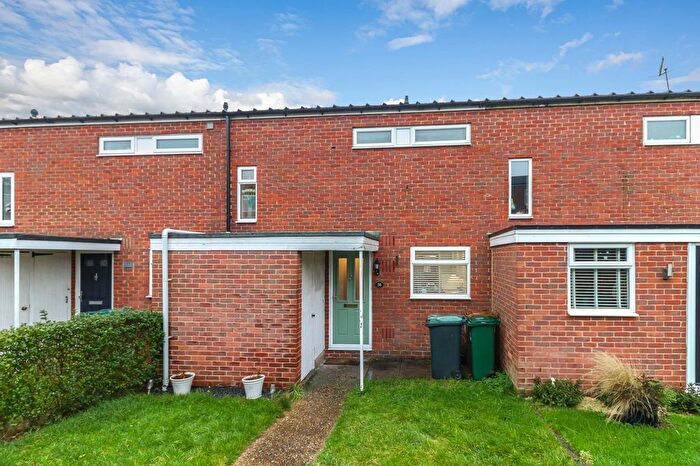
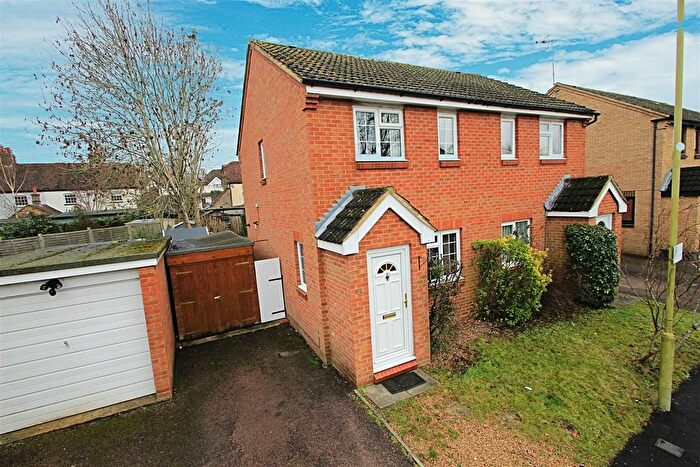
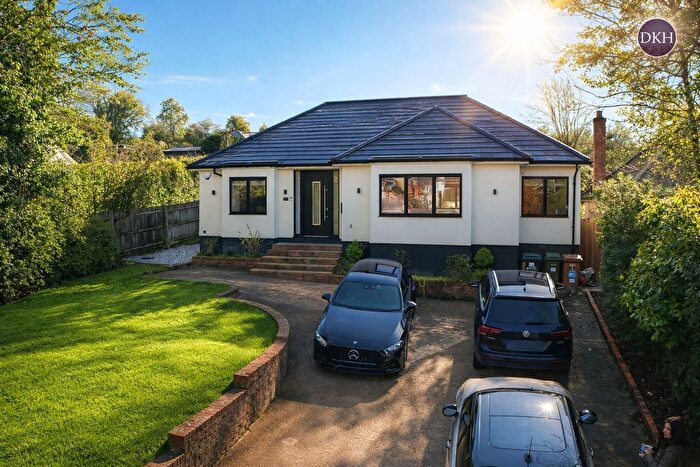
Properties for sale in Abbots Langley And Bedmond
Roads and Postcodes in Abbots Langley And Bedmond
Navigate through our locations to find the location of your next house in Abbots Langley And Bedmond, Abbots Langley for sale or to rent.
| Streets | Postcodes |
|---|---|
| Abbots Road | WD5 0AY WD5 0AZ WD5 0BG WD5 0BH WD5 0BJ WD5 0BL WD5 0BN WD5 0BP |
| Adrian Road | WD5 0AG WD5 0AQ |
| Antoinette Court | WD5 0QL |
| Bedmond Road | WD5 0QB WD5 0QD WD5 0QE WD5 0QQ WD5 0RP WD5 0RS |
| Bell Close | WD5 0QU |
| Bell Lane | WD5 0QS WD5 0QT |
| Bishops Court | WD5 0HX |
| Bluebell Drive | WD5 0SU |
| Breakspear Court | WD5 0DP |
| Breakspear Place | WD5 0QF |
| Breakspeare Road | WD5 0EP WD5 0ER |
| Cherry Hollow | WD5 0TR |
| Church Hill | WD5 0RN WD5 0RW |
| Creasy Close | WD5 0HS |
| Dairy Way | WD5 0QJ |
| Dellmeadow | WD5 0BA |
| East Lane | WD5 0QG |
| Ethelwine Place | WD5 0EX |
| Follett Drive | WD5 0LP |
| Gallows Hill Lane | WD5 0BU WD5 0DB WD5 0DD |
| Garden Road | WD5 0ES |
| Greenways | WD5 0EU |
| Hanover Gardens | WD5 0AX |
| Henderson Place | WD5 0RE |
| High Street | WD5 0AA WD5 0AD WD5 0AE WD5 0AH WD5 0AJ WD5 0AN WD5 0AR WD5 0AW WD5 0QP WD5 0QX |
| Jacketts Field | WD5 0EN WD5 0EW |
| Kindersley Way | WD5 0DG WD5 0DQ |
| Kitters Green | WD5 0ET WD5 0HP |
| Langley Road | WD5 0AB WD5 0EH WD5 0EJ WD5 0EQ |
| Little How Croft | WD5 0BR |
| Love Lane | WD5 0QA |
| Manor House Gardens | WD5 0DH |
| Marlin Square | WD5 0EG |
| Meadow Way | WD5 0RD |
| Millhouse Lane | WD5 0SF |
| Oak Green | WD5 0PG WD5 0PH WD5 0RJ |
| Oak Green Way | WD5 0PJ |
| Old Place Gardens | WD5 0RH |
| Parnell Close | WD5 0DZ |
| Parsonage Close | WD5 0BQ |
| Popes Road | WD5 0EY WD5 0FD |
| Sergehill Lane | WD5 0RT |
| St Lawrence Close | WD5 0AU |
| Standfield | WD5 0BB |
| Summerhouse Way | WD5 0DX WD5 0DY WD5 0EA |
| The Crescent | WD5 0DR WD5 0DS |
| The Grange | WD5 0EL |
| Tibbs Hill Road | WD5 0DU WD5 0EB WD5 0ED WD5 0EE WD5 0LH WD5 0LJ WD5 0LL |
| Tithe Barn Court | WD5 0TB |
| Toms Lane | WD5 0RA WD5 0RB |
| Trowley Rise | WD5 0LN WD5 0LW |
| Tylersfield | WD5 0PS WD5 0PT |
Transport near Abbots Langley And Bedmond
-
King's Langley Station
-
Garston (Hertfordshire) Station
-
Bricket Wood Station
-
Watford North Station
-
Apsley Station
- FAQ
- Price Paid By Year
- Property Type Price
Frequently asked questions about Abbots Langley And Bedmond
What is the average price for a property for sale in Abbots Langley And Bedmond?
The average price for a property for sale in Abbots Langley And Bedmond is £534,063. This amount is 9% higher than the average price in Abbots Langley. There are 1,733 property listings for sale in Abbots Langley And Bedmond.
What streets have the most expensive properties for sale in Abbots Langley And Bedmond?
The streets with the most expensive properties for sale in Abbots Langley And Bedmond are Little How Croft at an average of £1,073,000, Abbots Road at an average of £963,301 and Greenways at an average of £923,642.
What streets have the most affordable properties for sale in Abbots Langley And Bedmond?
The streets with the most affordable properties for sale in Abbots Langley And Bedmond are The Grange at an average of £167,000, Breakspear Court at an average of £243,300 and Kitters Green at an average of £244,583.
Which train stations are available in or near Abbots Langley And Bedmond?
Some of the train stations available in or near Abbots Langley And Bedmond are King's Langley, Garston (Hertfordshire) and Bricket Wood.
Property Price Paid in Abbots Langley And Bedmond by Year
The average sold property price by year was:
| Year | Average Sold Price | Price Change |
Sold Properties
|
|---|---|---|---|
| 2025 | £551,766 | 3% |
48 Properties |
| 2024 | £533,331 | 3% |
77 Properties |
| 2023 | £519,370 | -10% |
54 Properties |
| 2022 | £571,501 | 8% |
76 Properties |
| 2021 | £524,203 | 3% |
103 Properties |
| 2020 | £509,131 | 19% |
91 Properties |
| 2019 | £414,552 | -20% |
67 Properties |
| 2018 | £497,806 | 5% |
72 Properties |
| 2017 | £472,447 | -3% |
77 Properties |
| 2016 | £486,373 | 16% |
72 Properties |
| 2015 | £410,367 | 8% |
92 Properties |
| 2014 | £379,097 | 13% |
107 Properties |
| 2013 | £329,137 | 6% |
97 Properties |
| 2012 | £308,767 | -0,3% |
78 Properties |
| 2011 | £309,576 | 9% |
96 Properties |
| 2010 | £281,979 | -8% |
72 Properties |
| 2009 | £304,588 | -0,1% |
50 Properties |
| 2008 | £304,778 | -3% |
60 Properties |
| 2007 | £314,565 | 8% |
159 Properties |
| 2006 | £289,564 | 11% |
141 Properties |
| 2005 | £258,756 | -1% |
108 Properties |
| 2004 | £260,853 | 10% |
120 Properties |
| 2003 | £235,452 | 17% |
128 Properties |
| 2002 | £196,518 | 15% |
143 Properties |
| 2001 | £167,074 | 14% |
140 Properties |
| 2000 | £143,951 | 1% |
104 Properties |
| 1999 | £142,440 | 10% |
137 Properties |
| 1998 | £127,495 | 17% |
122 Properties |
| 1997 | £106,019 | 11% |
131 Properties |
| 1996 | £93,842 | 7% |
123 Properties |
| 1995 | £87,488 | - |
89 Properties |
Property Price per Property Type in Abbots Langley And Bedmond
Here you can find historic sold price data in order to help with your property search.
The average Property Paid Price for specific property types in the last three years are:
| Property Type | Average Sold Price | Sold Properties |
|---|---|---|
| Semi Detached House | £529,268.00 | 54 Semi Detached Houses |
| Detached House | £892,270.00 | 43 Detached Houses |
| Terraced House | £444,059.00 | 45 Terraced Houses |
| Flat | £234,229.00 | 37 Flats |

