
Houses for sale & to rent in Abbots Langley, Hertfordshire
House Prices in Abbots Langley
Properties in Abbots Langley have an average house price of £502k and had 406 Property Transactions within the last 3 years.¹
Abbots Langley is an area in Hertfordshire with 4,771 households², where the most expensive property was sold for £1.7M.
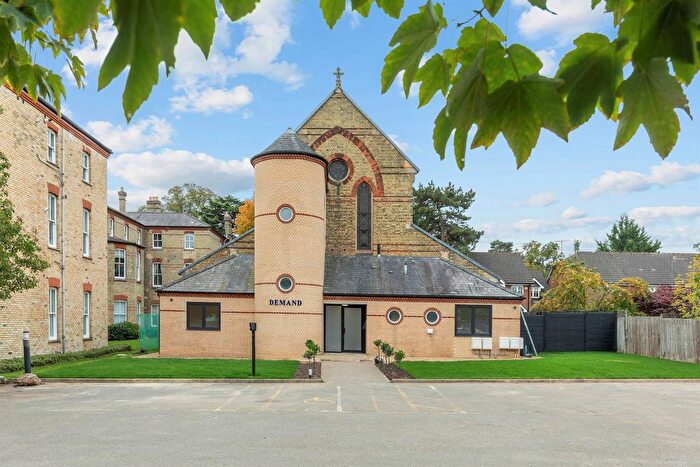
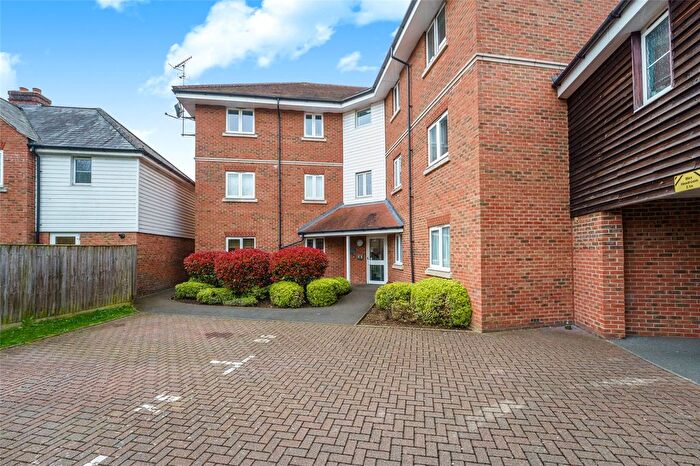
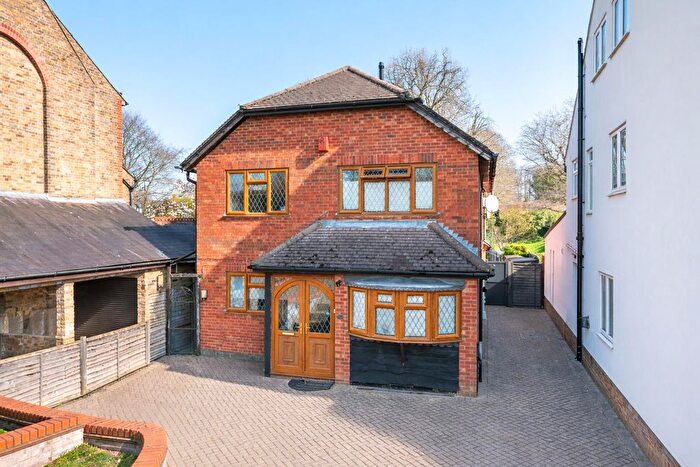
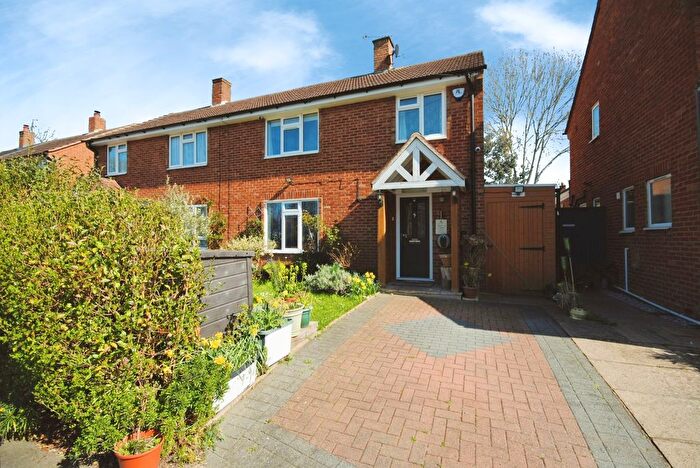
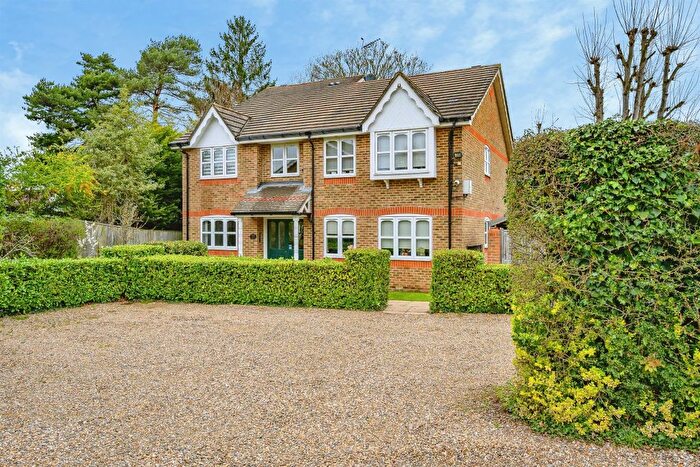
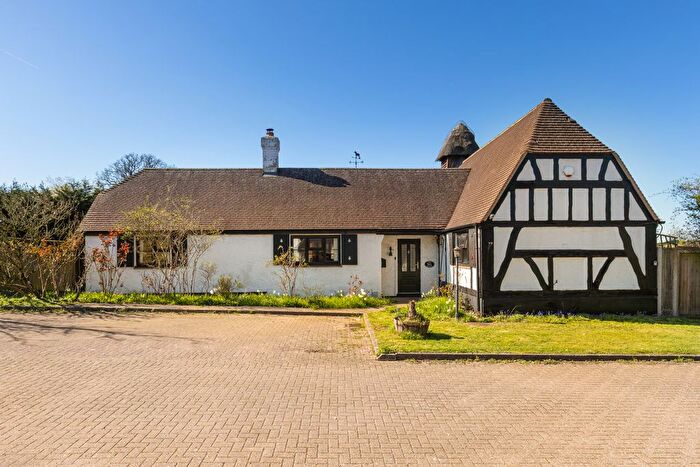
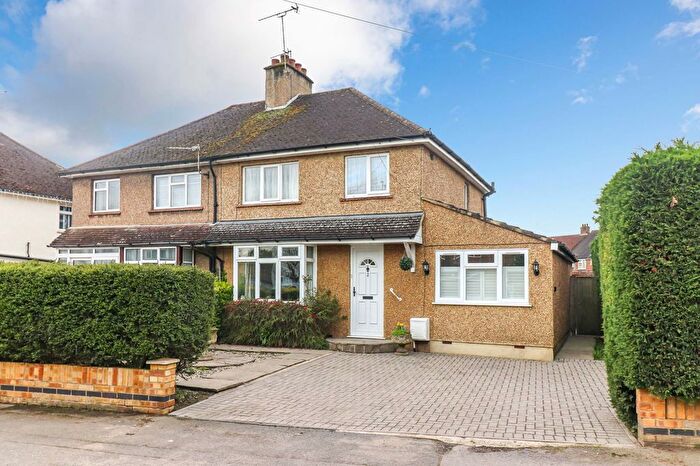
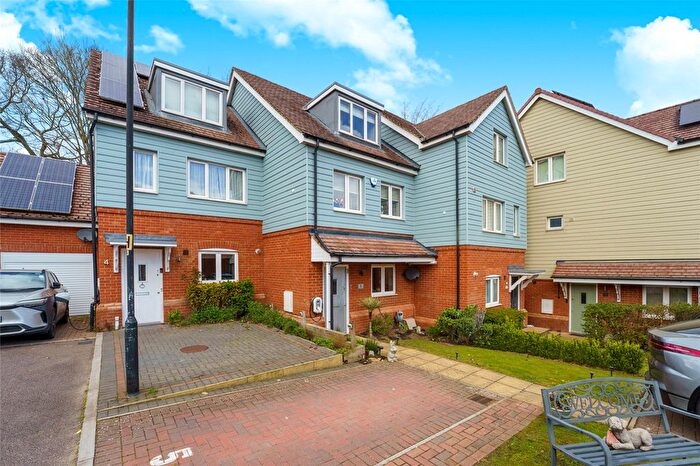
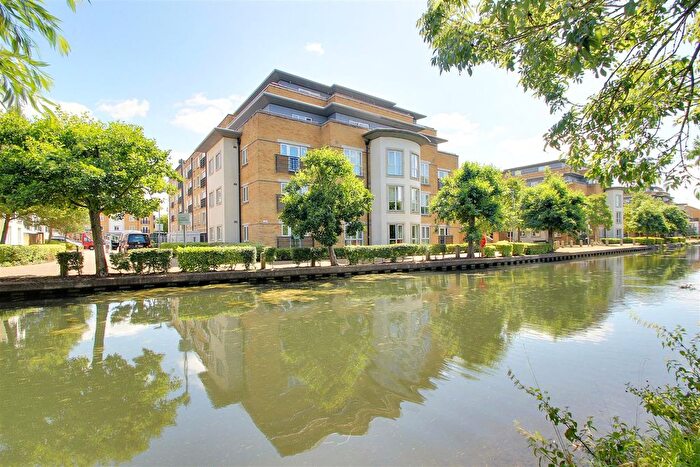
Properties for sale in Abbots Langley
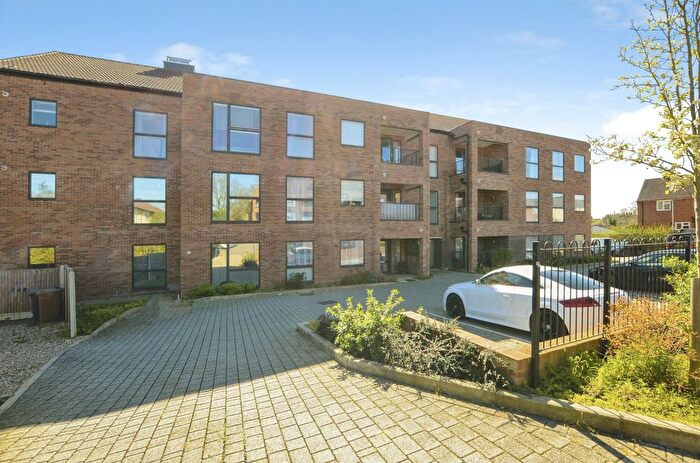
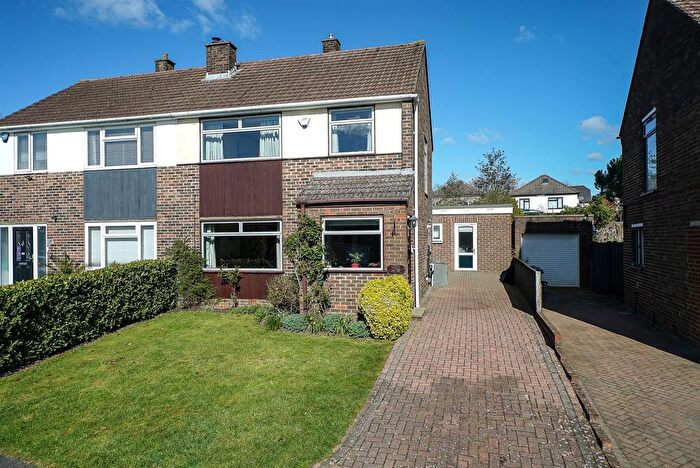
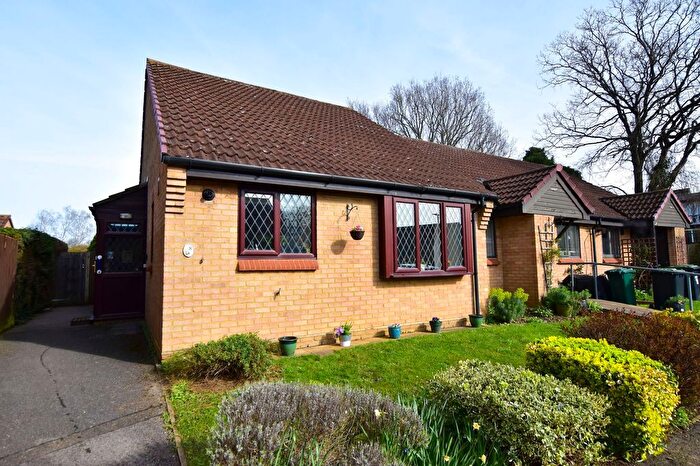
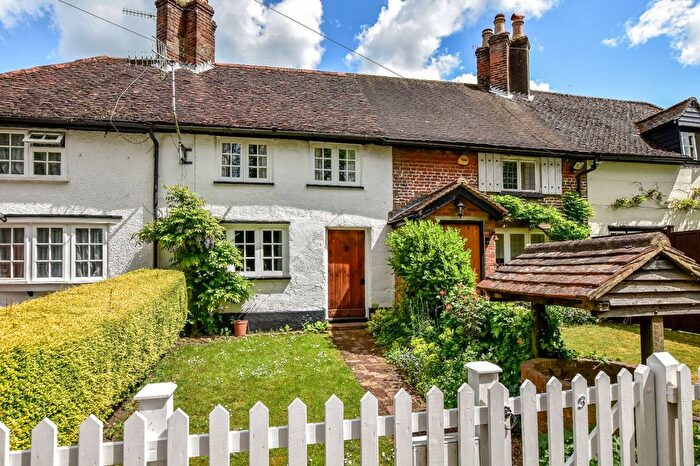
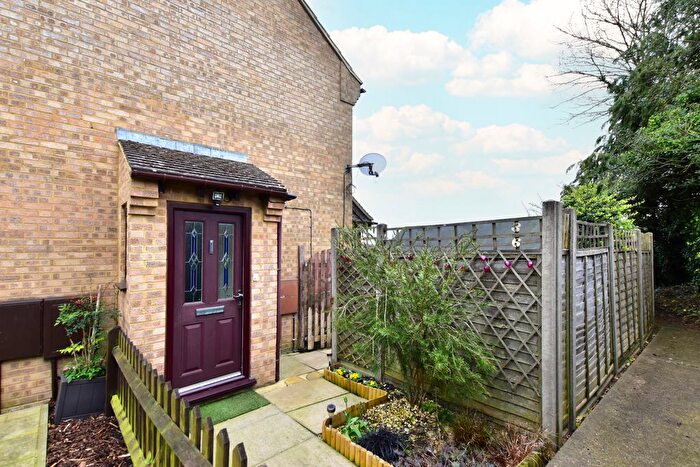
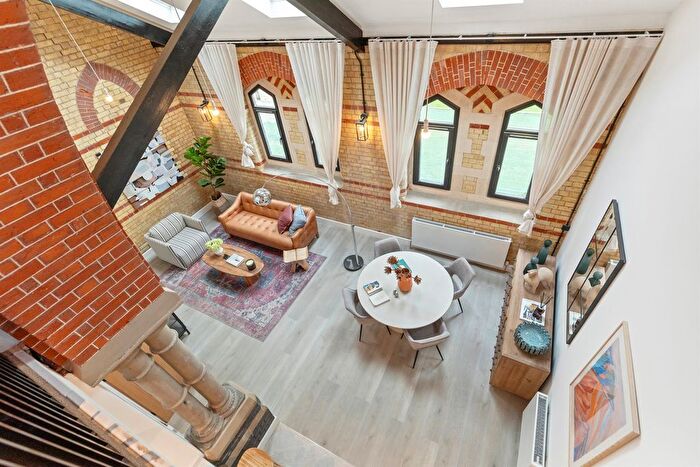
![]()
If you are looking to sell your house, let it out, or receive a property valuation, an expert can help you.
Click the button below to get started.

Neighbourhoods in Abbots Langley
Navigate through our locations to find the location of your next house in Abbots Langley, Hertfordshire for sale or to rent.
Transport in Abbots Langley
Please see below transportation links in this area:
-
 King's Langley Station
 -
Garston (Hertfordshire) Station
-
Watford North Station
-
Bricket Wood Station
-
Apsley Station
-
 Watford Junction Station
- FAQ
- Price Paid By Year
- Property Type Price
Frequently asked questions about Abbots Langley
What is the average price for a property for sale in Abbots Langley?
The average price for a property for sale in Abbots Langley is £502,010. This amount is 6% lower than the average price in Hertfordshire. There are 2,028 property listings for sale in Abbots Langley.
What locations have the most expensive properties for sale in Abbots Langley?
The locations with the most expensive properties for sale in Abbots Langley are Gade Valley at an average of £562,477 and Abbots Langley And Bedmond at an average of £544,985.
What locations have the most affordable properties for sale in Abbots Langley?
The locations with the most affordable properties for sale in Abbots Langley are Leavesden at an average of £435,526 and St Stephen at an average of £500,000.
Which train stations are available in or near Abbots Langley?
Some of the train stations available in or near Abbots Langley are King's Langley, Garston (Hertfordshire) and Watford North.
Property Price Paid in Abbots Langley by Year
The average sold property price by year was:
| Year | Average Sold Price | Price Change |
Sold Properties
|
|---|---|---|---|
| 2026 | £730,000 | 30% |
1 Property |
| 2025 | £512,578 | 4% |
138 Properties |
| 2024 | £493,923 | -1% |
156 Properties |
| 2023 | £498,182 | -7% |
111 Properties |
| 2022 | £535,095 | 11% |
150 Properties |
| 2021 | £474,668 | 2% |
192 Properties |
| 2020 | £467,037 | 8% |
155 Properties |
| 2019 | £428,136 | -5% |
145 Properties |
| 2018 | £447,872 | -0,1% |
153 Properties |
| 2017 | £448,499 | 5% |
154 Properties |
| 2016 | £426,162 | 6% |
157 Properties |
| 2015 | £400,038 | 16% |
224 Properties |
| 2014 | £337,704 | 10% |
210 Properties |
| 2013 | £305,080 | 8% |
192 Properties |
| 2012 | £281,710 | -1% |
173 Properties |
| 2011 | £285,018 | 2% |
175 Properties |
| 2010 | £278,348 | 5% |
147 Properties |
| 2009 | £265,574 | -5% |
111 Properties |
| 2008 | £278,407 | -7% |
148 Properties |
| 2007 | £296,507 | 10% |
313 Properties |
| 2006 | £265,944 | 9% |
264 Properties |
| 2005 | £241,441 | 1% |
222 Properties |
| 2004 | £237,923 | 14% |
273 Properties |
| 2003 | £204,342 | 7% |
314 Properties |
| 2002 | £189,373 | 13% |
322 Properties |
| 2001 | £164,475 | 15% |
290 Properties |
| 2000 | £139,581 | 11% |
254 Properties |
| 1999 | £124,021 | 4% |
309 Properties |
| 1998 | £118,837 | 10% |
269 Properties |
| 1997 | £106,795 | 7% |
447 Properties |
| 1996 | £98,966 | 12% |
368 Properties |
| 1995 | £87,067 | - |
254 Properties |
Property Price per Property Type in Abbots Langley
Here you can find historic sold price data in order to help with your property search.
The average Property Paid Price for specific property types in the last three years are:
| Property Type | Average Sold Price | Sold Properties |
|---|---|---|
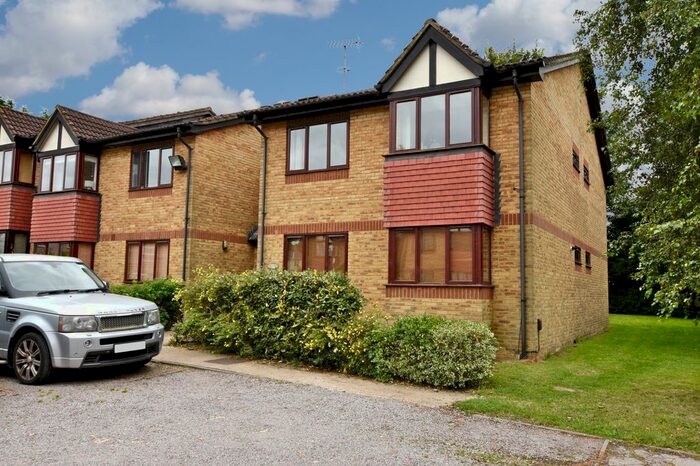
| Flat | £250,615.00 | 78 Flats |
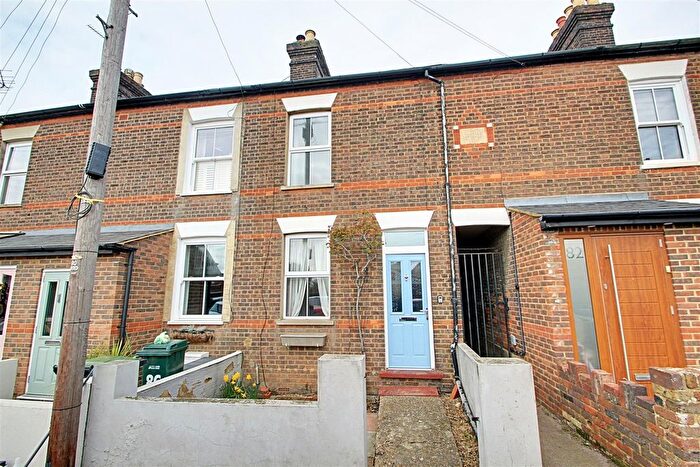
| Semi Detached House | £540,716.00 | 112 Semi Detached Houses |
| Detached House | £858,708.00 | 73 Detached Houses |
| Terraced House | £426,728.00 | 143 Terraced Houses |