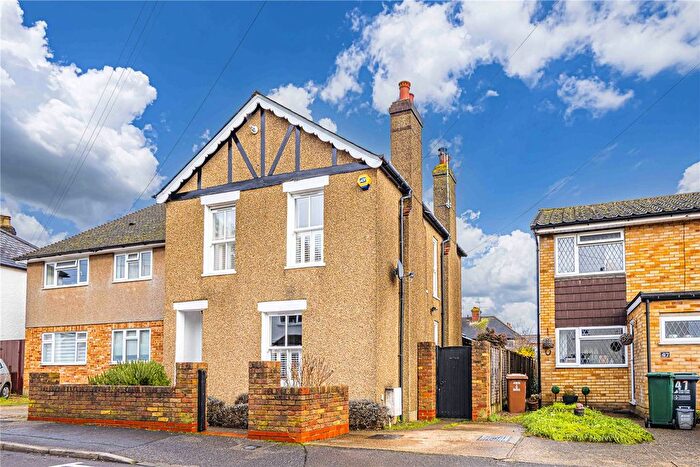
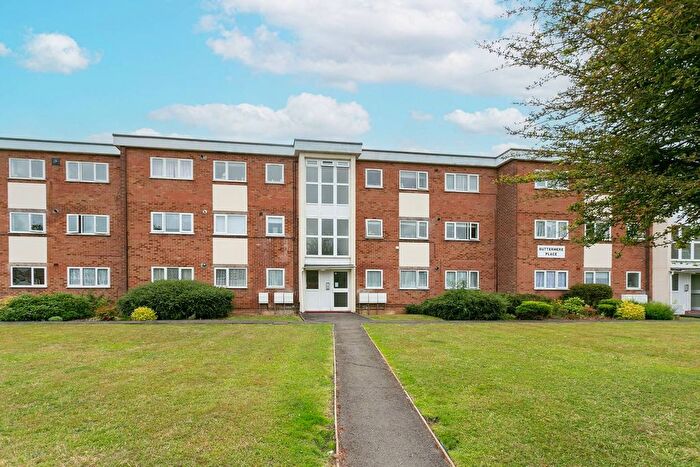
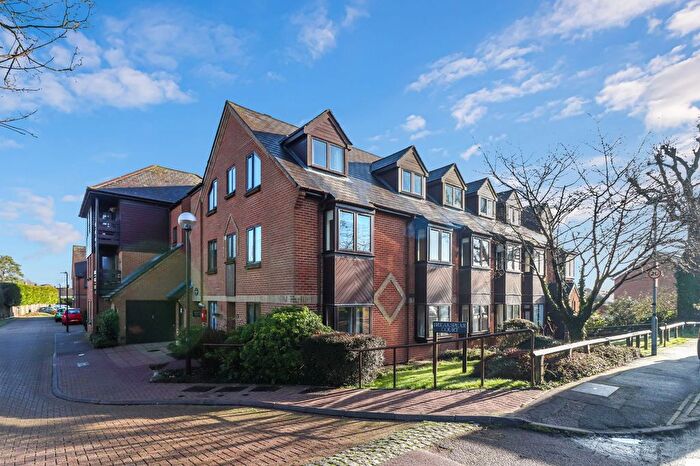
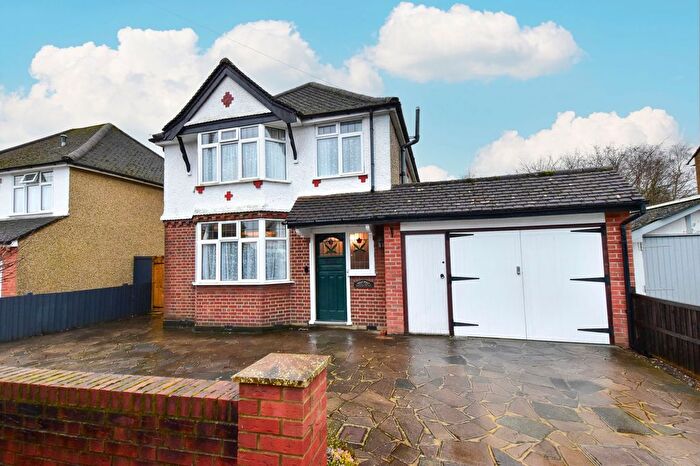
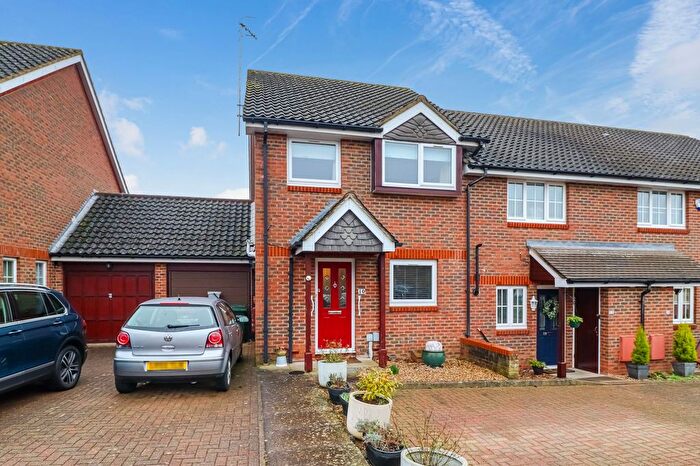
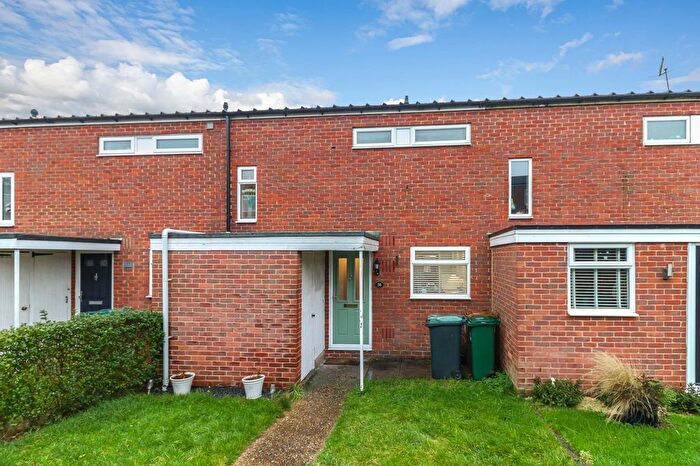
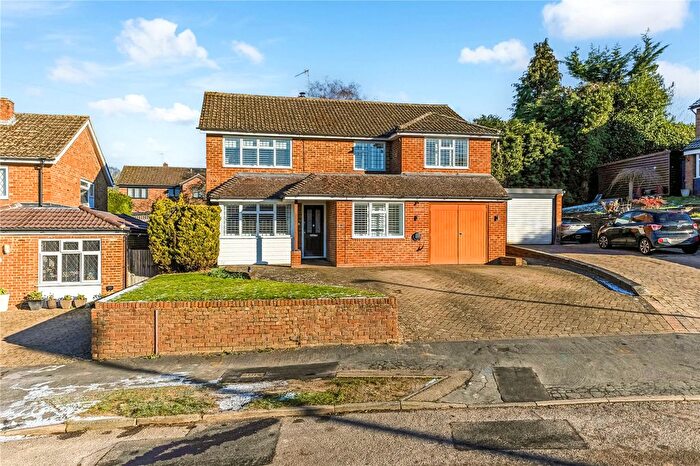
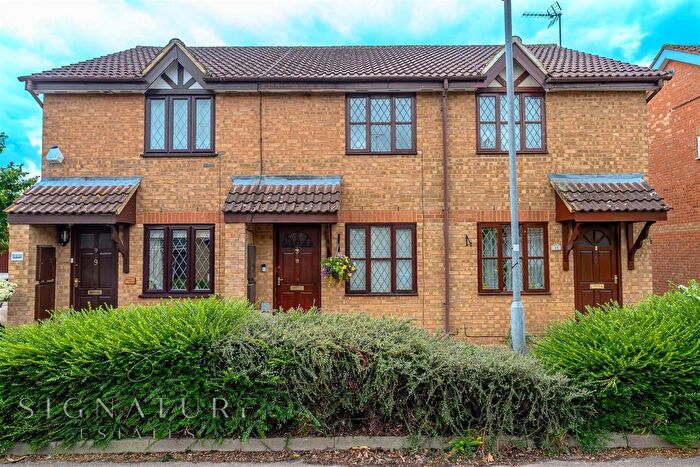
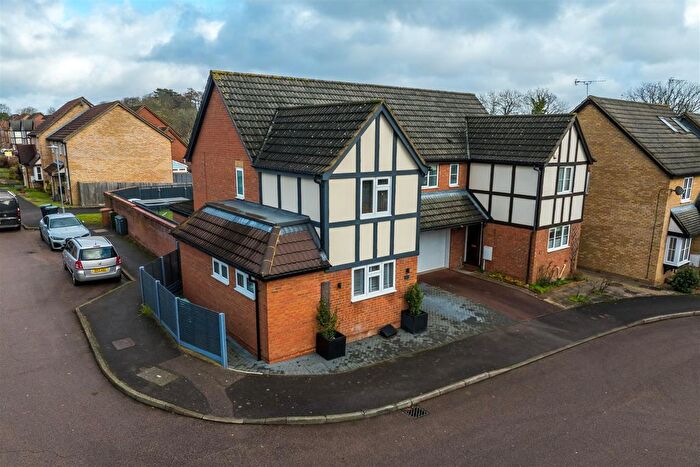
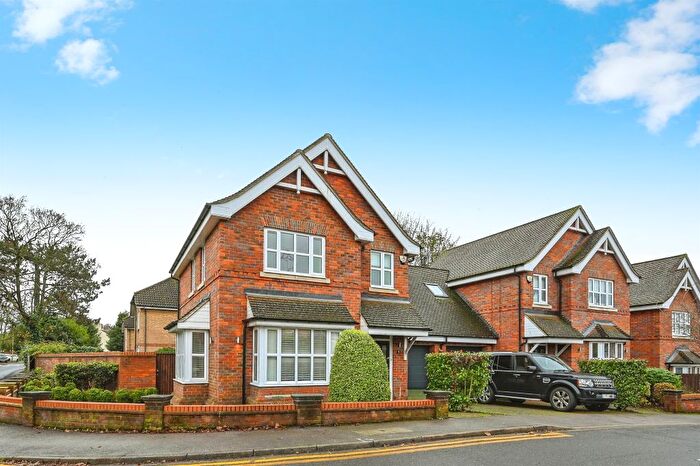
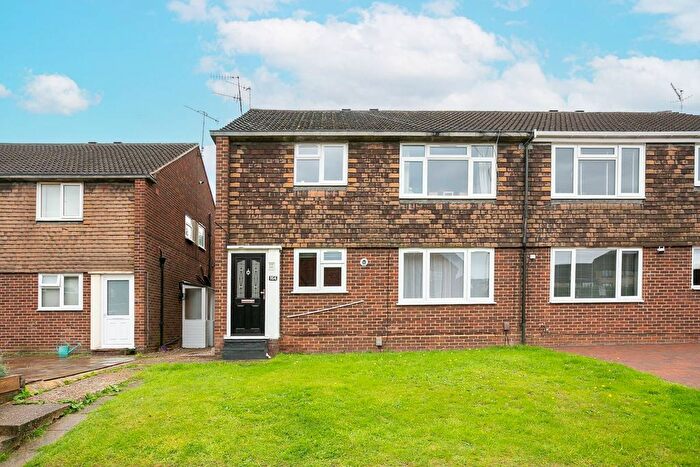
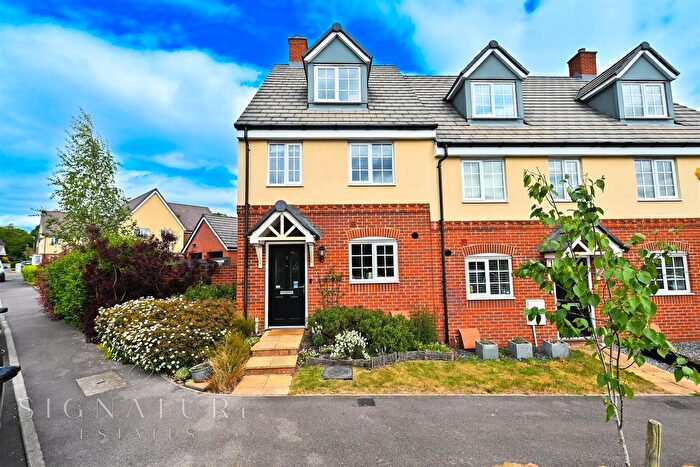
Houses for sale & to rent in Leavesden, Abbots Langley
House Prices in Leavesden
Properties in Leavesden have an average house price of £433,741.00 and had 163 Property Transactions within the last 3 years¹.
Leavesden is an area in Abbots Langley, Hertfordshire with 1,303 households², where the most expensive property was sold for £1,228,500.00.
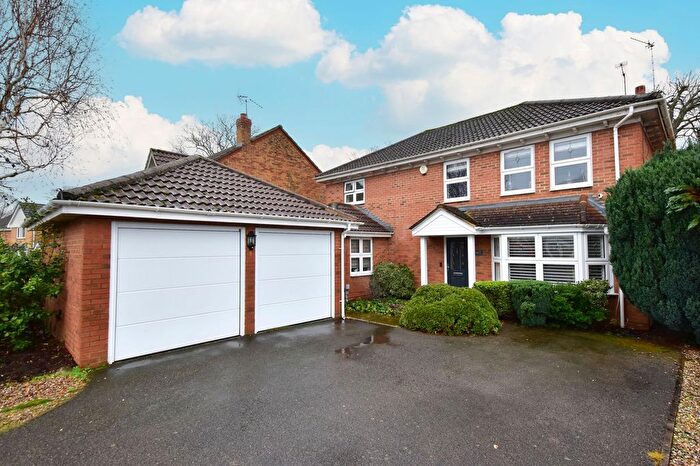
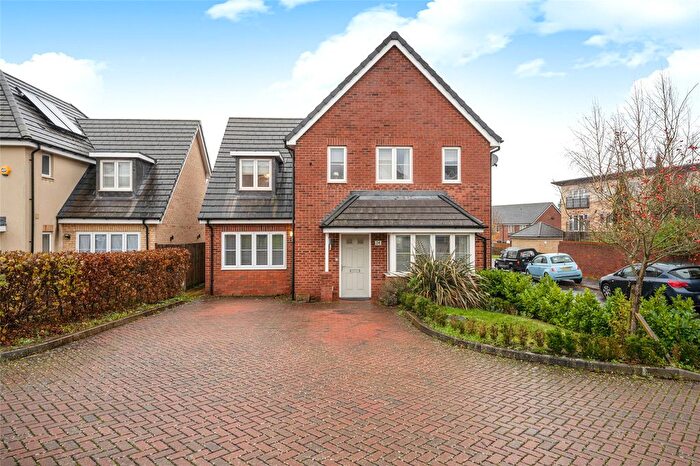
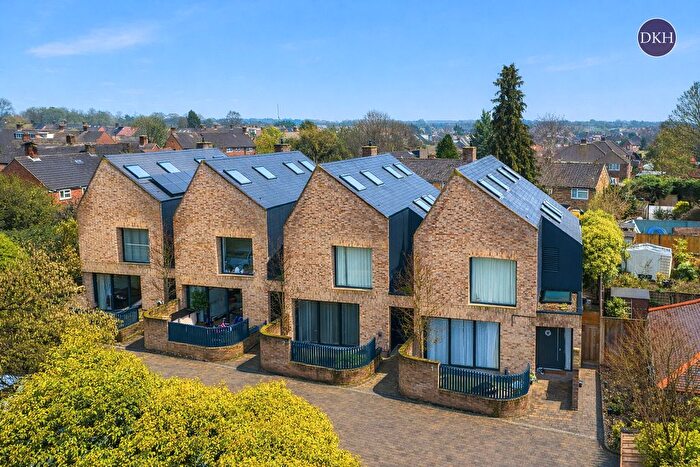
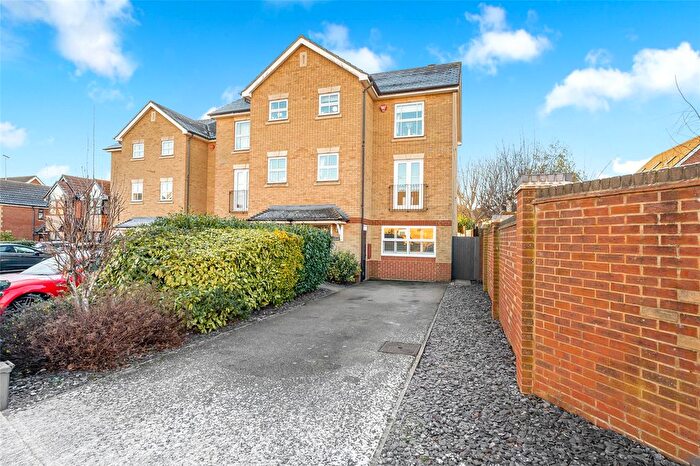
Properties for sale in Leavesden
Previously listed properties in Leavesden
Roads and Postcodes in Leavesden
Navigate through our locations to find the location of your next house in Leavesden, Abbots Langley for sale or to rent.
| Streets | Postcodes |
|---|---|
| Abbey Drive | WD5 0TL |
| Arundel Road | WD5 0TP |
| Balmoral Road | WD5 0ST |
| Berkeley Close | WD5 0XA WD5 0XB WD5 0XD |
| Blenheim Road | WD5 0TG |
| Cardiff Way | WD5 0TT |
| College Road | WD5 0NX WD5 0GU WD5 0NS |
| De Havilland Way | WD5 0XF WD5 0XG |
| East Lane | WD5 0NY |
| Edinburgh Drive | WD5 0TU |
| Furtherfield | WD5 0PL WD5 0PN |
| Glenmore Gardens | WD5 0SN |
| Harlech Road | WD5 0BD WD5 0BE WD5 0BF |
| Hawthorn Close | WD5 0SR |
| Heather Close | WD5 0SS |
| Helston Place | WD5 0NB |
| Hurricane Way | WD5 0TF |
| Katherine Place | WD5 0BT |
| Keble Terrace | WD5 0NG |
| Lancaster Way | WD5 0PQ |
| Langley Lane | WD5 0LR WD5 0LS WD5 0LX WD5 0LY |
| Lapwing Way | WD5 0GG |
| Linnet Road | WD5 0GN |
| Lysander Way | WD5 0TN |
| Magnolia Avenue | WD5 0SW |
| Mallard Road | WD5 0GA WD5 0GD WD5 0GE WD5 0GF WD5 0GT WD5 0GQ |
| Maple Leaf Close | WD5 0SP |
| Margaret Close | WD5 0NN WD5 0NW |
| Mitchell Close | WD5 0TQ |
| Nightingale Close | WD5 0GL |
| Oriole Close | WD5 0GH |
| Peacock Walk | WD5 0GP |
| Pegasus Court | WD5 0XE |
| Pryor Close | WD5 0NA |
| Queens Drive | WD5 0NQ WD5 0PR WD5 0PU |
| Redwing Grove | WD5 0GJ |
| Shackleton Way | WD5 0TJ |
| Shirley Road | WD5 0ND WD5 0NE WD5 0NF WD5 0NJ WD5 0NL WD5 0PP |
| South Way | WD5 0GZ |
| Stewart Close | WD5 0JW WD5 0LU WD5 0NU |
| Stirling Way | WD5 0TS |
| Swallows Oak | WD5 0LF |
| Tanners Hill | WD5 0LT |
| The Hideaway | WD5 0NR |
| Wadham Road | WD5 0NH |
| Whitley Close | WD5 0TH |
| Woodside Road | WD5 0FR WD5 0HT |
| WD5 0NP |
Transport near Leavesden
-
King's Langley Station
-
Garston (Hertfordshire) Station
-
Watford North Station
-
Bricket Wood Station
-
Watford Junction Station
- FAQ
- Price Paid By Year
- Property Type Price
Frequently asked questions about Leavesden
What is the average price for a property for sale in Leavesden?
The average price for a property for sale in Leavesden is £433,741. This amount is 13% lower than the average price in Abbots Langley. There are 828 property listings for sale in Leavesden.
What streets have the most expensive properties for sale in Leavesden?
The streets with the most expensive properties for sale in Leavesden are South Way at an average of £894,550, Lysander Way at an average of £771,666 and Oriole Close at an average of £737,500.
What streets have the most affordable properties for sale in Leavesden?
The streets with the most affordable properties for sale in Leavesden are Shirley Road at an average of £240,312, Swallows Oak at an average of £285,333 and Lancaster Way at an average of £298,500.
Which train stations are available in or near Leavesden?
Some of the train stations available in or near Leavesden are King's Langley, Garston (Hertfordshire) and Watford North.
Property Price Paid in Leavesden by Year
The average sold property price by year was:
| Year | Average Sold Price | Price Change |
Sold Properties
|
|---|---|---|---|
| 2025 | £422,217 | -2% |
58 Properties |
| 2024 | £431,951 | -5% |
62 Properties |
| 2023 | £451,866 | 1% |
43 Properties |
| 2022 | £447,220 | 13% |
51 Properties |
| 2021 | £388,197 | 4% |
60 Properties |
| 2020 | £372,505 | -1% |
43 Properties |
| 2019 | £377,260 | -5% |
49 Properties |
| 2018 | £394,464 | -9% |
56 Properties |
| 2017 | £428,191 | 14% |
63 Properties |
| 2016 | £368,905 | -8% |
67 Properties |
| 2015 | £397,730 | 26% |
108 Properties |
| 2014 | £293,657 | 8% |
82 Properties |
| 2013 | £268,770 | 9% |
69 Properties |
| 2012 | £244,231 | 3% |
72 Properties |
| 2011 | £237,929 | -10% |
51 Properties |
| 2010 | £261,413 | 16% |
55 Properties |
| 2009 | £220,176 | -18% |
45 Properties |
| 2008 | £260,661 | -4% |
50 Properties |
| 2007 | £269,868 | 14% |
111 Properties |
| 2006 | £230,832 | 4% |
99 Properties |
| 2005 | £221,996 | 2% |
86 Properties |
| 2004 | £217,695 | 18% |
119 Properties |
| 2003 | £178,986 | -0,4% |
155 Properties |
| 2002 | £179,785 | 12% |
145 Properties |
| 2001 | £158,278 | 16% |
126 Properties |
| 2000 | £133,664 | 20% |
124 Properties |
| 1999 | £106,849 | -4% |
144 Properties |
| 1998 | £110,933 | 3% |
123 Properties |
| 1997 | £107,274 | 4% |
292 Properties |
| 1996 | £102,801 | 15% |
226 Properties |
| 1995 | £87,387 | - |
136 Properties |
Property Price per Property Type in Leavesden
Here you can find historic sold price data in order to help with your property search.
The average Property Paid Price for specific property types in the last three years are:
| Property Type | Average Sold Price | Sold Properties |
|---|---|---|
| Semi Detached House | £500,597.00 | 23 Semi Detached Houses |
| Detached House | £764,505.00 | 19 Detached Houses |
| Terraced House | £414,611.00 | 85 Terraced Houses |
| Flat | £261,625.00 | 36 Flats |

