
Houses for sale in Berkhamsted, Hertfordshire
House Prices in Berkhamsted
Properties in Berkhamsted have an average house price of £747k and had 1,085 Property Transactions within the last 3 years.¹
Berkhamsted is an area in Hertfordshire with 10,173 households², where the most expensive property was sold for £3.93M.
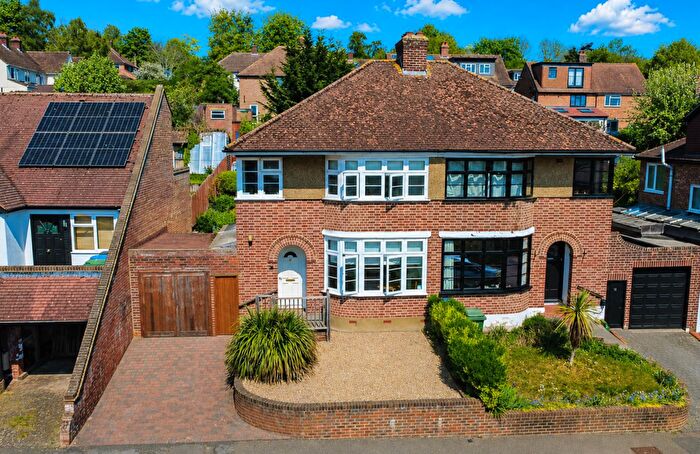
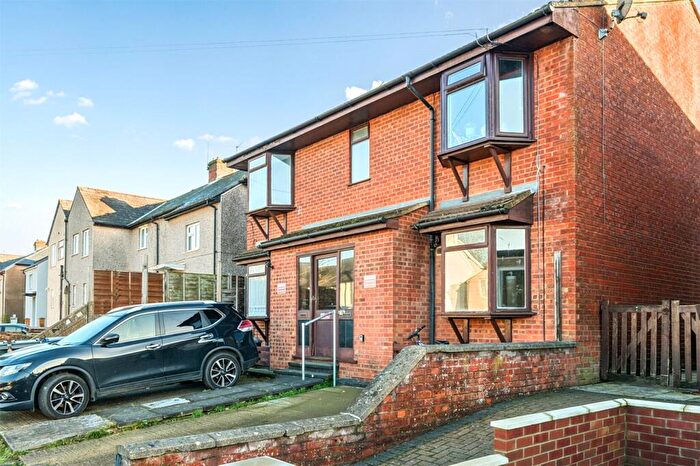
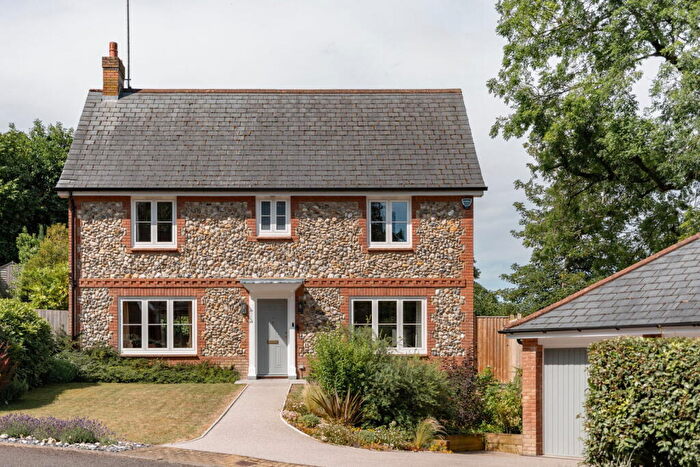
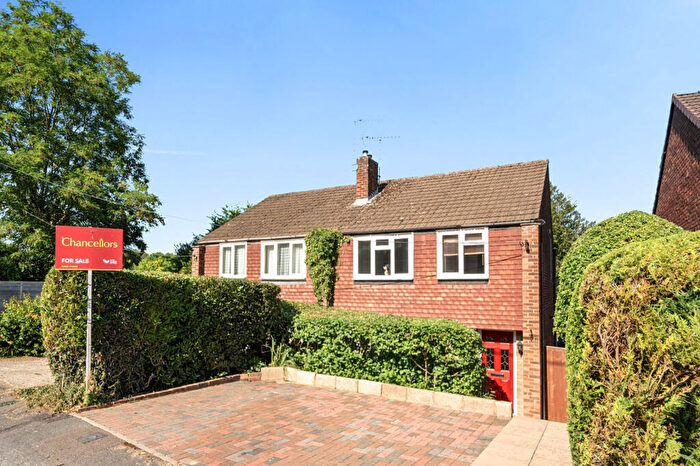
Properties for sale in Berkhamsted
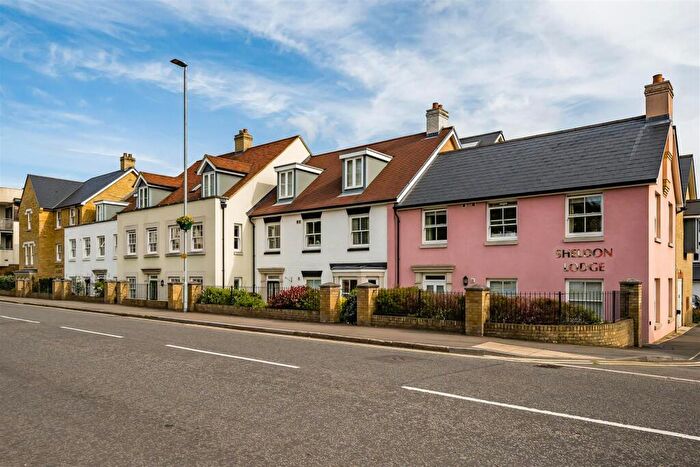
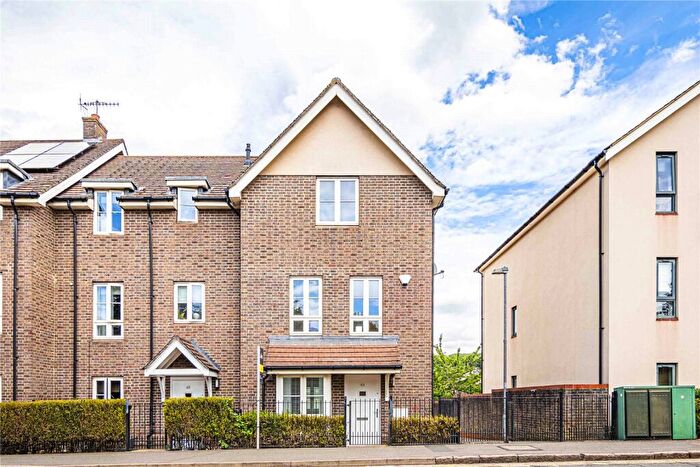
![]()
If you are looking to sell your house, let it out, or receive a property valuation, an expert can help you.
Click the button below to get started.
Neighbourhoods in Berkhamsted
Navigate through our locations to find the location of your next house in Berkhamsted, Hertfordshire for sale or to rent.
Property price trends in Berkhamsted
According to the latest Land Registry data, the average home in Berkhamsted sold for £725,609 in 2026. That figure comes from a substantial record of 15,523 sales logged over the past 31 years.
Prices have softened over the last three years. Compared with 2023, when the typical sale came in around £767,856, that's a fall of roughly 5.5%.
Looking back five years, average prices are up about 0.1% since 2021, a gain of around £894 in cash terms.
Zoom out to the past decade for the fuller picture. Back in 2016, homes here averaged £624,732, so the typical sold price has climbed about 16.1% since then, roughly 1.5% a year. Stretch the view to fifteen years and that annual pace edges up closer to 3.2%.
Frequently asked questions about Berkhamsted
What is the average price for a property for sale in Berkhamsted?
The average price for a property for sale in Berkhamsted is £746,803. This amount is 40% higher than the average price in Hertfordshire. There are 4,411 property listings for sale in Berkhamsted.
What locations have the most expensive properties for sale in Berkhamsted?
The locations with the most expensive properties for sale in Berkhamsted are Tring East at an average of £1,490,000, Ashridge at an average of £1,225,824 and Berkhamsted West at an average of £799,822.
What locations have the most affordable properties for sale in Berkhamsted?
The locations with the most affordable properties for sale in Berkhamsted are Northchurch at an average of £577,202, Berkhamsted Castle at an average of £707,142 and Berkhamsted East at an average of £708,468.
Which train stations are available in or near Berkhamsted?
Some of the train stations available in or near Berkhamsted are Berkhamsted, Tring and Hemel Hempstead.
Which tube stations are available in or near Berkhamsted?
The tube station available in or near Berkhamsted is Chesham.
Property Price Paid in Berkhamsted by Year
The average sold property price by year was:
| Year | Average Sold Price | Price Change |
Sold Properties
|
|---|---|---|---|
| 2026 | £725,609 | -2% |
33 Properties |
| 2025 | £740,453 | 1% |
319 Properties |
| 2024 | £736,481 | -4% |
405 Properties |
| 2023 | £767,856 | 3% |
328 Properties |
| 2022 | £744,965 | 3% |
413 Properties |
| 2021 | £724,715 | -5% |
539 Properties |
| 2020 | £760,373 | 13% |
355 Properties |
| 2019 | £658,088 | -3% |
340 Properties |
| 2018 | £680,610 | 4% |
398 Properties |
| 2017 | £653,280 | 4% |
485 Properties |
Property Price per Property Type in Berkhamsted
Here you can find historic sold price data in order to help with your property search.
The average Property Paid Price for specific property types in the last three years are:
| Property Type | Average Sold Price | Sold Properties |
|---|---|---|
| Semi Detached House | £726,307.00 | 234 Semi Detached Houses |
| Detached House | £1,221,375.00 | 292 Detached Houses |
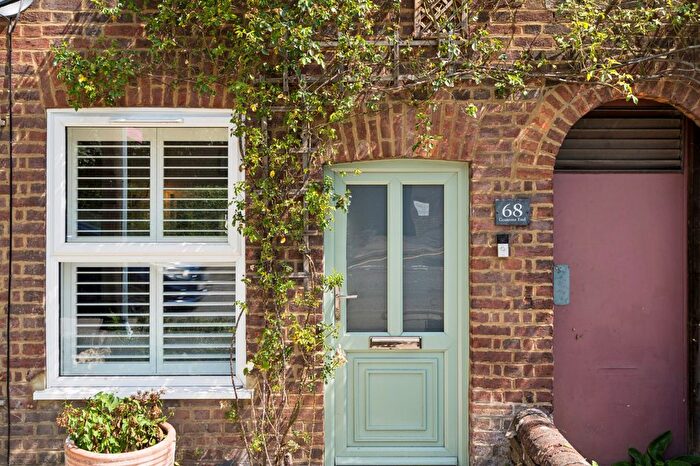
| Terraced House | £617,007.00 | 297 Terraced Houses |
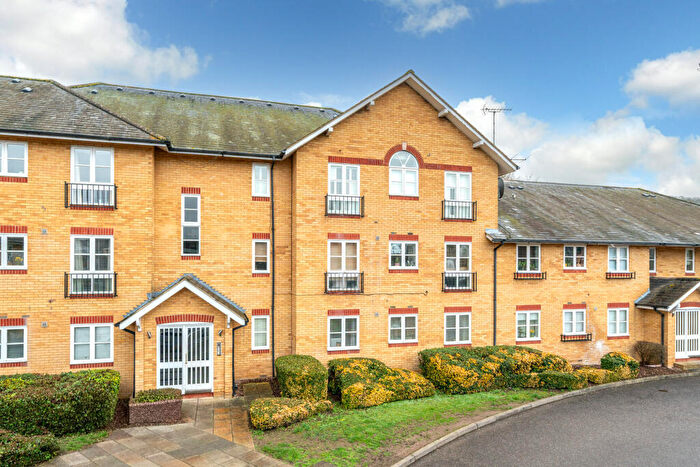
| Flat | £383,332.00 | 262 Flats |
Transport in Berkhamsted
Please see below transportation links in this area:

