
Houses for sale & to rent in Borehamwood Brookmeadow, Borehamwood
House Prices in Borehamwood Brookmeadow
Properties in Borehamwood Brookmeadow have an average house price of £445,483.00 and had 213 Property Transactions within the last 3 years¹.
Borehamwood Brookmeadow is an area in Borehamwood, Hertfordshire with 3,191 households², where the most expensive property was sold for £1,075,000.00.
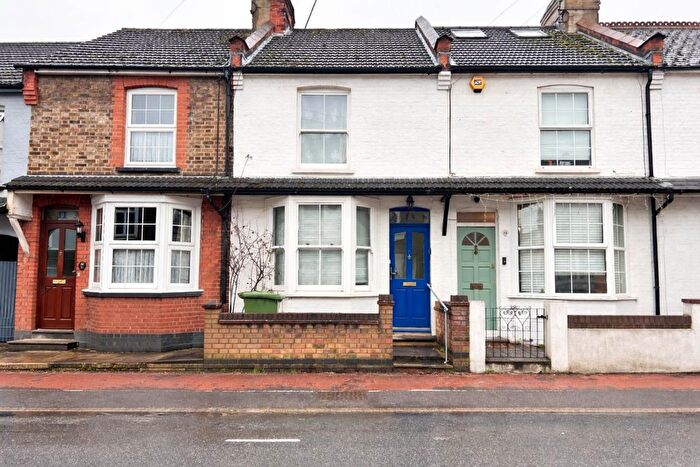
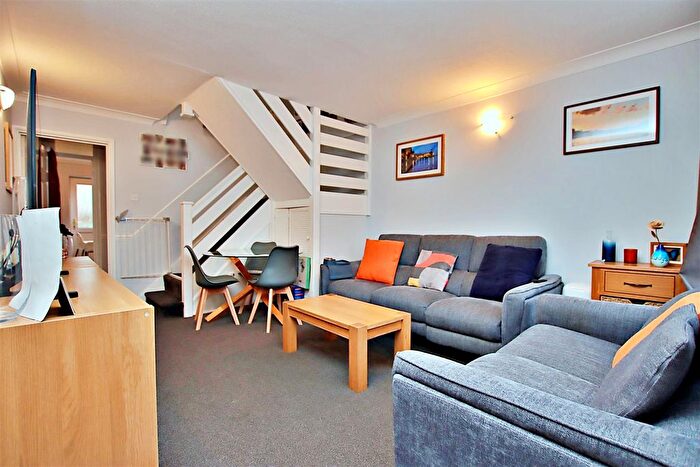
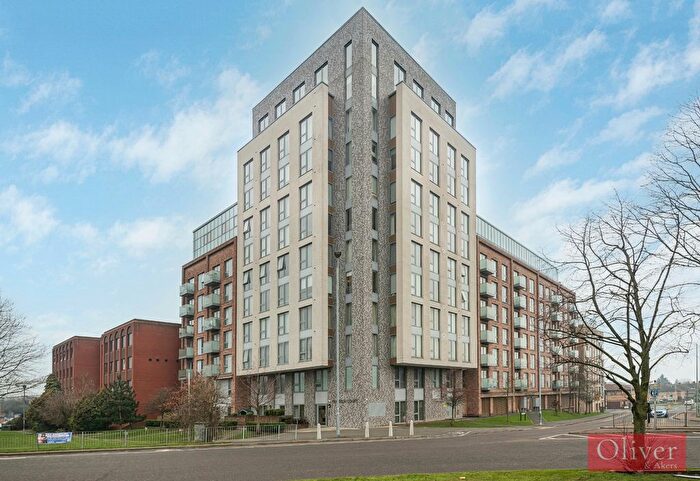
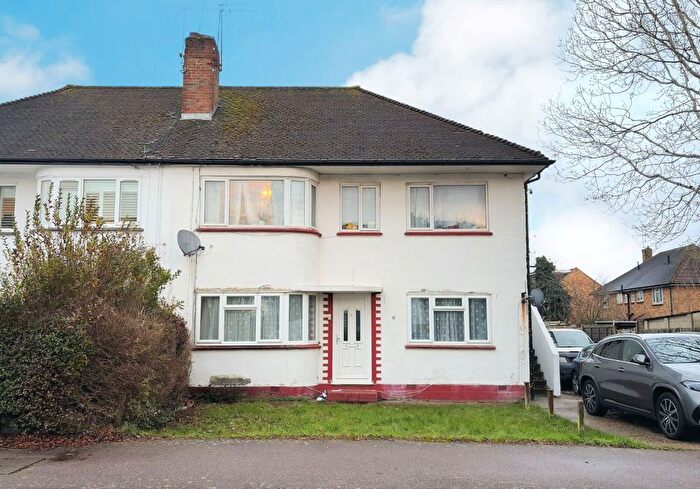
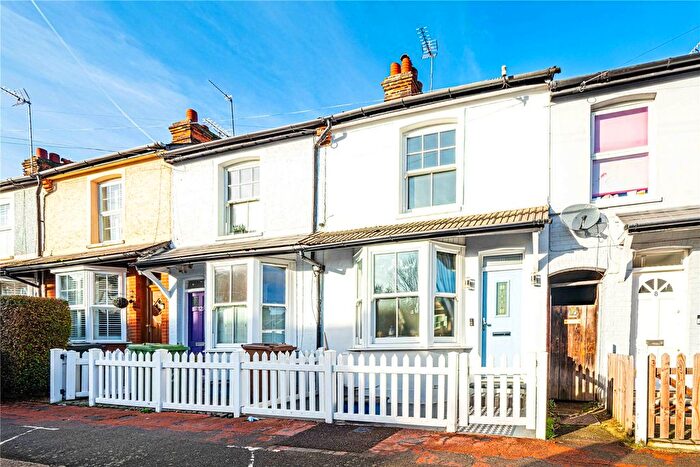
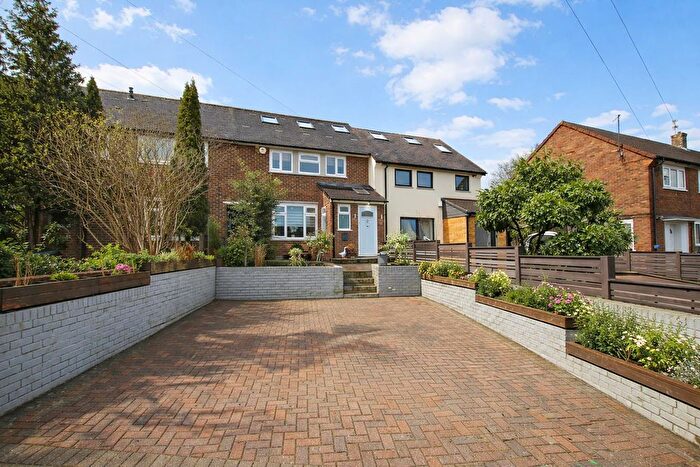
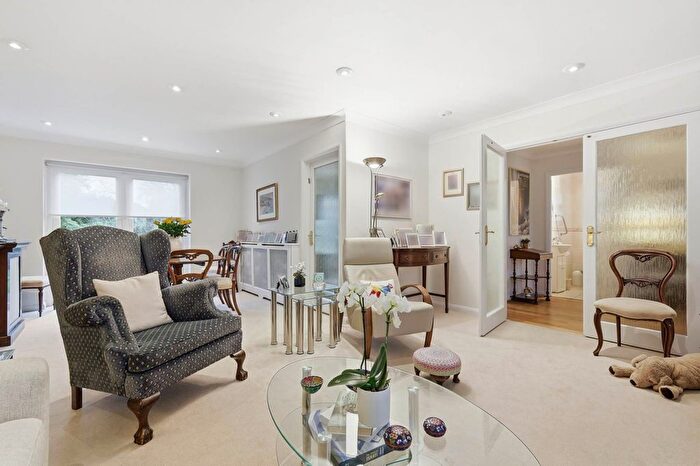
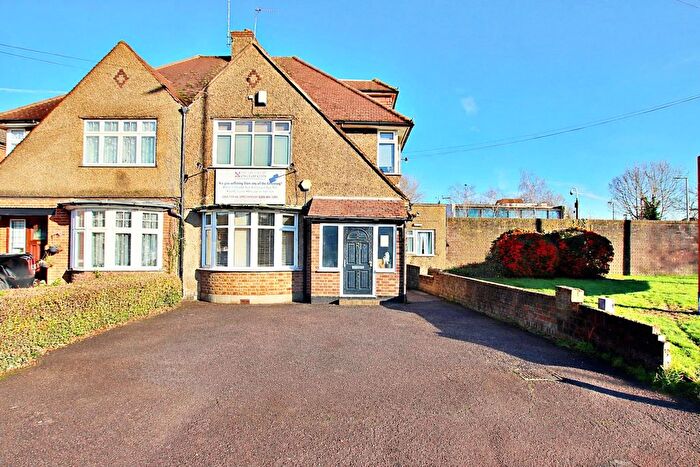
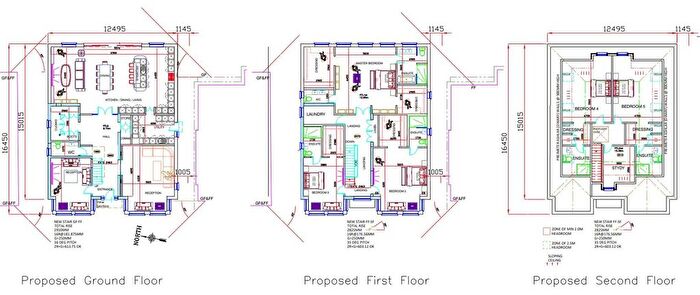
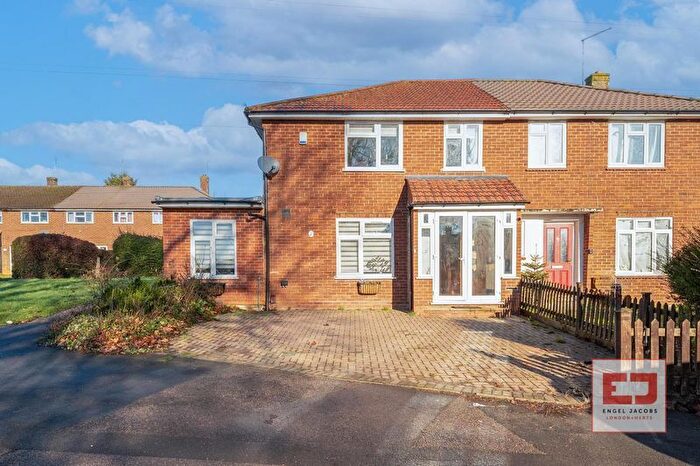
Properties for sale in Borehamwood Brookmeadow
![]()
If you are looking to sell your house, let it out, or receive a property valuation, an expert can help you.
Click the button below to get started.


Roads and Postcodes in Borehamwood Brookmeadow
Navigate through our locations to find the location of your next house in Borehamwood Brookmeadow, Borehamwood for sale or to rent.
Transport near Borehamwood Brookmeadow


- FAQ
- Price Paid By Year
- Property Type Price
Frequently asked questions about Borehamwood Brookmeadow
What is the average price for a property for sale in Borehamwood Brookmeadow?
The average price for a property for sale in Borehamwood Brookmeadow is £445,483. This amount is 16% lower than the average price in Borehamwood. There are 1,358 property listings for sale in Borehamwood Brookmeadow.
What streets have the most expensive properties for sale in Borehamwood Brookmeadow?
The streets with the most expensive properties for sale in Borehamwood Brookmeadow are Anthony Road at an average of £716,283, Kingsley Avenue at an average of £680,000 and Sinderby Close at an average of £630,000.
What streets have the most affordable properties for sale in Borehamwood Brookmeadow?
The streets with the most affordable properties for sale in Borehamwood Brookmeadow are Canterbury Road at an average of £205,000, Brook Road at an average of £306,187 and Ashdown Drive at an average of £311,111.
Which train stations are available in or near Borehamwood Brookmeadow?
Some of the train stations available in or near Borehamwood Brookmeadow are Elstree and Borehamwood and Radlett.
Which tube stations are available in or near Borehamwood Brookmeadow?
The tube station available in or near Borehamwood Brookmeadow is Stanmore.
Property Price Paid in Borehamwood Brookmeadow by Year
The average sold property price by year was:
| Year | Average Sold Price | Price Change |
Sold Properties
|
|---|---|---|---|
| 2025 | £434,845 | -6% |
60 Properties |
| 2024 | £461,948 | 5% |
76 Properties |
| 2023 | £437,522 | -7% |
77 Properties |
| 2022 | £469,044 | 8% |
88 Properties |
| 2021 | £433,337 | 4% |
150 Properties |
| 2020 | £418,137 | 9% |
60 Properties |
| 2019 | £379,532 | -2% |
135 Properties |
| 2018 | £385,434 | -1% |
132 Properties |
| 2017 | £387,645 | -15% |
158 Properties |
| 2016 | £444,639 | 18% |
110 Properties |
| 2015 | £362,475 | 7% |
121 Properties |
| 2014 | £336,637 | 14% |
107 Properties |
| 2013 | £291,029 | 16% |
100 Properties |
| 2012 | £243,540 | -6% |
77 Properties |
| 2011 | £257,553 | 7% |
80 Properties |
| 2010 | £238,334 | - |
97 Properties |
| 2009 | £238,262 | 2% |
86 Properties |
| 2008 | £234,536 | -10% |
96 Properties |
| 2007 | £258,724 | 8% |
202 Properties |
| 2006 | £238,436 | 11% |
209 Properties |
| 2005 | £212,683 | 1% |
139 Properties |
| 2004 | £209,763 | 4% |
159 Properties |
| 2003 | £200,997 | 15% |
146 Properties |
| 2002 | £171,578 | 18% |
161 Properties |
| 2001 | £141,327 | 2% |
137 Properties |
| 2000 | £137,871 | 11% |
144 Properties |
| 1999 | £123,387 | 6% |
144 Properties |
| 1998 | £115,643 | 29% |
126 Properties |
| 1997 | £82,594 | 15% |
124 Properties |
| 1996 | £69,971 | -8% |
122 Properties |
| 1995 | £75,451 | - |
82 Properties |
Property Price per Property Type in Borehamwood Brookmeadow
Here you can find historic sold price data in order to help with your property search.
The average Property Paid Price for specific property types in the last three years are:
| Property Type | Average Sold Price | Sold Properties |
|---|---|---|
| Flat | £318,177.00 | 59 Flats |
| Semi Detached House | £559,968.00 | 32 Semi Detached Houses |
| Detached House | £731,250.00 | 8 Detached Houses |
| Terraced House | £459,181.00 | 114 Terraced Houses |