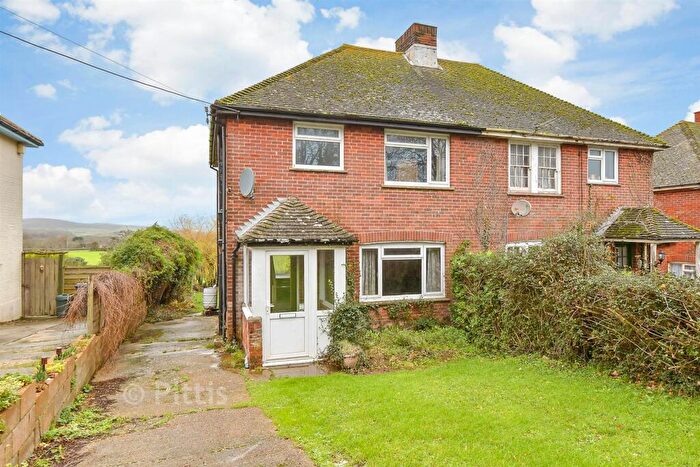
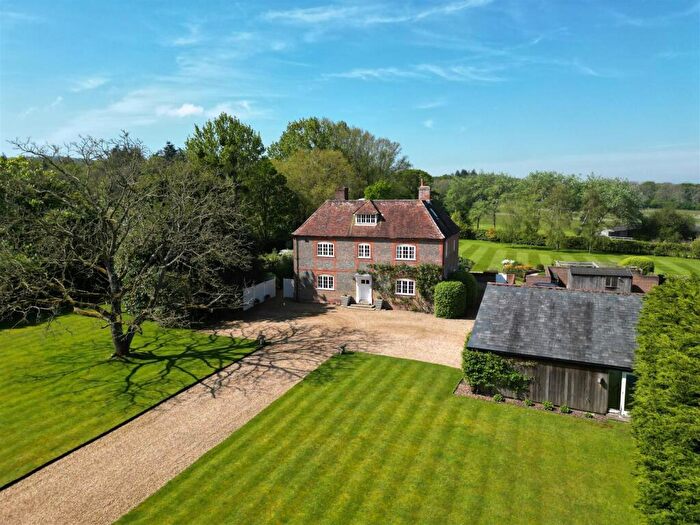
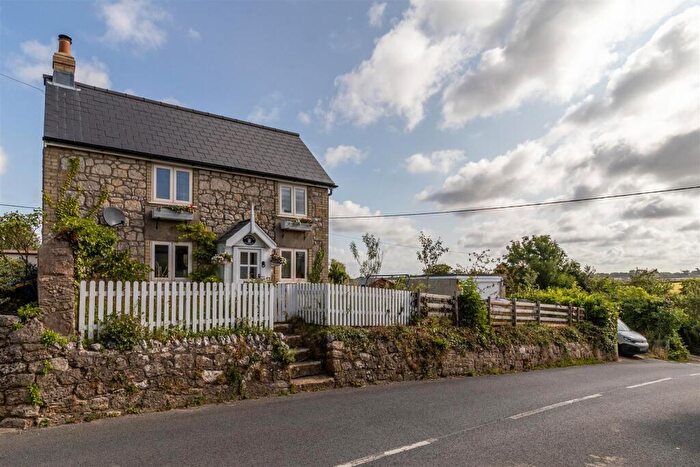
Houses for sale & to rent in West Wight, Newport
House Prices in West Wight
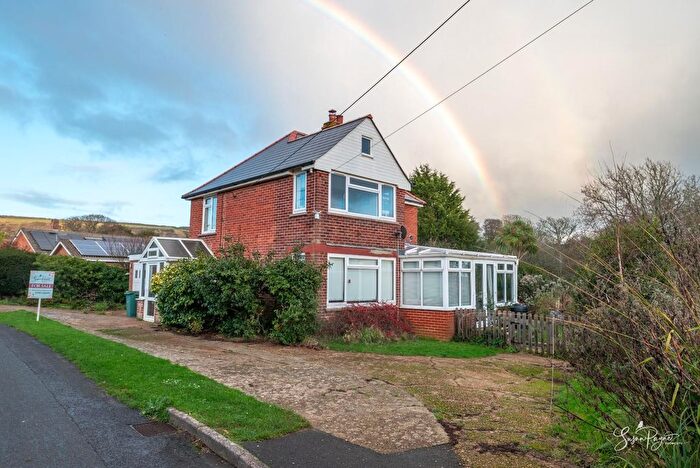
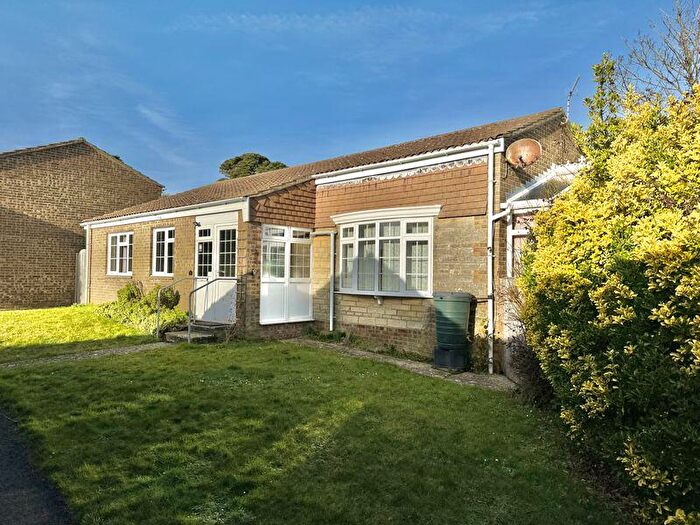
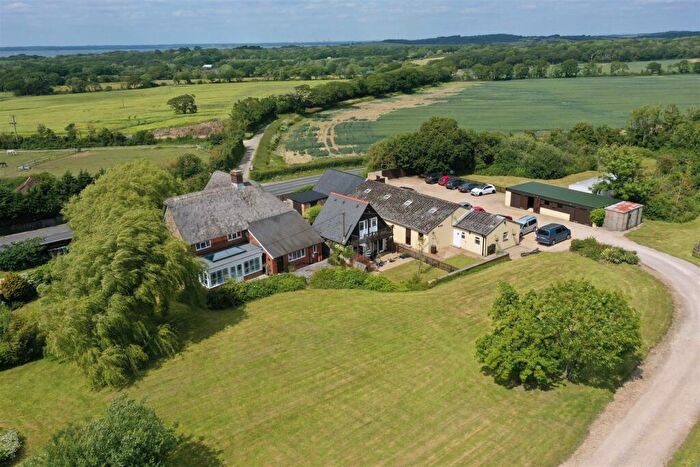
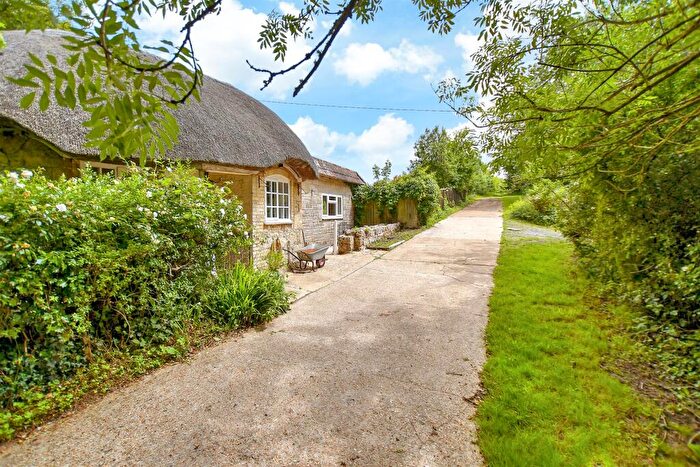
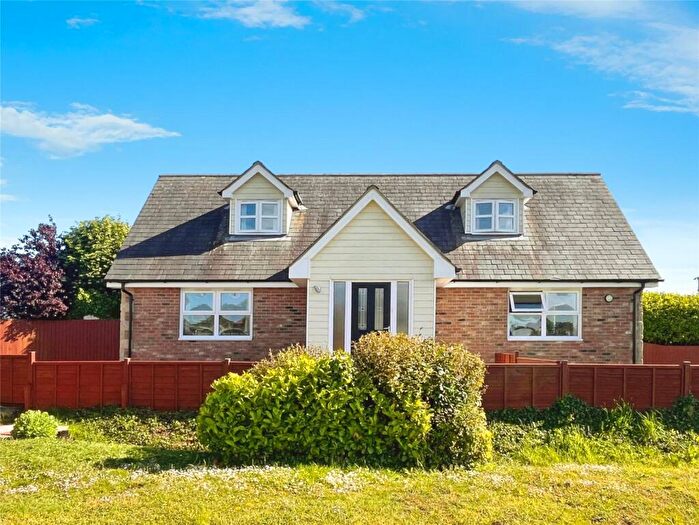
Properties in West Wight have an average house price of £367,337.00 and had 56 Property Transactions within the last 3 years¹.
West Wight is an area in Newport, Isle of Wight with 529 households², where the most expensive property was sold for £930,000.00.
Properties for sale in West Wight
Roads and Postcodes in West Wight
Navigate through our locations to find the location of your next house in West Wight, Newport for sale or to rent.
| Streets | Postcodes |
|---|---|
| Church Lane | PO30 4NF |
| Colemans Lane | PO30 4LX PO30 4PE |
| Corf Road | PO30 4NT |
| Elm Lane | PO30 4JS PO30 4JY PO30 4JZ |
| Elmsworth Lane | PO30 4LR |
| Five Houses Lane | PO30 4JT |
| Fleet Way | PO30 4PP PO30 4PR PO30 4PX |
| Gusters Shute | PO30 4PT |
| Hamstead Drive | PO30 4NR |
| Little Whitehouse Road | PO30 4LL |
| Locks Green | PO30 4PF |
| London Heath Cottages | PO30 4NX |
| Lynch Lane | PO30 4JQ PO30 4JH |
| Main Road | PO30 4LN PO30 4LP PO30 4LW PO30 4ND PO30 4NP PO30 4NW PO30 4NS |
| Manor Green | PO30 4QT |
| Marks Corner | PO30 5UD PO30 5UH |
| Mill Road | PO30 4NE |
| New Road | PO30 4LS PO30 4LT PO30 4LU |
| Newbridge Road | PO30 4QR |
| Newport Road | PO30 4JP |
| Old Road | PO30 4JR |
| Old Vicarage Lane | PO30 4NY |
| Porchfield Business Park | PO30 4QB |
| Porchfield Road | PO30 4NA PO30 4NU PO30 4PD |
| Pound Lane | PO30 4JU PO30 4JX |
| Pump Lane | PO30 4QP |
| Quarry Lane | PO30 4LA |
| School Lane | PO30 4JD |
| Scotts Close | PO30 4PS |
| St Michaels Close | PO30 4PH |
| Station Road | PO30 4NJ PO30 4NL PO30 4NN |
| Sun Hill | PO30 4JA |
| Swainston | PO30 4HU PO30 4HX |
| The Green | PO30 4JB PO30 4JE PO30 4JG |
| Warlands Lane | PO30 4NG PO30 4NH PO30 4NQ |
| Westover | PO30 4JW PO30 4JJ PO30 4JL PO30 4JN |
| Whitehouse Cross | PO30 4LG PO30 4LQ |
| Whiteoak Road | PO30 4DQ |
| Winkle Street | PO30 4JF |
| Withyfields | PO30 4QA |
| Yarmouth Road | PO30 4HZ PO30 4LZ PO30 4NB |
| PO30 4PA PO30 4NZ PO30 4PB |
Transport near West Wight
-
Lymington Pier Station
-
Lymington Town Station
-
Shanklin Station
-
Ryde Esplanade Station
-
Smallbrook Junction Station
-
Ryde St.John's Road Station
-
Sandown Station
-
Lake Station
-
Ryde Pier Head Station
-
Sway Station
- FAQ
- Price Paid By Year
- Property Type Price
Frequently asked questions about West Wight
What is the average price for a property for sale in West Wight?
The average price for a property for sale in West Wight is £367,337. This amount is 44% higher than the average price in Newport. There are 610 property listings for sale in West Wight.
What streets have the most expensive properties for sale in West Wight?
The streets with the most expensive properties for sale in West Wight are Warlands Lane at an average of £452,800, Little Whitehouse Road at an average of £409,000 and St Michaels Close at an average of £391,000.
What streets have the most affordable properties for sale in West Wight?
The streets with the most affordable properties for sale in West Wight are Porchfield Road at an average of £180,000, Marks Corner at an average of £267,500 and New Road at an average of £336,071.
Which train stations are available in or near West Wight?
Some of the train stations available in or near West Wight are Lymington Pier, Lymington Town and Shanklin.
Property Price Paid in West Wight by Year
The average sold property price by year was:
| Year | Average Sold Price | Price Change |
Sold Properties
|
|---|---|---|---|
| 2025 | £442,666 | 31% |
6 Properties |
| 2024 | £306,000 | -37% |
16 Properties |
| 2023 | £420,583 | 14% |
12 Properties |
| 2022 | £362,359 | -19% |
22 Properties |
| 2021 | £429,804 | 0,3% |
21 Properties |
| 2020 | £428,399 | 31% |
10 Properties |
| 2019 | £295,388 | -8% |
9 Properties |
| 2018 | £320,045 | -7% |
21 Properties |
| 2017 | £342,072 | 2% |
23 Properties |
| 2016 | £335,666 | 19% |
24 Properties |
| 2015 | £270,222 | -17% |
20 Properties |
| 2014 | £314,861 | 25% |
18 Properties |
| 2013 | £234,882 | -30% |
17 Properties |
| 2012 | £305,250 | -19% |
14 Properties |
| 2011 | £364,191 | 18% |
18 Properties |
| 2010 | £299,536 | -1% |
11 Properties |
| 2009 | £302,090 | -108% |
11 Properties |
| 2008 | £629,692 | 53% |
13 Properties |
| 2007 | £296,745 | 14% |
22 Properties |
| 2006 | £254,439 | 1% |
28 Properties |
| 2005 | £250,975 | 1% |
10 Properties |
| 2004 | £249,034 | 23% |
26 Properties |
| 2003 | £191,672 | -22% |
29 Properties |
| 2002 | £233,012 | 34% |
29 Properties |
| 2001 | £153,537 | -6% |
37 Properties |
| 2000 | £162,786 | 27% |
33 Properties |
| 1999 | £118,954 | 13% |
34 Properties |
| 1998 | £104,071 | 20% |
28 Properties |
| 1997 | £83,090 | 6% |
16 Properties |
| 1996 | £77,859 | -14% |
22 Properties |
| 1995 | £89,000 | - |
23 Properties |
Property Price per Property Type in West Wight
Here you can find historic sold price data in order to help with your property search.
The average Property Paid Price for specific property types in the last three years are:
| Property Type | Average Sold Price | Sold Properties |
|---|---|---|
| Semi Detached House | £341,722.00 | 9 Semi Detached Houses |
| Detached House | £400,642.00 | 38 Detached Houses |
| Terraced House | £252,333.00 | 9 Terraced Houses |

