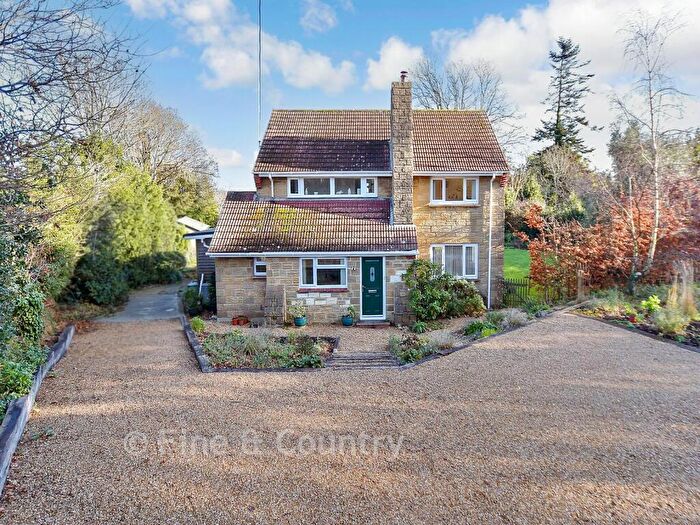
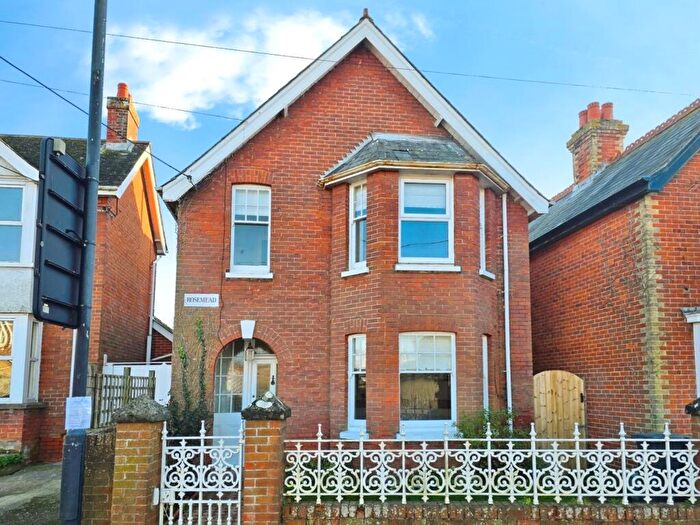
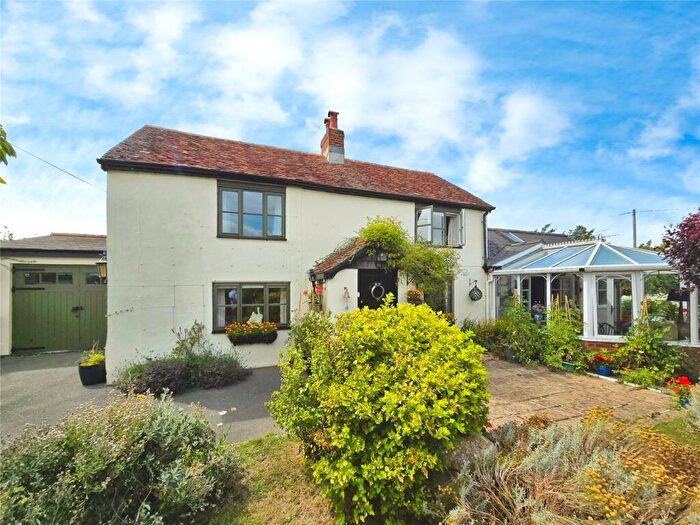
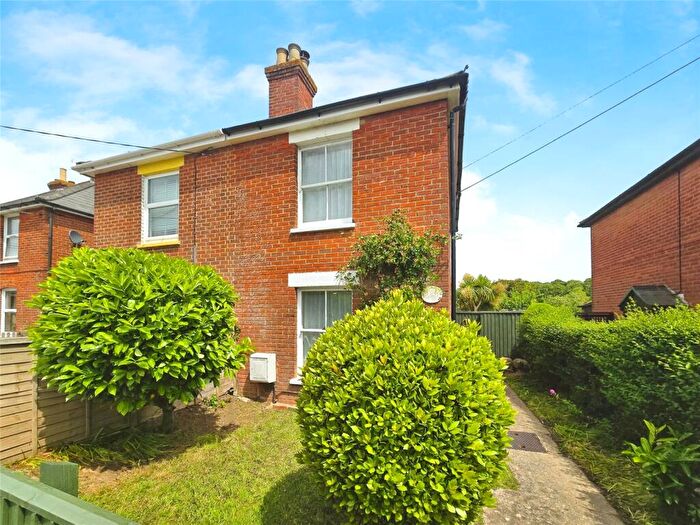
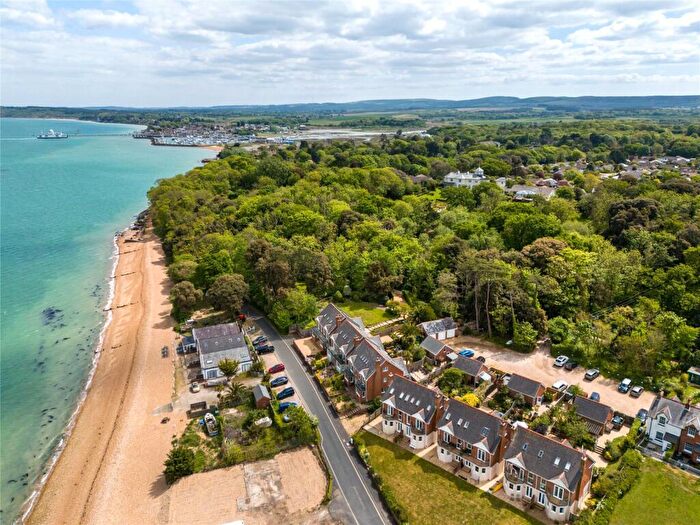
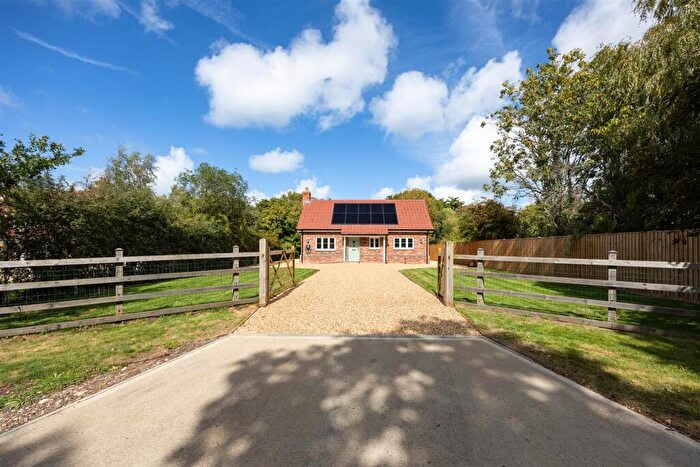
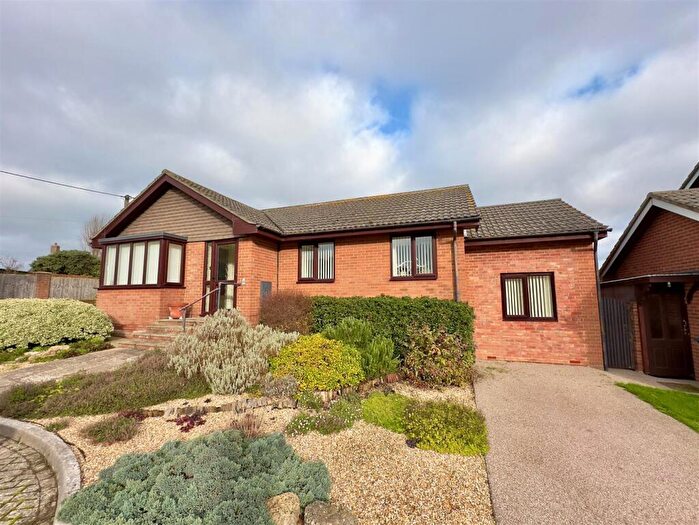
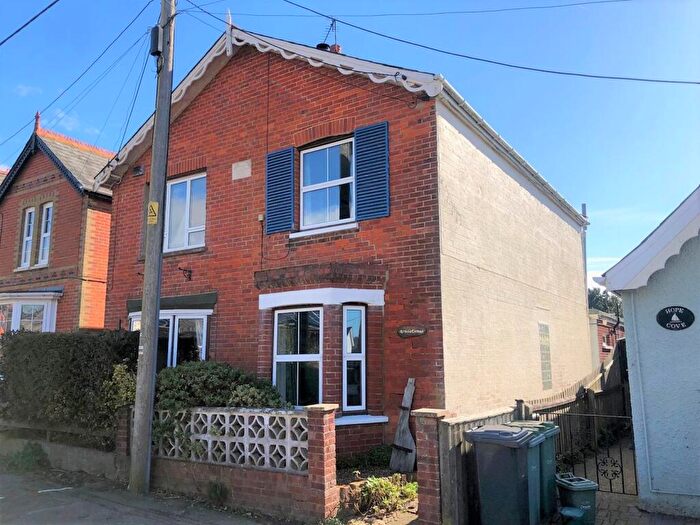
Houses for sale & to rent in West Wight, Yarmouth
House Prices in West Wight
Properties in West Wight have an average house price of £497,901.00 and had 111 Property Transactions within the last 3 years¹.
West Wight is an area in Yarmouth, Isle of Wight with 922 households², where the most expensive property was sold for £2,600,000.00.
Properties for sale in West Wight
Roads and Postcodes in West Wight
Navigate through our locations to find the location of your next house in West Wight, Yarmouth for sale or to rent.
Transport near West Wight
- FAQ
- Price Paid By Year
- Property Type Price
Frequently asked questions about West Wight
What is the average price for a property for sale in West Wight?
The average price for a property for sale in West Wight is £497,901. This amount is 5% lower than the average price in Yarmouth. There are 974 property listings for sale in West Wight.
What streets have the most expensive properties for sale in West Wight?
The streets with the most expensive properties for sale in West Wight are High Street at an average of £1,272,500, Waters Edge at an average of £986,250 and Clay Lane at an average of £872,500.
What streets have the most affordable properties for sale in West Wight?
The streets with the most affordable properties for sale in West Wight are Jireh Place at an average of £155,000, Field Place at an average of £171,000 and The Vineyard at an average of £219,444.
Which train stations are available in or near West Wight?
Some of the train stations available in or near West Wight are Lymington Pier, Lymington Town and Sway.
Property Price Paid in West Wight by Year
The average sold property price by year was:
| Year | Average Sold Price | Price Change |
Sold Properties
|
|---|---|---|---|
| 2025 | £457,330 | -7% |
18 Properties |
| 2024 | £489,326 | 4% |
23 Properties |
| 2023 | £469,553 | -15% |
28 Properties |
| 2022 | £538,883 | 21% |
42 Properties |
| 2021 | £427,353 | 6% |
48 Properties |
| 2020 | £399,965 | 7% |
46 Properties |
| 2019 | £370,553 | -4% |
40 Properties |
| 2018 | £384,307 | 3% |
38 Properties |
| 2017 | £371,216 | -11% |
55 Properties |
| 2016 | £412,648 | 24% |
38 Properties |
| 2015 | £313,347 | 5% |
44 Properties |
| 2014 | £298,921 | -14% |
55 Properties |
| 2013 | £340,093 | 12% |
43 Properties |
| 2012 | £299,068 | -22% |
43 Properties |
| 2011 | £365,694 | 8% |
36 Properties |
| 2010 | £335,705 | 26% |
34 Properties |
| 2009 | £248,393 | -59% |
33 Properties |
| 2008 | £395,503 | 30% |
36 Properties |
| 2007 | £276,540 | -5% |
50 Properties |
| 2006 | £290,727 | 4% |
55 Properties |
| 2005 | £279,603 | 18% |
47 Properties |
| 2004 | £230,242 | 11% |
47 Properties |
| 2003 | £204,150 | 5% |
41 Properties |
| 2002 | £194,772 | 20% |
49 Properties |
| 2001 | £156,210 | 17% |
51 Properties |
| 2000 | £128,981 | -1% |
58 Properties |
| 1999 | £130,173 | 17% |
59 Properties |
| 1998 | £108,265 | 26% |
63 Properties |
| 1997 | £80,268 | -6% |
68 Properties |
| 1996 | £84,984 | 16% |
57 Properties |
| 1995 | £71,564 | - |
37 Properties |
Property Price per Property Type in West Wight
Here you can find historic sold price data in order to help with your property search.
The average Property Paid Price for specific property types in the last three years are:
| Property Type | Average Sold Price | Sold Properties |
|---|---|---|
| Semi Detached House | £363,190.00 | 21 Semi Detached Houses |
| Detached House | £706,215.00 | 52 Detached Houses |
| Terraced House | £379,284.00 | 19 Terraced Houses |
| Flat | £195,286.00 | 19 Flats |

