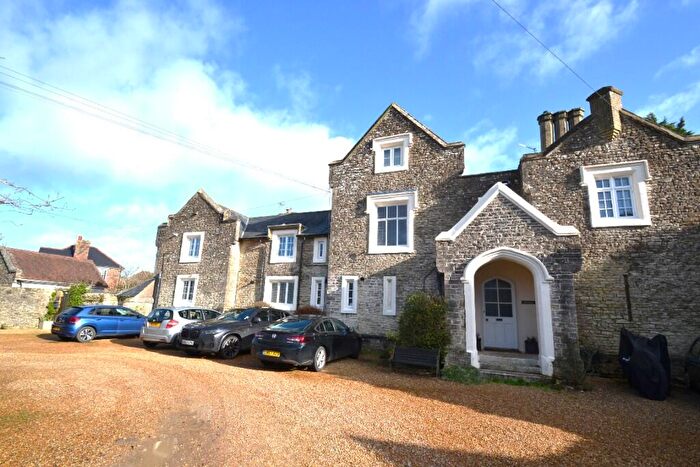
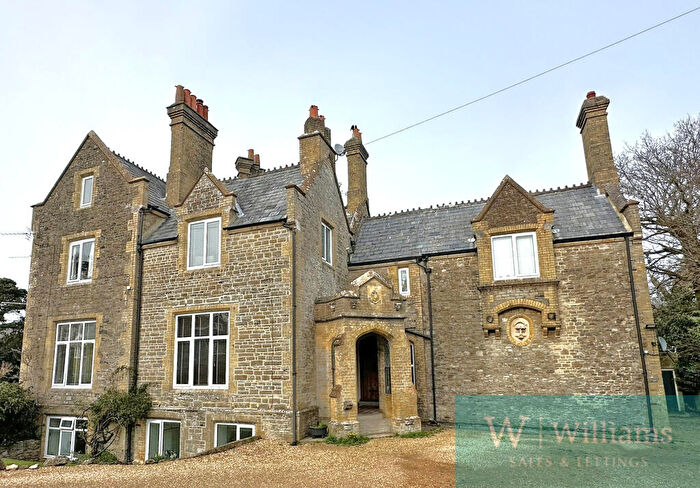
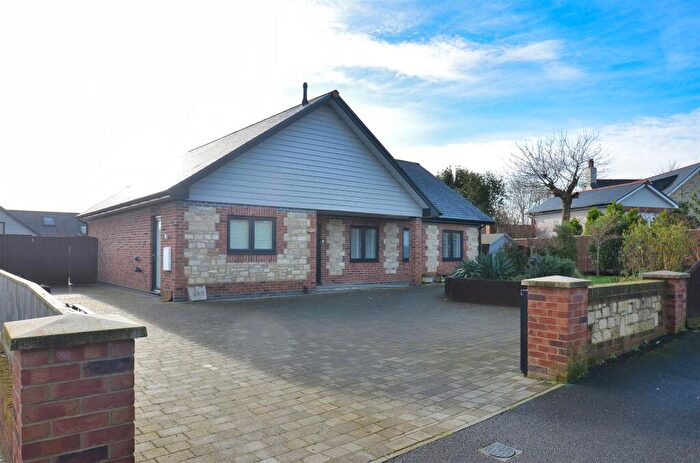
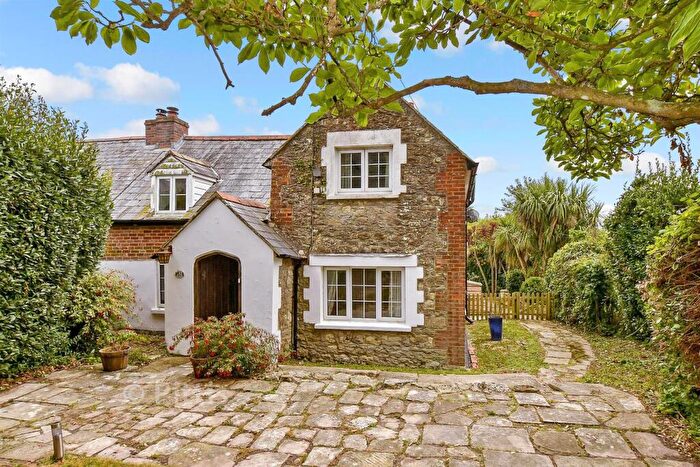
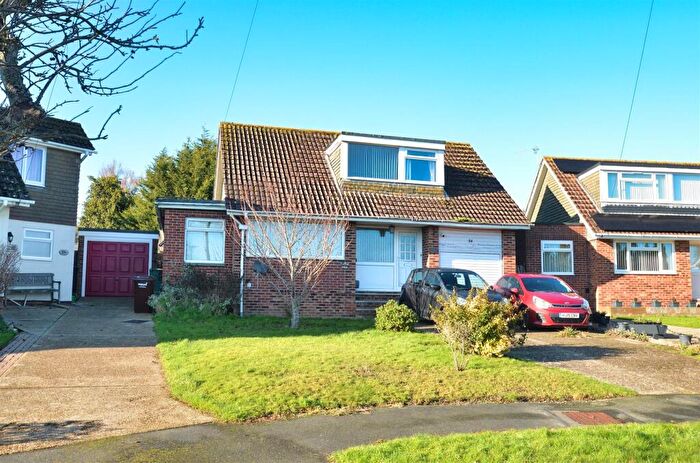
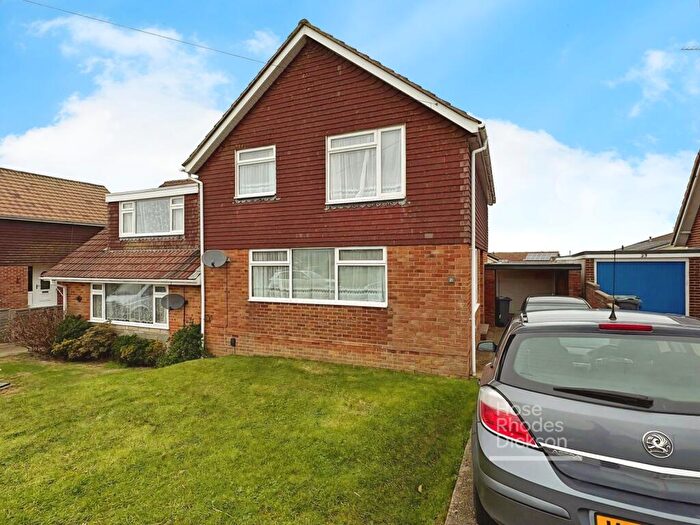
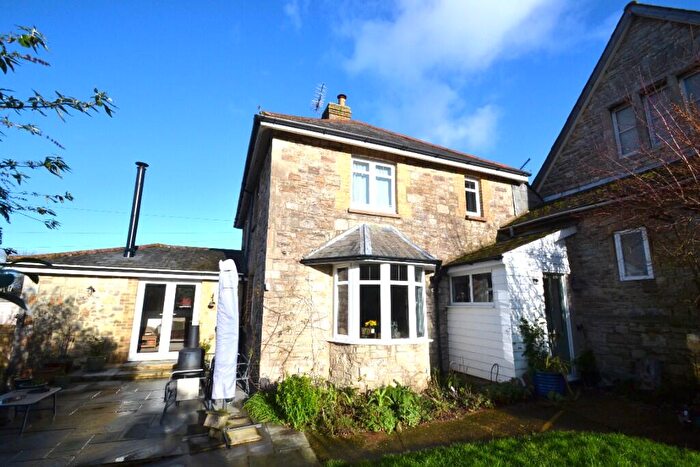
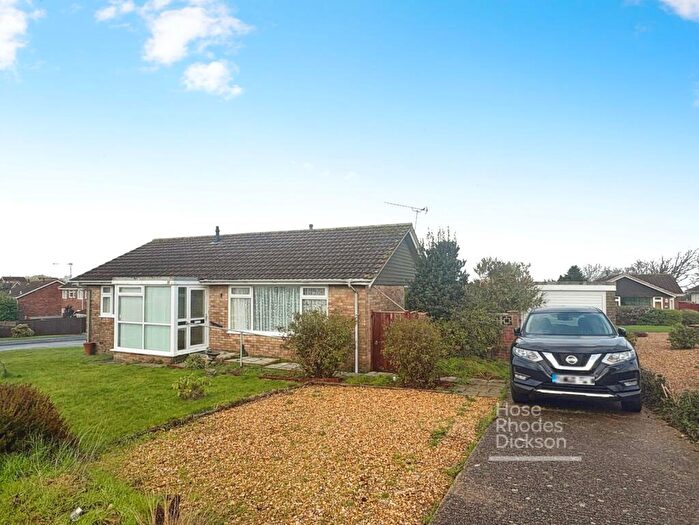
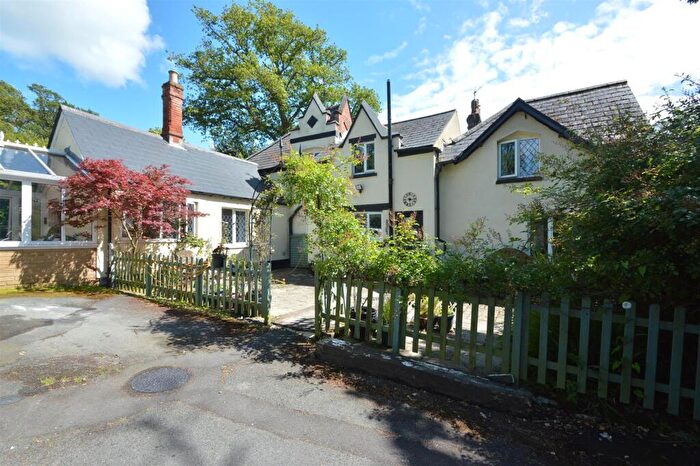
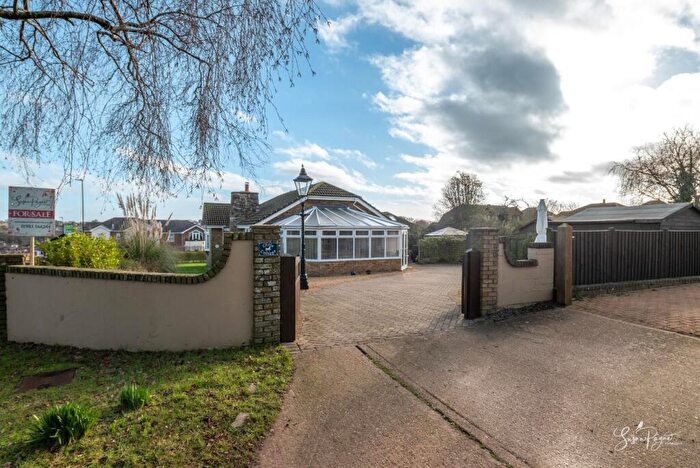
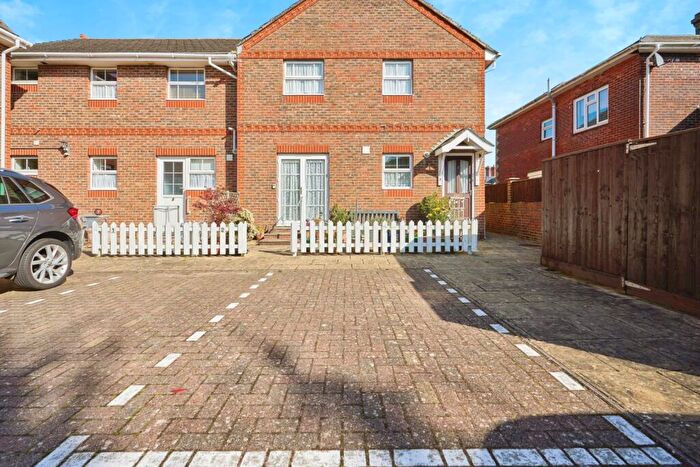
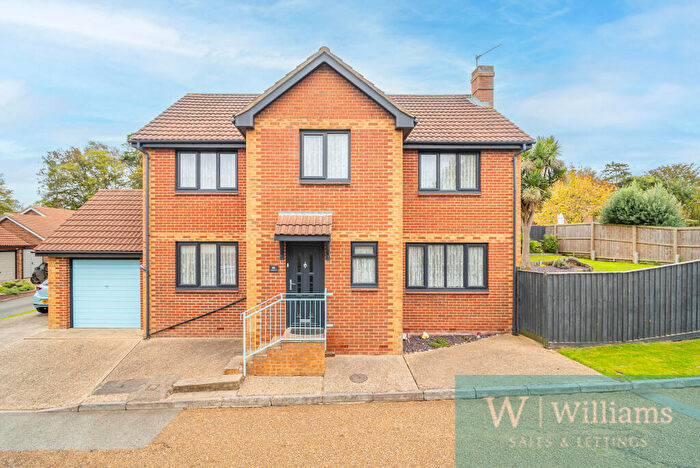
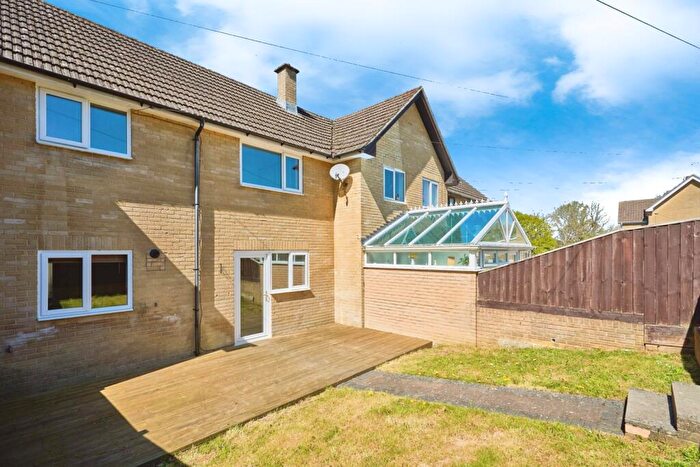
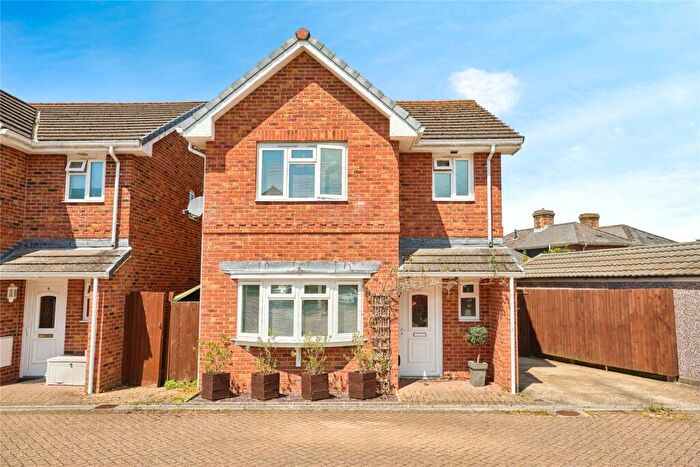
Houses for sale & to rent in Binstead And Fishbourne, Ryde
House Prices in Binstead And Fishbourne
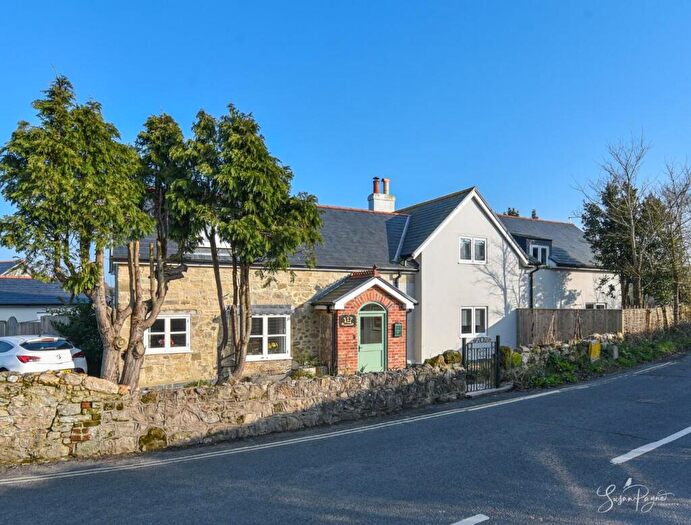
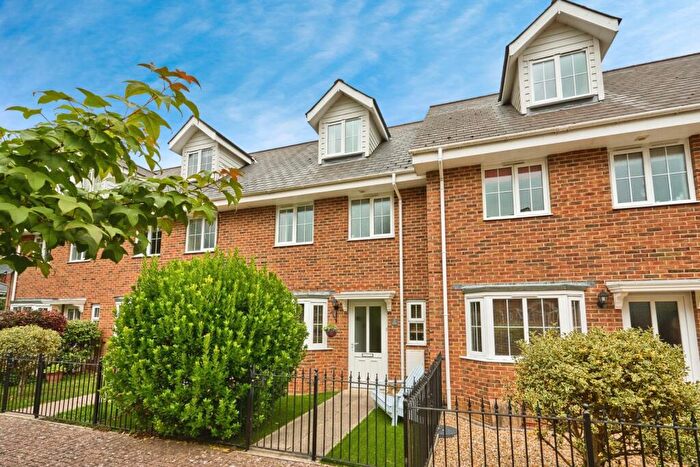
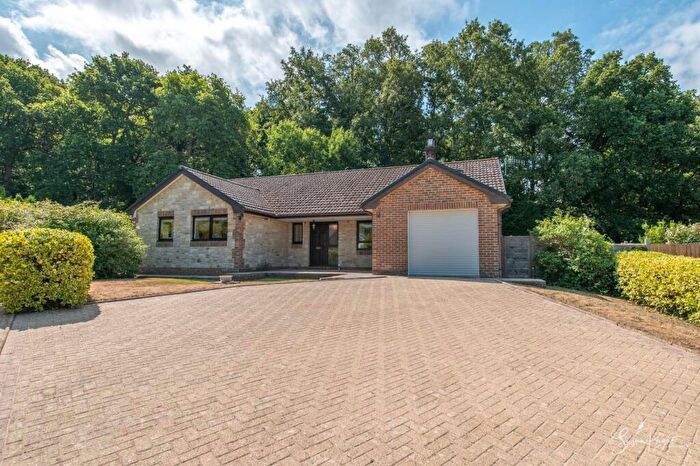
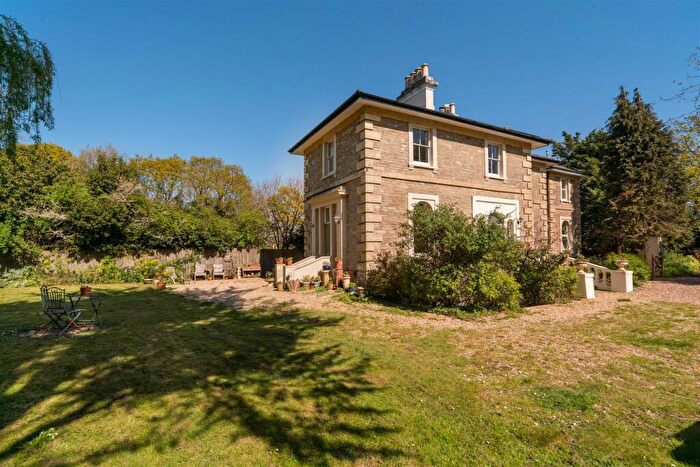
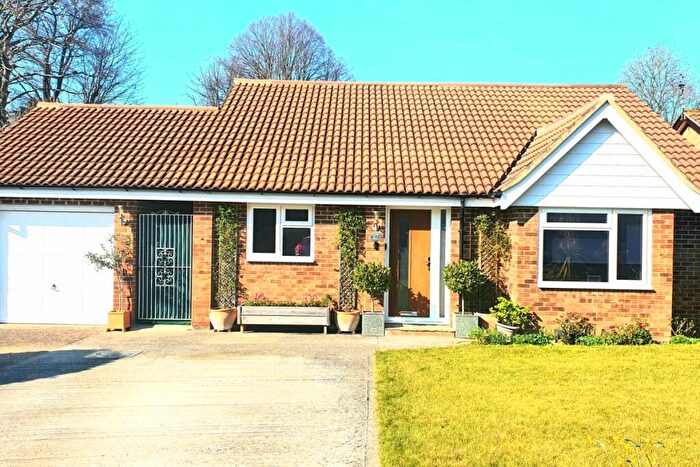
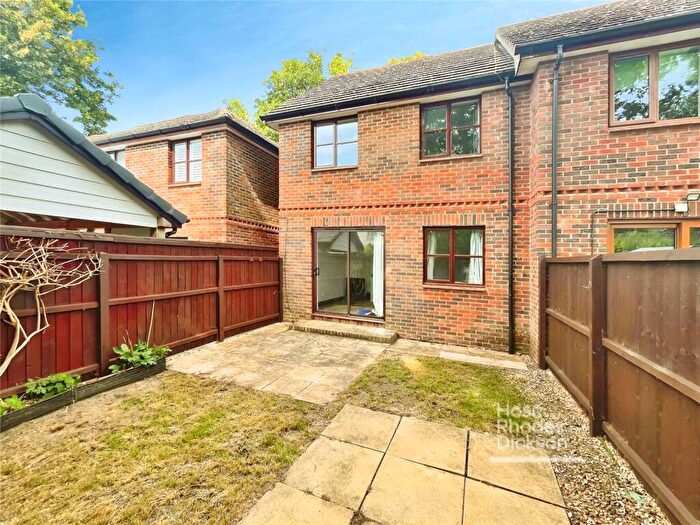
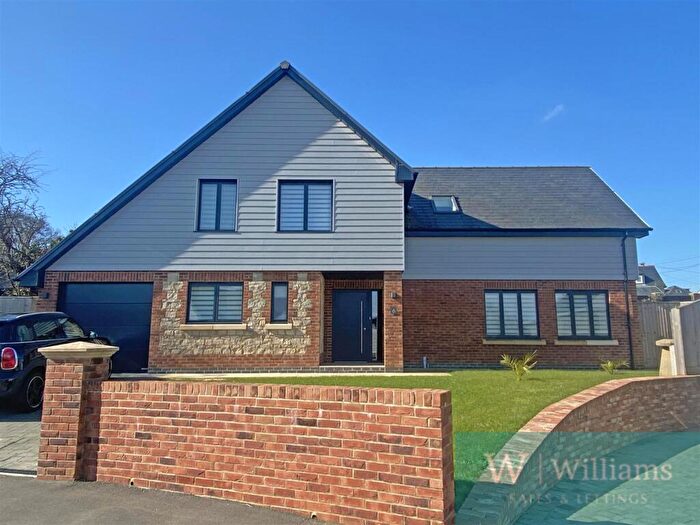
Properties in Binstead And Fishbourne have an average house price of £391,327.00 and had 114 Property Transactions within the last 3 years¹.
Binstead And Fishbourne is an area in Ryde, Isle of Wight with 1,437 households², where the most expensive property was sold for £2,000,050.00.
Properties for sale in Binstead And Fishbourne
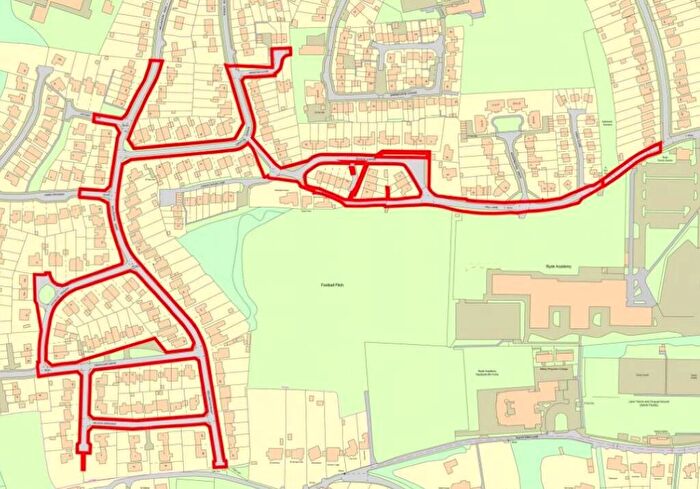
Roads and Postcodes in Binstead And Fishbourne
Navigate through our locations to find the location of your next house in Binstead And Fishbourne, Ryde for sale or to rent.
| Streets | Postcodes |
|---|---|
| Abbots Close | PO33 4EP |
| Arnold Road | PO33 3RG PO33 3RJ PO33 3RQ |
| Ashlake Copse Road | PO33 4EY |
| Ashlake Farm Lane | PO33 4LF |
| Bakers Court | PO33 3HQ |
| Barge Lane | PO33 4LB |
| Binstead Hill | PO33 3RL PO33 3RN PO33 3RP PO33 3RR PO33 3RW |
| Binstead Lodge Road | PO33 3SG PO33 3TL PO33 3TN PO33 3TP PO33 3TS PO33 3TX PO33 3UA PO33 3UB PO33 3UD PO33 3UP PO33 3UT PO33 3UY PO33 3XD PO33 3XJ |
| Binstead Road | PO33 3RD |
| Birch Gardens | PO33 3XB |
| Bourn Close | PO33 3TW |
| Cemetery Road | PO33 3RE PO33 3RF |
| Chapel Road | PO33 3RT |
| Chestnut Close | PO33 3SQ |
| Church Road | PO33 3SY PO33 3SZ PO33 3TA PO33 3TB |
| Cleavers Close | PO33 3SR |
| Coniston Avenue | PO33 3SB |
| Cothey Butts | PO33 4HD |
| Dame Anthonys Close | PO33 3TY |
| Elenors Grove | PO33 4HB PO33 4HE PO33 4HF |
| Firestone Copse Road | PO33 4LQ |
| Firestone Glade | PO33 4LH |
| Fishbourne Lane | PO33 4EU PO33 4EX PO33 4EZ |
| Fleet Close | PO33 3UU |
| Fleming Close | PO33 3TJ |
| Golden Groves | PO33 3UR |
| Gordon Close | PO33 3RB |
| Granary Close | PO33 3HB |
| Greenway | PO33 3SD |
| Greenway Close | PO33 3SH |
| Hawthorn Close | PO33 3PJ |
| Hazlemere Avenue | PO33 3SA |
| Highbank Mews | PO33 4AB |
| Hillrise Avenue | PO33 3TR PO33 3TT PO33 3TZ |
| Kentstone Court | PO33 3DF |
| Kings Road | PO33 3RX |
| Kite Hill | PO33 4LA PO33 4LE PO33 4LG |
| Madeira Row | PO33 3HG |
| Newnham Lane | PO33 4ED |
| Newnham Road | PO33 3TD PO33 3TE PO33 3TF PO33 3ES |
| Oaklands Close | PO33 4HJ |
| Parkway | PO33 3RY PO33 3RZ PO33 3UX |
| Pellview Close | PO33 3TU |
| Pitts Lane | PO33 3AX PO33 3SU PO33 3SX PO33 3XA |
| Quarr Close | PO33 4EN |
| Quarr Hill | PO33 4EH |
| Quarr Lane | PO33 4ET |
| Quarr Place | PO33 4EW |
| Quarr Road | PO33 4EL PO33 4EF PO33 4ER PO33 4ES |
| Quarry Stone Close | PO33 3ET |
| Ranalagh Drive | PO33 4EB |
| Sand Path | PO33 3RU |
| Solent Gardens | PO33 3UZ |
| St Leonards Close | PO33 3SN |
| Stonelands Orchard | PO33 3BB |
| The Boltons | PO33 4PB |
| The Mall | PO33 3SE PO33 3SF |
| The Old Forge Close | PO33 3PL |
| The Poplars | PO33 4EJ |
| Verwood Drive | PO33 3SJ PO33 3SL PO33 3SP PO33 3SS |
| Victoria Mews | PO33 3AZ |
| Wellwood Glade | PO33 4HA |
| Wykeham Close | PO33 3ST |
| PO33 4AG PO33 4HL |
Transport near Binstead And Fishbourne
-
Ryde Esplanade Station
-
Ryde St.John's Road Station
-
Ryde Pier Head Station
-
Smallbrook Junction Station
- FAQ
- Price Paid By Year
- Property Type Price
Frequently asked questions about Binstead And Fishbourne
What is the average price for a property for sale in Binstead And Fishbourne?
The average price for a property for sale in Binstead And Fishbourne is £391,327. This amount is 46% higher than the average price in Ryde. There are 328 property listings for sale in Binstead And Fishbourne.
What streets have the most expensive properties for sale in Binstead And Fishbourne?
The streets with the most expensive properties for sale in Binstead And Fishbourne are Ashlake Copse Road at an average of £1,325,025, Fishbourne Lane at an average of £691,500 and Kite Hill at an average of £665,000.
What streets have the most affordable properties for sale in Binstead And Fishbourne?
The streets with the most affordable properties for sale in Binstead And Fishbourne are Barge Lane at an average of £136,875, Dame Anthonys Close at an average of £146,500 and Birch Gardens at an average of £231,750.
Which train stations are available in or near Binstead And Fishbourne?
Some of the train stations available in or near Binstead And Fishbourne are Ryde Esplanade, Ryde St.John's Road and Ryde Pier Head.
Property Price Paid in Binstead And Fishbourne by Year
The average sold property price by year was:
| Year | Average Sold Price | Price Change |
Sold Properties
|
|---|---|---|---|
| 2025 | £355,155 | -13% |
30 Properties |
| 2024 | £401,012 | -2% |
53 Properties |
| 2023 | £409,774 | -1% |
31 Properties |
| 2022 | £414,768 | 13% |
55 Properties |
| 2021 | £359,822 | 7% |
89 Properties |
| 2020 | £335,305 | -2% |
57 Properties |
| 2019 | £343,068 | 14% |
71 Properties |
| 2018 | £295,603 | 14% |
65 Properties |
| 2017 | £254,057 | -29% |
76 Properties |
| 2016 | £327,253 | 19% |
85 Properties |
| 2015 | £265,917 | 12% |
64 Properties |
| 2014 | £234,353 | -13% |
79 Properties |
| 2013 | £264,501 | 11% |
63 Properties |
| 2012 | £235,098 | -15% |
52 Properties |
| 2011 | £269,730 | 15% |
63 Properties |
| 2010 | £230,000 | 10% |
52 Properties |
| 2009 | £205,881 | -24% |
47 Properties |
| 2008 | £254,724 | 6% |
52 Properties |
| 2007 | £238,887 | -6% |
68 Properties |
| 2006 | £253,908 | 26% |
88 Properties |
| 2005 | £187,275 | -12% |
58 Properties |
| 2004 | £210,081 | 13% |
88 Properties |
| 2003 | £183,073 | 19% |
72 Properties |
| 2002 | £149,026 | 20% |
97 Properties |
| 2001 | £118,554 | 2% |
84 Properties |
| 2000 | £116,000 | 25% |
81 Properties |
| 1999 | £87,169 | 17% |
95 Properties |
| 1998 | £72,397 | -0,1% |
97 Properties |
| 1997 | £72,444 | -2% |
103 Properties |
| 1996 | £73,881 | 19% |
81 Properties |
| 1995 | £59,895 | - |
62 Properties |
Property Price per Property Type in Binstead And Fishbourne
Here you can find historic sold price data in order to help with your property search.
The average Property Paid Price for specific property types in the last three years are:
| Property Type | Average Sold Price | Sold Properties |
|---|---|---|
| Semi Detached House | £279,260.00 | 25 Semi Detached Houses |
| Detached House | £472,688.00 | 68 Detached Houses |
| Terraced House | £243,000.00 | 18 Terraced Houses |
| Flat | £371,000.00 | 3 Flats |

