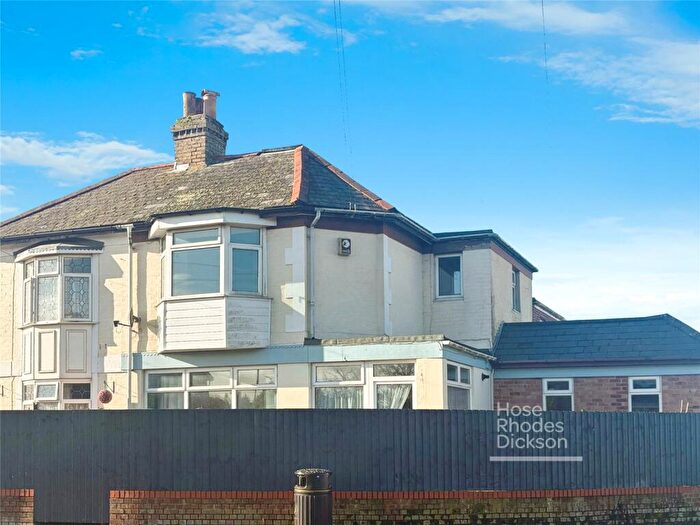
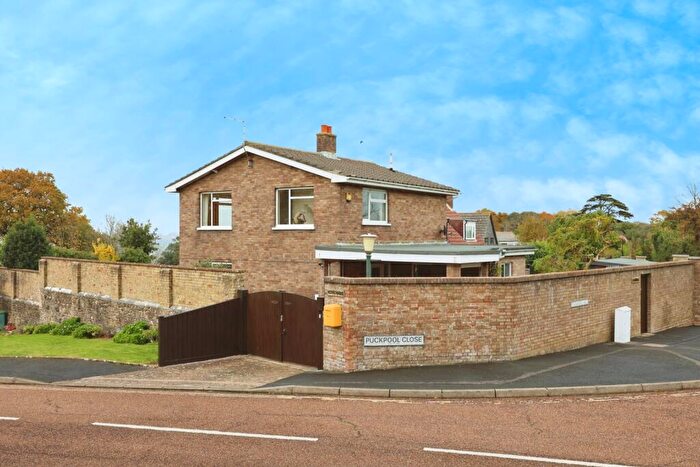
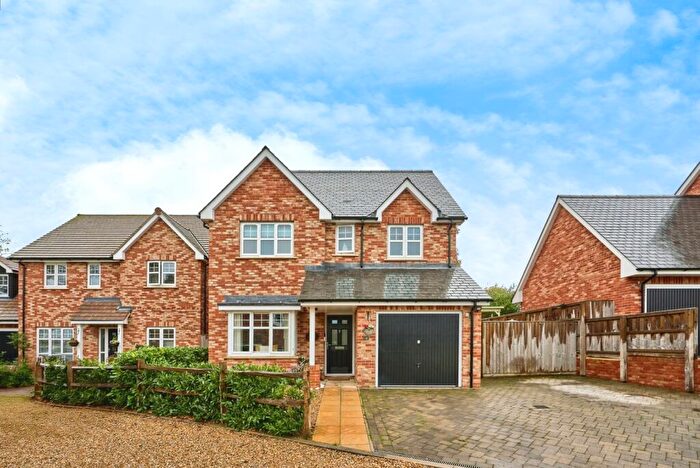
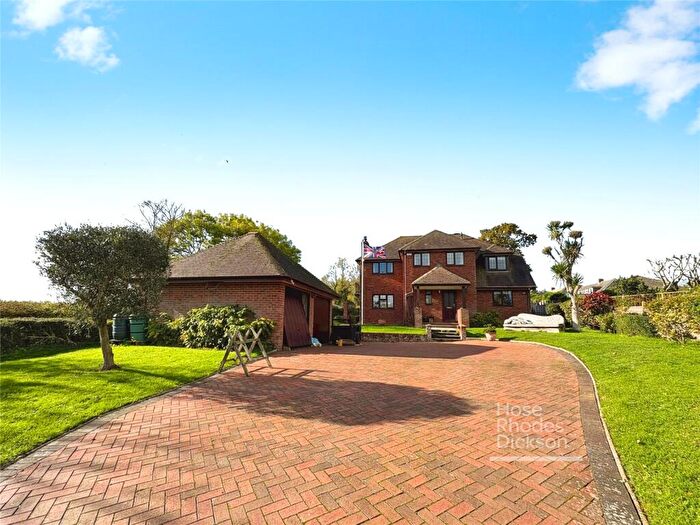
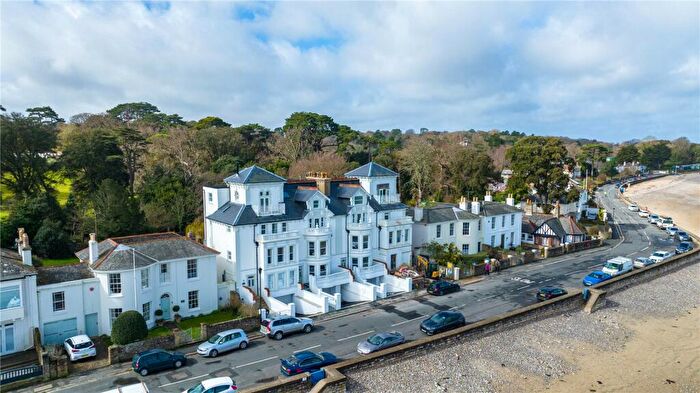
Houses for sale & to rent in Nettlestone And Seaview, Ryde
House Prices in Nettlestone And Seaview
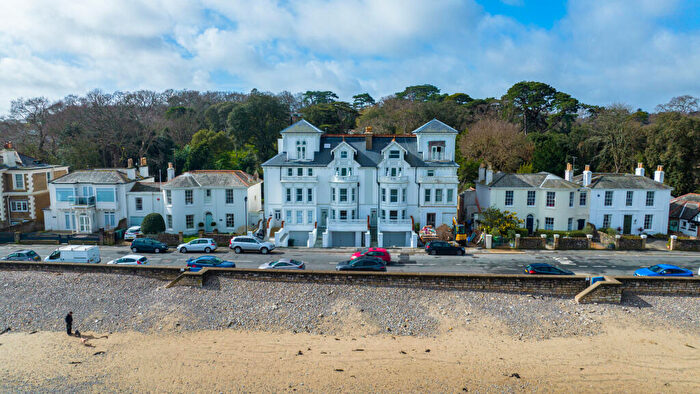
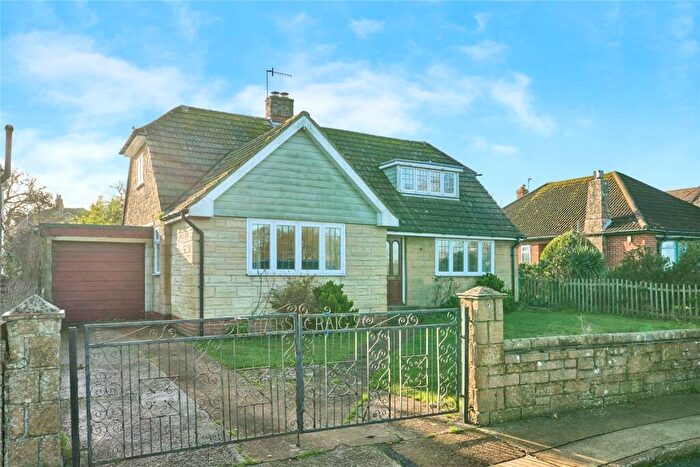
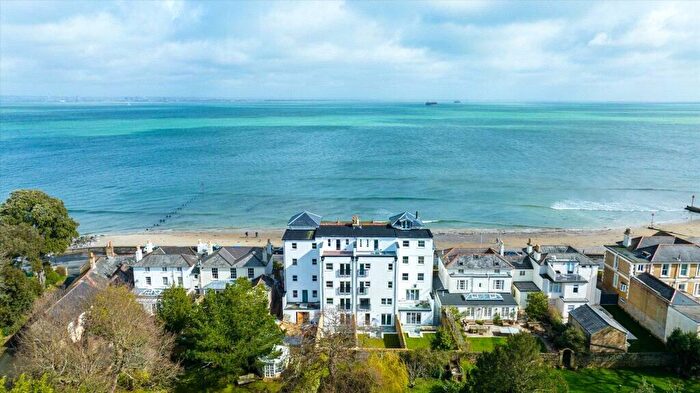
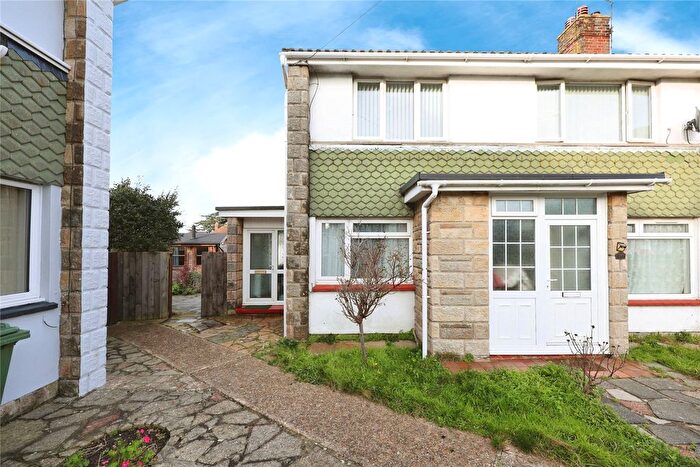
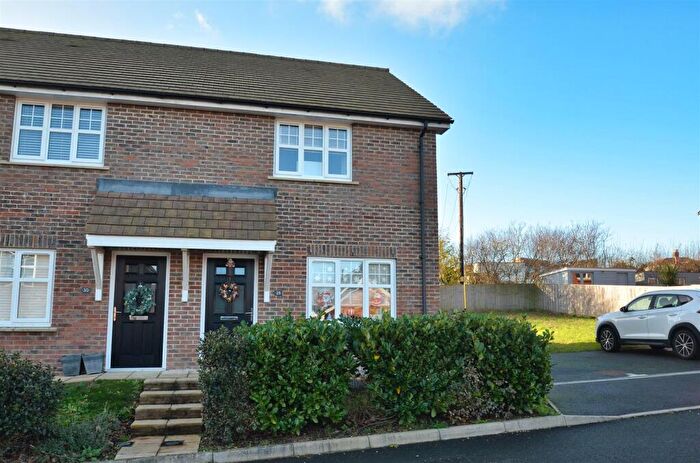
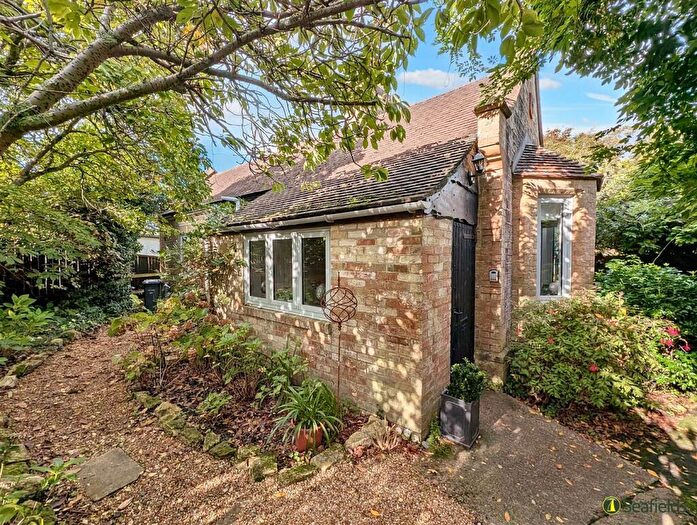
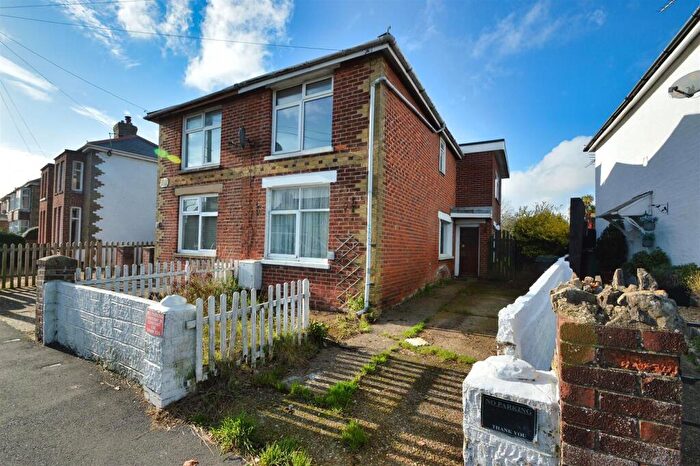
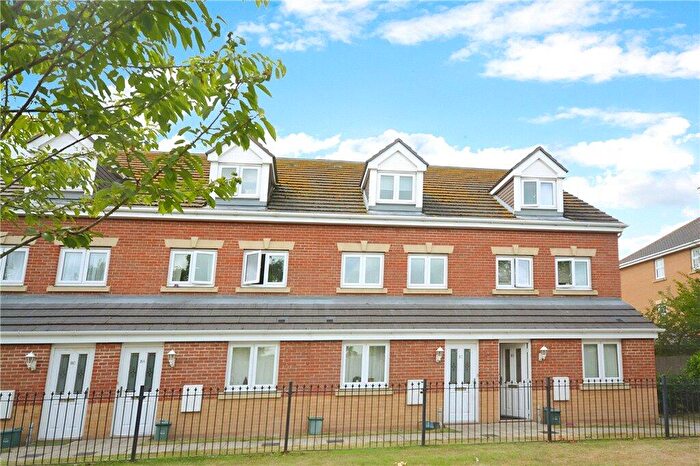
Properties in Nettlestone And Seaview have an average house price of £517,793.00 and had 29 Property Transactions within the last 3 years¹.
Nettlestone And Seaview is an area in Ryde, Isle of Wight with 220 households², where the most expensive property was sold for £1,600,000.00.
Properties for sale in Nettlestone And Seaview
Roads and Postcodes in Nettlestone And Seaview
Navigate through our locations to find the location of your next house in Nettlestone And Seaview, Ryde for sale or to rent.
| Streets | Postcodes |
|---|---|
| Aspen Gardens | PO33 1RE |
| Attrills Lane | PO33 1XU |
| Brading Road | PO33 1QG PO33 1QS |
| Bullen Road | PO33 1QB PO33 1QE PO33 1QF PO33 1QH |
| Calthorpe Road | PO33 1PB PO33 1PN PO33 1PR PO33 1PS |
| Coppice End | PO33 1QN |
| Cothey Way | PO33 1QY PO33 1FX PO33 1QT |
| Gregory Avenue | PO33 1PZ |
| Gregory Close | PO33 1QR |
| Hornbeam Square | PO33 1RF |
| Hutchinson Drive | PO33 1QP |
| Mulberry Way | PO33 1QW |
| Oakhill Road | PO33 1PT PO33 1PU |
| Pondwell Close | PO33 1QD |
| Pondwell Hill | PO33 1PX PO33 1PY |
| Puckpool Close | PO33 1PD |
| Puckpool Hill | PO33 1PJ |
| Wishing Well Close | PO33 1FS |
| Woodland Close | PO33 1PW |
Transport near Nettlestone And Seaview
-
Smallbrook Junction Station
-
Ryde St.John's Road Station
-
Ryde Esplanade Station
-
Ryde Pier Head Station
-
Brading Station
- FAQ
- Price Paid By Year
- Property Type Price
Frequently asked questions about Nettlestone And Seaview
What is the average price for a property for sale in Nettlestone And Seaview?
The average price for a property for sale in Nettlestone And Seaview is £517,793. This amount is 88% higher than the average price in Ryde. There are 438 property listings for sale in Nettlestone And Seaview.
What streets have the most expensive properties for sale in Nettlestone And Seaview?
The streets with the most expensive properties for sale in Nettlestone And Seaview are Wishing Well Close at an average of £678,333, Cothey Way at an average of £457,500 and Puckpool Close at an average of £385,000.
What streets have the most affordable properties for sale in Nettlestone And Seaview?
The streets with the most affordable properties for sale in Nettlestone And Seaview are Hornbeam Square at an average of £372,500 and Gregory Avenue at an average of £381,666.
Which train stations are available in or near Nettlestone And Seaview?
Some of the train stations available in or near Nettlestone And Seaview are Smallbrook Junction, Ryde St.John's Road and Ryde Esplanade.
Property Price Paid in Nettlestone And Seaview by Year
The average sold property price by year was:
| Year | Average Sold Price | Price Change |
Sold Properties
|
|---|---|---|---|
| 2025 | £385,833 | -30% |
3 Properties |
| 2024 | £501,250 | -22% |
4 Properties |
| 2023 | £614,000 | 24% |
11 Properties |
| 2022 | £463,590 | 13% |
11 Properties |
| 2021 | £404,789 | 2% |
19 Properties |
| 2020 | £397,333 | 31% |
9 Properties |
| 2019 | £274,322 | -15% |
11 Properties |
| 2018 | £314,307 | -2% |
13 Properties |
| 2017 | £321,246 | 7% |
14 Properties |
| 2016 | £298,745 | 1% |
10 Properties |
| 2015 | £297,063 | 7% |
15 Properties |
| 2014 | £274,925 | 17% |
10 Properties |
| 2013 | £228,430 | -24% |
15 Properties |
| 2012 | £283,300 | -12% |
10 Properties |
| 2011 | £316,300 | 22% |
10 Properties |
| 2010 | £246,300 | 4% |
10 Properties |
| 2009 | £236,991 | -8% |
12 Properties |
| 2008 | £255,875 | -16% |
4 Properties |
| 2007 | £295,840 | 10% |
20 Properties |
| 2006 | £265,000 | -9% |
16 Properties |
| 2005 | £288,052 | 25% |
20 Properties |
| 2004 | £215,471 | 4% |
19 Properties |
| 2003 | £207,612 | 3% |
16 Properties |
| 2002 | £200,572 | 8% |
20 Properties |
| 2001 | £185,309 | 28% |
21 Properties |
| 2000 | £133,827 | 16% |
9 Properties |
| 1999 | £112,260 | 4% |
5 Properties |
| 1998 | £107,800 | 27% |
5 Properties |
| 1997 | £78,190 | 6% |
5 Properties |
| 1996 | £73,665 | 4% |
6 Properties |
| 1995 | £70,883 | - |
9 Properties |
Property Price per Property Type in Nettlestone And Seaview
Here you can find historic sold price data in order to help with your property search.
The average Property Paid Price for specific property types in the last three years are:
| Property Type | Average Sold Price | Sold Properties |
|---|---|---|
| Semi Detached House | £378,750.00 | 4 Semi Detached Houses |
| Terraced House | £341,250.00 | 2 Terraced Houses |
| Detached House | £557,326.00 | 23 Detached Houses |

