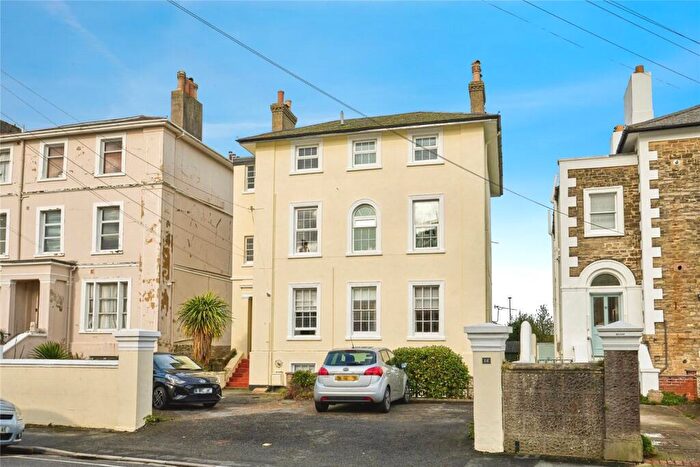
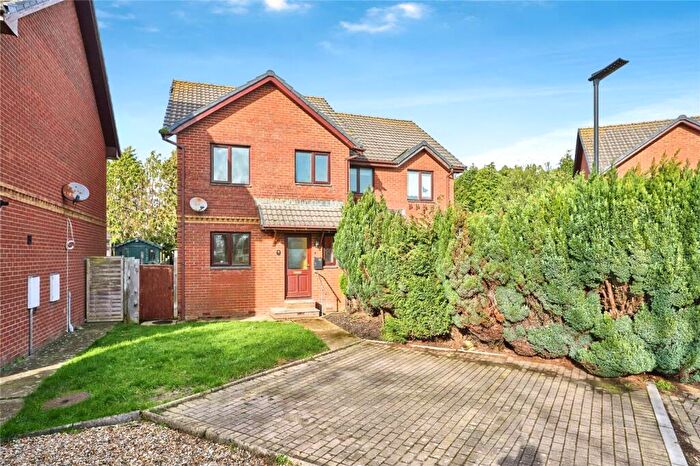
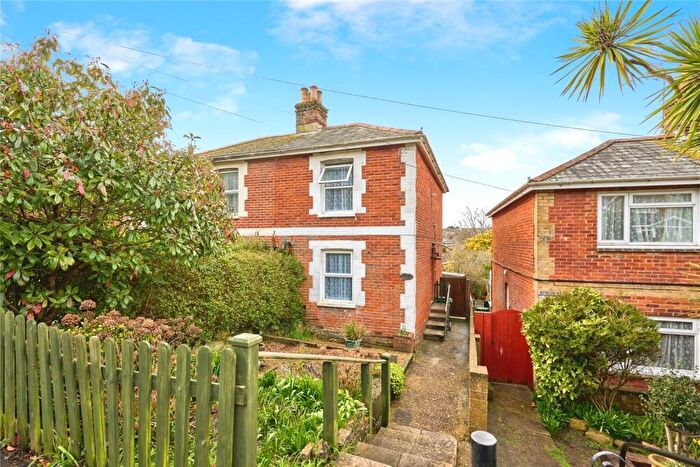
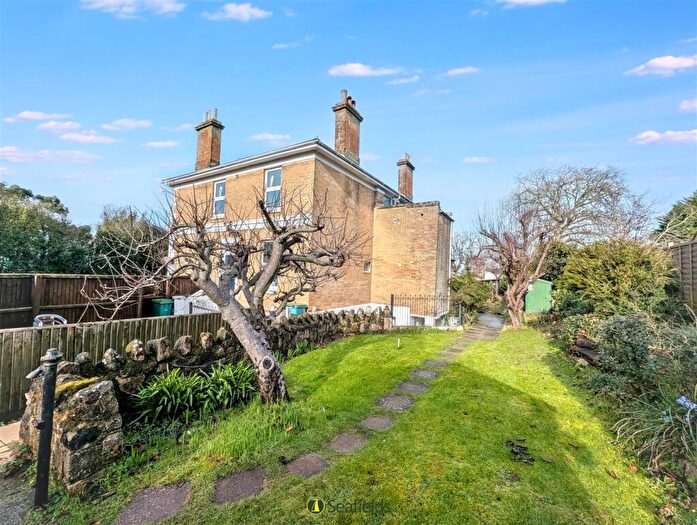
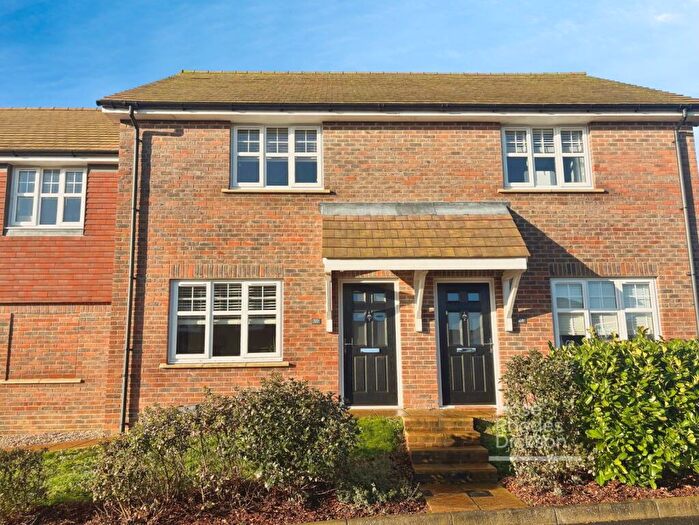
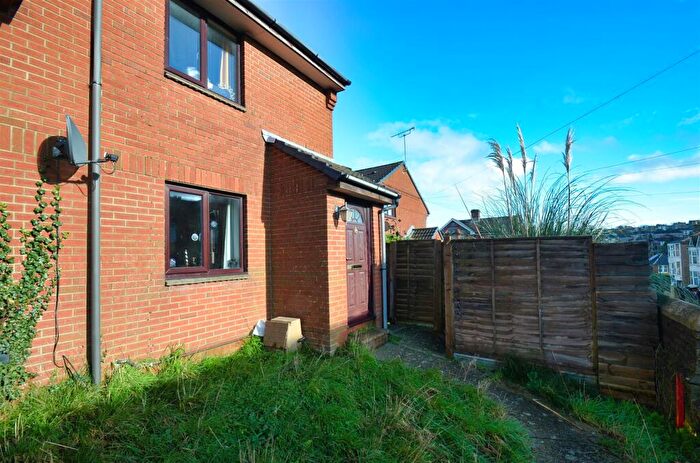
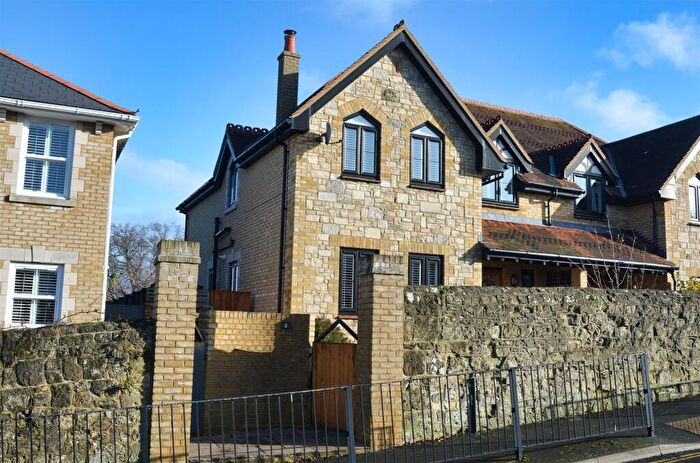
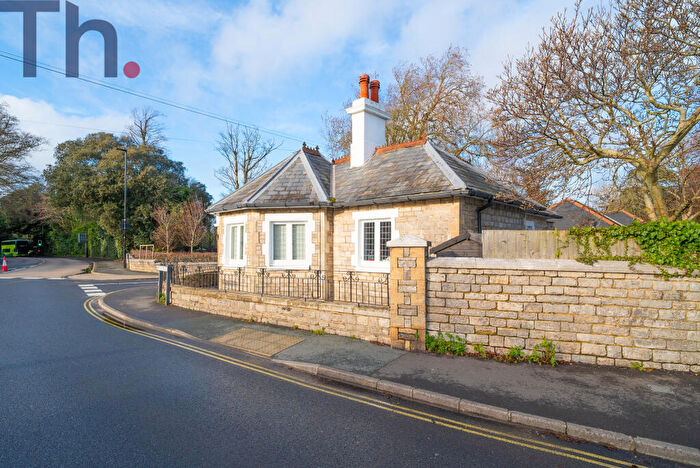
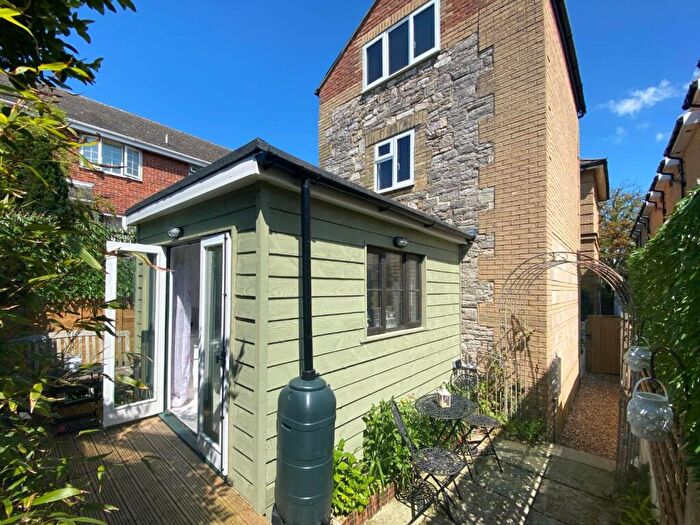
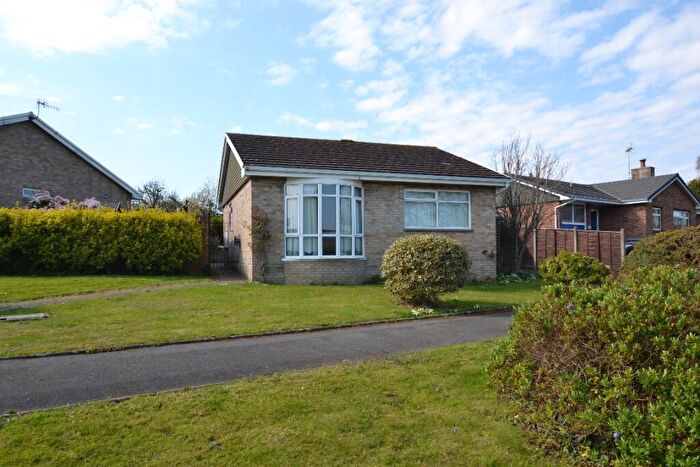
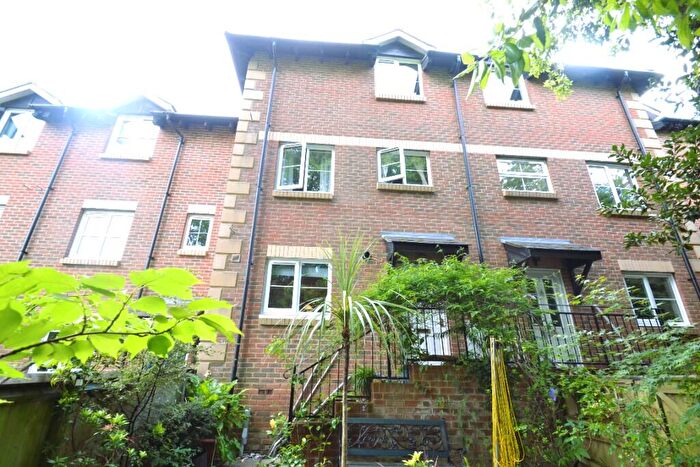
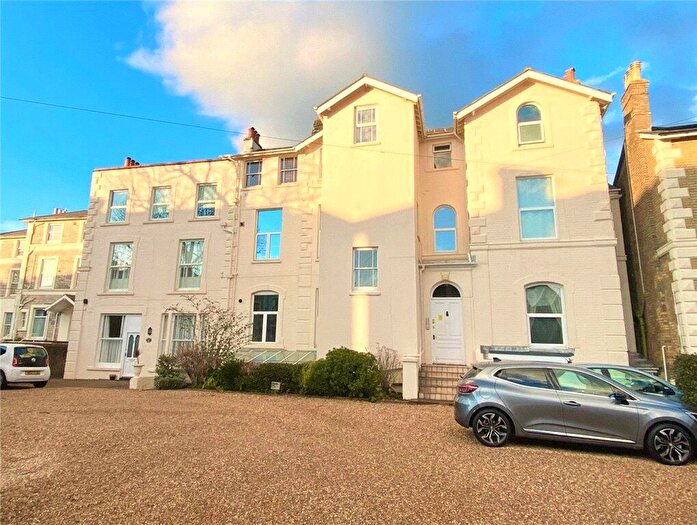
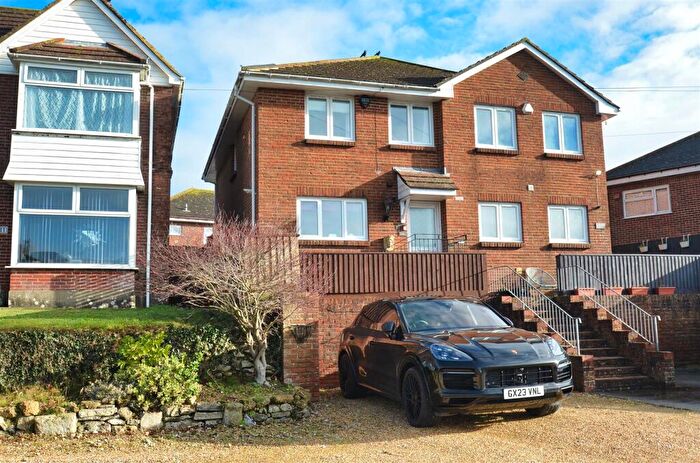
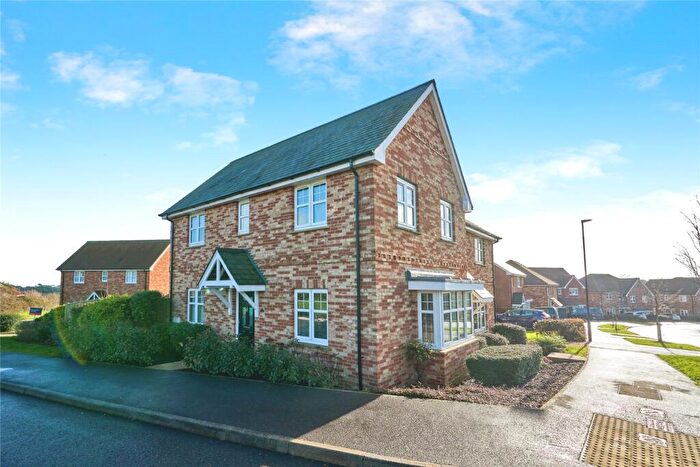
Houses for sale & to rent in Ryde East, Ryde
House Prices in Ryde East
Properties in Ryde East have an average house price of £267,156.00 and had 158 Property Transactions within the last 3 years¹.
Ryde East is an area in Ryde, Isle of Wight with 1,609 households², where the most expensive property was sold for £855,000.00.
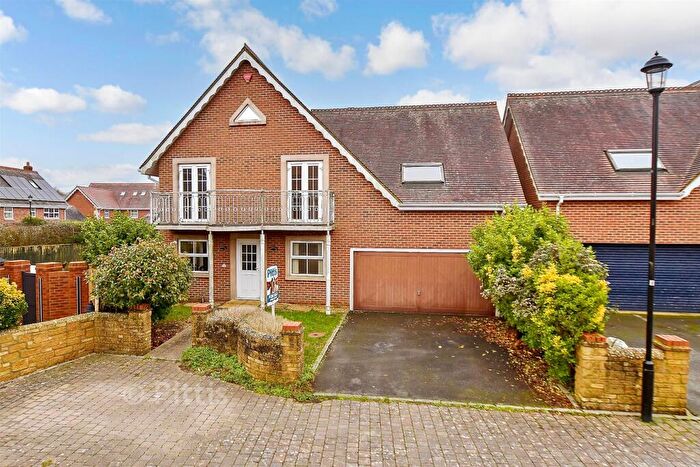
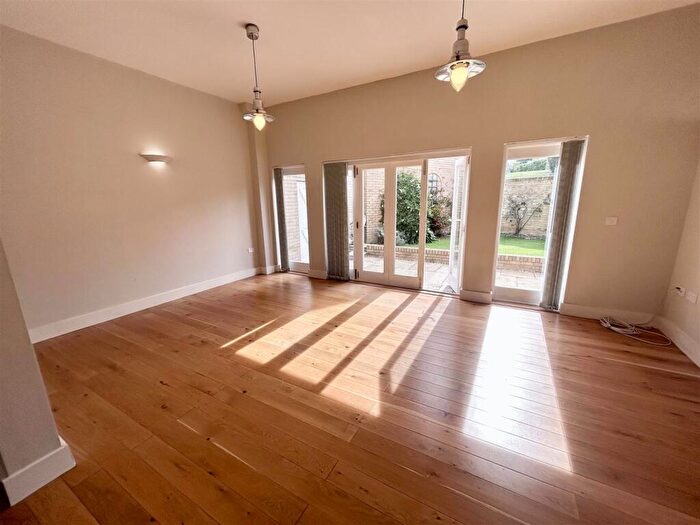
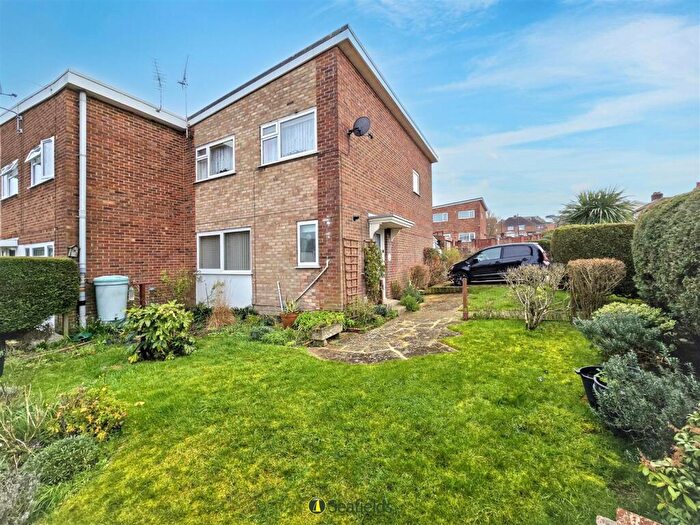
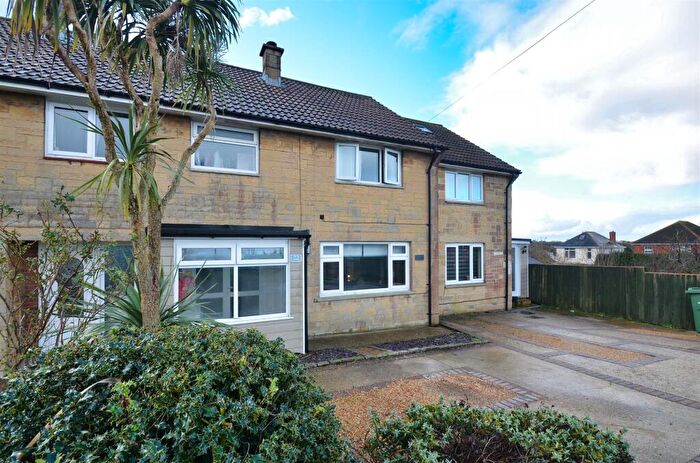
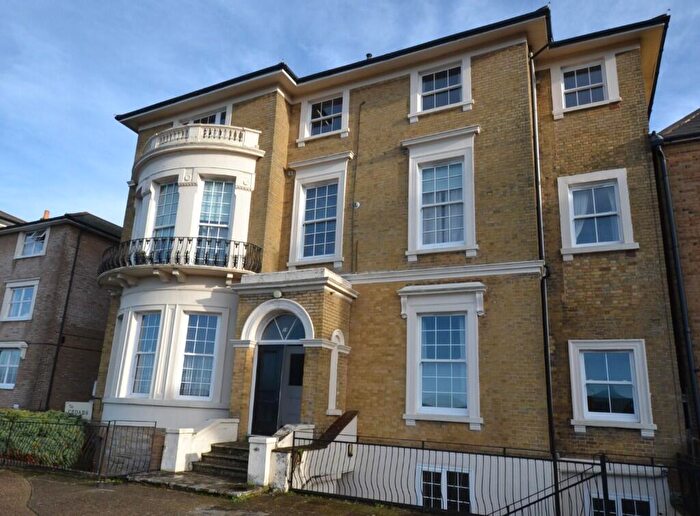
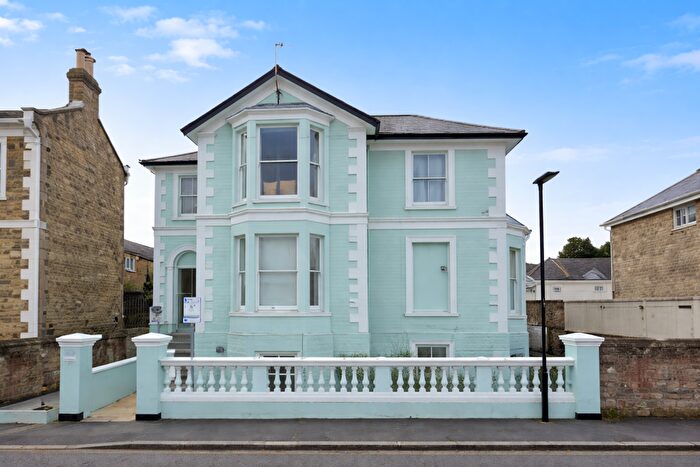
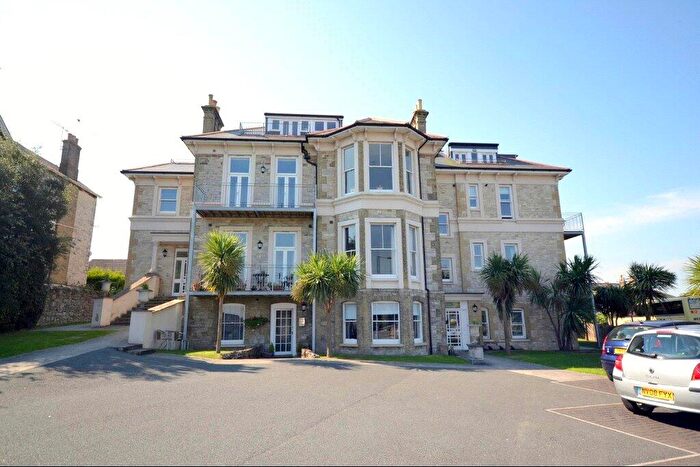
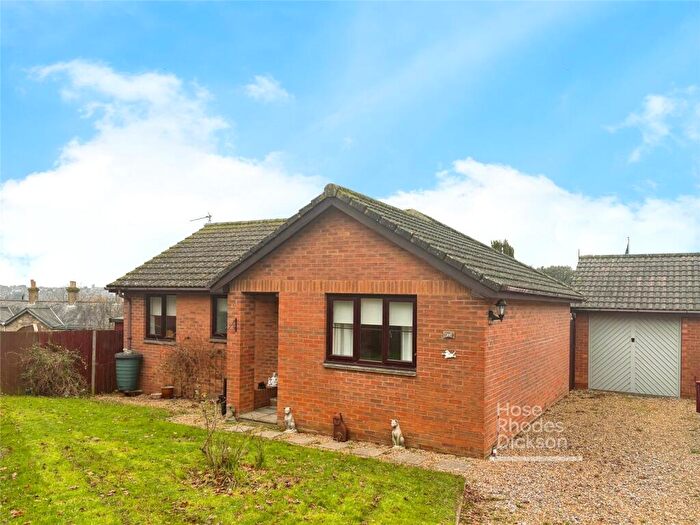
Properties for sale in Ryde East
Roads and Postcodes in Ryde East
Navigate through our locations to find the location of your next house in Ryde East, Ryde for sale or to rent.
| Streets | Postcodes |
|---|---|
| Alexandra Road | PO33 1DT PO33 1LT |
| Amherst Mews | PO33 1FG |
| Amherst Place | PO33 1FE PO33 1FF |
| Appley Lane | PO33 1NQ PO33 1ND |
| Appley Road | PO33 1NE PO33 1NF PO33 1PE PO33 1PH |
| Appley Walk | PO33 1QX |
| Arundel Close | PO33 1BS |
| Arundel Road | PO33 1BN PO33 1BW |
| Banbury Close | PO33 1DP |
| Brading Road | PO33 1QQ PO33 1AX |
| Bullen Road | PO33 1AU |
| Carlton Road | PO33 1DE PO33 1DF |
| Chestnut Grove | PO33 1NP |
| Circular Road | PO33 1AL |
| Derwent Drive | PO33 1NT |
| Elm Close | PO33 1ED |
| Gassiot Close | PO33 1GA |
| Gassiot Green Road | PO33 1FQ |
| Gassiot Place | PO33 1DN |
| Grasmere Avenue | PO33 1NU |
| Great Preston Road | PO33 1AY PO33 1AZ PO33 1BA PO33 1DB PO33 1DD PO33 1DL PO33 1DR PO33 1DS PO33 1EE PO33 1EF |
| Hayward Avenue | PO33 1AS |
| High Park Road | PO33 1BL PO33 1BP PO33 1BT PO33 1BX PO33 1BZ |
| High Park Square | PO33 1EP |
| Holly Tree Close | PO33 1HU |
| Hope Road | PO33 1AG PO33 1AH PO33 1AJ PO33 1AQ |
| Lavender Glade | PO33 1BJ |
| Little Preston Road | PO33 1DG |
| Long Orchard | PO33 1FH |
| Marina Avenue | PO33 1NG PO33 1NJ PO33 1NN |
| Marlborough Close | PO33 1AP |
| Marlborough Road | PO33 1AA PO33 1AB PO33 1AE PO33 1AF PO33 1AN PO33 1AR PO33 1AT PO33 1AW PO33 1AD |
| Preston Close | PO33 1DA PO33 1DJ |
| Queens Walk | PO33 1NW |
| Royal Walk | PO33 1NL |
| Sadlers Close | PO33 1RA |
| Salisbury Road | PO33 1BY |
| Seldon Avenue | PO33 1NR PO33 1NS |
| Smallbrook Lane | PO33 1BB |
| Solent Close | PO33 1NH |
| Somerset Road | PO33 1BU |
| St Johns Avenue | PO33 1ER |
| St Johns Hill | PO33 1DU PO33 1ES |
| St Johns Place | PO33 1FR |
| St Johns Wood Road | PO33 1FJ PO33 1FL PO33 1HL PO33 1HP |
| Sutton Close | PO33 1DH |
| Swaylands Close | PO33 1FA |
| The Firs | PO33 1FN |
| Thornton Close | PO33 1PF |
| Thornton Manor Drive | PO33 1PG PO33 1PQ |
| Upper Highland Road | PO33 1EA |
| Victoria Crescent | PO33 1DQ |
| Westview Terrace | PO33 1JT |
| Williams Close | PO33 1HT |
Transport near Ryde East
-
Ryde St.John's Road Station
-
Smallbrook Junction Station
-
Ryde Esplanade Station
-
Ryde Pier Head Station
-
Brading Station
- FAQ
- Price Paid By Year
- Property Type Price
Frequently asked questions about Ryde East
What is the average price for a property for sale in Ryde East?
The average price for a property for sale in Ryde East is £267,156. There are 1,082 property listings for sale in Ryde East.
What streets have the most expensive properties for sale in Ryde East?
The streets with the most expensive properties for sale in Ryde East are Appley Road at an average of £569,166, Salisbury Road at an average of £550,000 and Bullen Road at an average of £388,775.
What streets have the most affordable properties for sale in Ryde East?
The streets with the most affordable properties for sale in Ryde East are Alexandra Road at an average of £119,377, Amherst Place at an average of £140,135 and Thornton Manor Drive at an average of £150,000.
Which train stations are available in or near Ryde East?
Some of the train stations available in or near Ryde East are Ryde St.John's Road, Smallbrook Junction and Ryde Esplanade.
Property Price Paid in Ryde East by Year
The average sold property price by year was:
| Year | Average Sold Price | Price Change |
Sold Properties
|
|---|---|---|---|
| 2025 | £277,652 | -1% |
36 Properties |
| 2024 | £281,368 | 12% |
61 Properties |
| 2023 | £246,750 | -12% |
61 Properties |
| 2022 | £275,996 | 6% |
73 Properties |
| 2021 | £260,781 | 7% |
82 Properties |
| 2020 | £241,356 | 10% |
56 Properties |
| 2019 | £217,991 | -7% |
77 Properties |
| 2018 | £232,978 | 4% |
55 Properties |
| 2017 | £223,091 | -1% |
89 Properties |
| 2016 | £225,850 | 7% |
77 Properties |
| 2015 | £210,458 | 8% |
67 Properties |
| 2014 | £193,593 | 5% |
68 Properties |
| 2013 | £184,817 | 0,4% |
57 Properties |
| 2012 | £183,990 | 8% |
49 Properties |
| 2011 | £168,542 | 6% |
47 Properties |
| 2010 | £158,243 | -14% |
56 Properties |
| 2009 | £180,565 | 9% |
63 Properties |
| 2008 | £164,464 | -15% |
61 Properties |
| 2007 | £189,782 | 12% |
127 Properties |
| 2006 | £166,704 | -1% |
128 Properties |
| 2005 | £168,259 | 10% |
50 Properties |
| 2004 | £150,984 | 2% |
84 Properties |
| 2003 | £148,658 | 16% |
85 Properties |
| 2002 | £124,292 | 22% |
111 Properties |
| 2001 | £97,013 | 26% |
90 Properties |
| 2000 | £72,273 | 3% |
92 Properties |
| 1999 | £70,370 | 17% |
81 Properties |
| 1998 | £58,518 | -3% |
77 Properties |
| 1997 | £60,179 | 11% |
102 Properties |
| 1996 | £53,505 | 8% |
83 Properties |
| 1995 | £49,011 | - |
69 Properties |
Property Price per Property Type in Ryde East
Here you can find historic sold price data in order to help with your property search.
The average Property Paid Price for specific property types in the last three years are:
| Property Type | Average Sold Price | Sold Properties |
|---|---|---|
| Semi Detached House | £275,331.00 | 54 Semi Detached Houses |
| Detached House | £378,401.00 | 50 Detached Houses |
| Terraced House | £258,800.00 | 10 Terraced Houses |
| Flat | £132,609.00 | 44 Flats |

