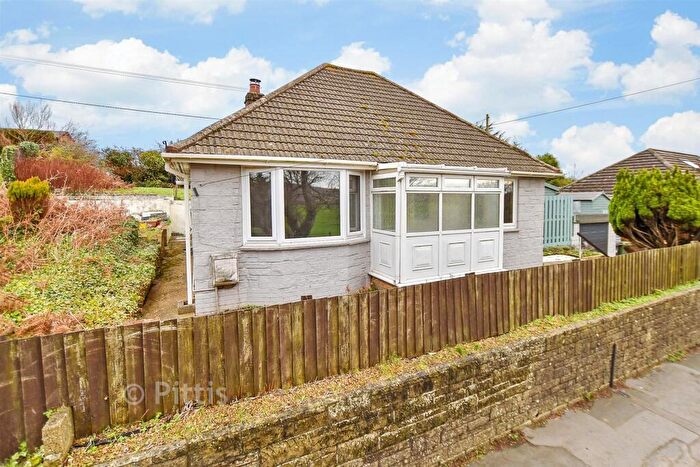
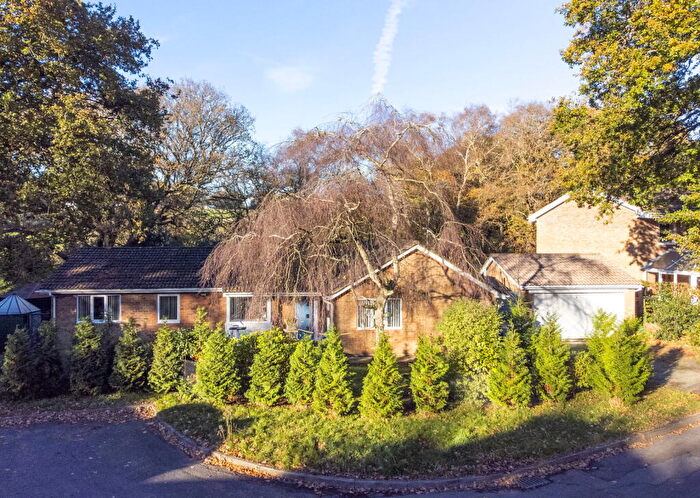
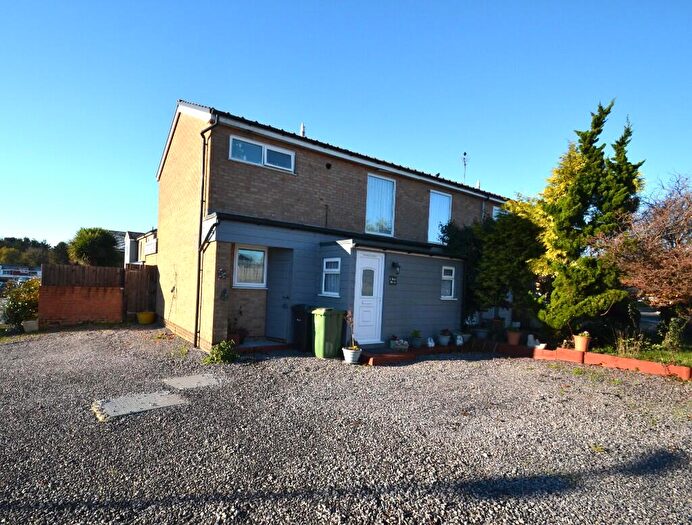
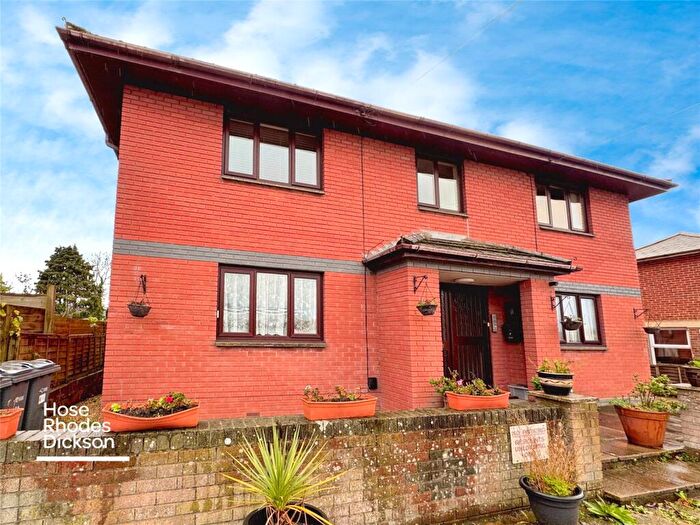
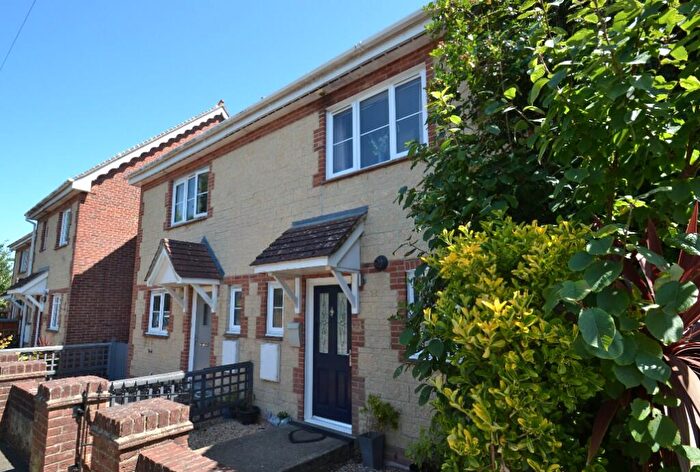
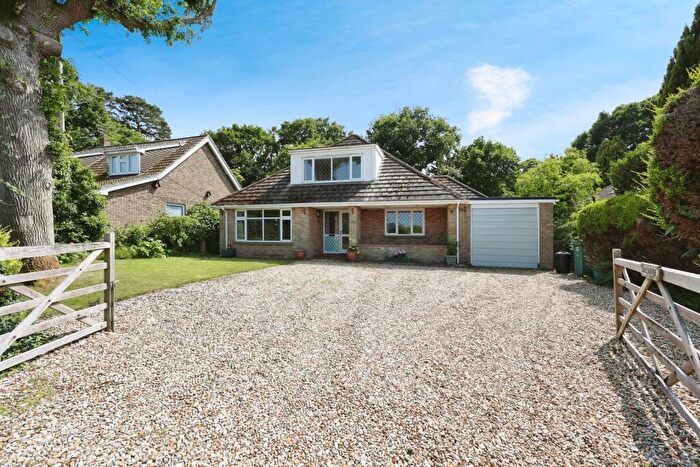
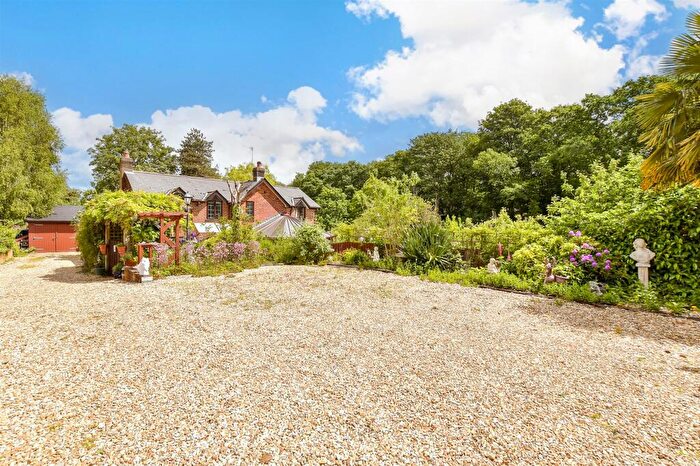
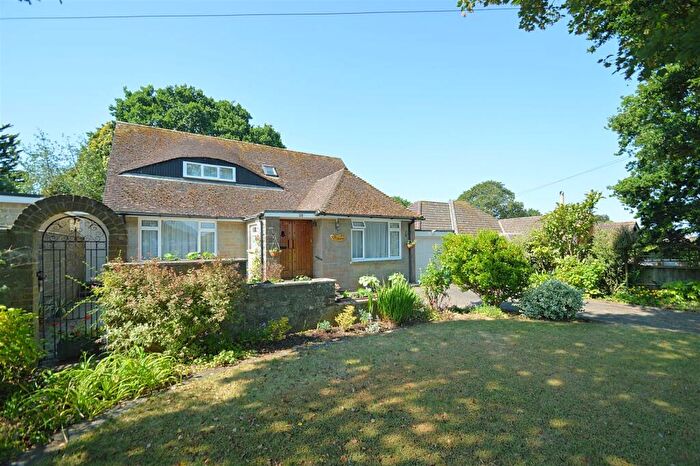
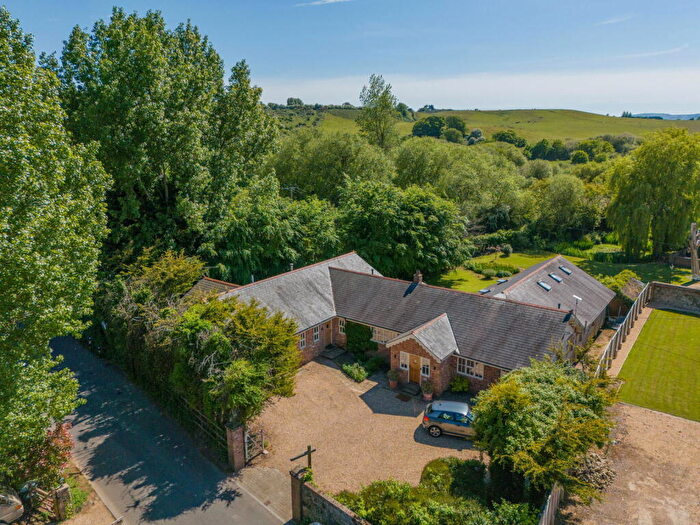
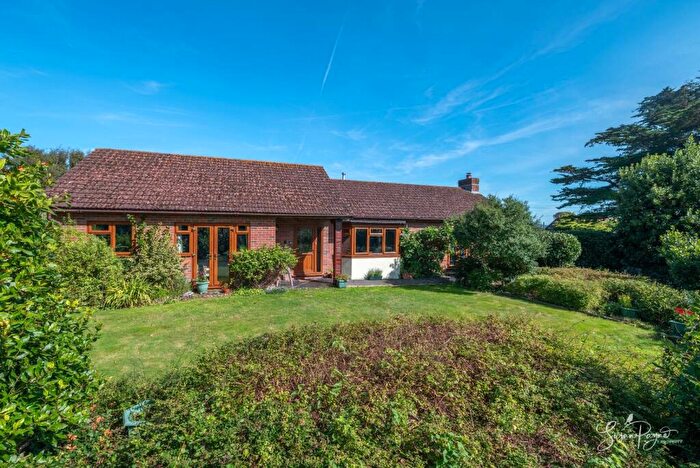
Houses for sale & to rent in Arreton And Newchurch, Sandown
House Prices in Arreton And Newchurch
Properties in Arreton And Newchurch have an average house price of £364,743.00 and had 116 Property Transactions within the last 3 years¹.
Arreton And Newchurch is an area in Sandown, Isle of Wight with 1,071 households², where the most expensive property was sold for £745,000.00.
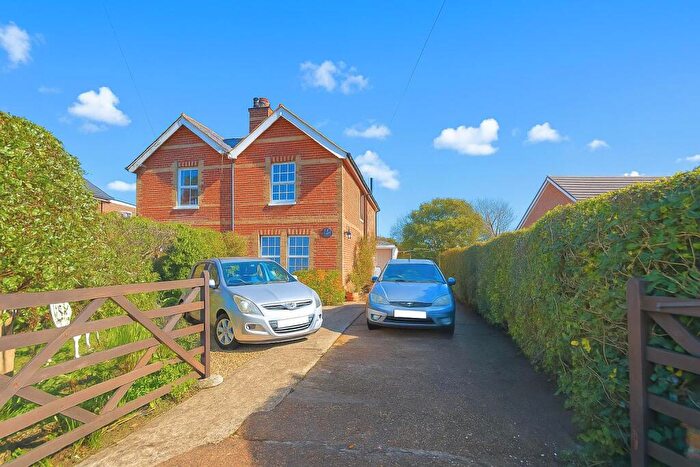
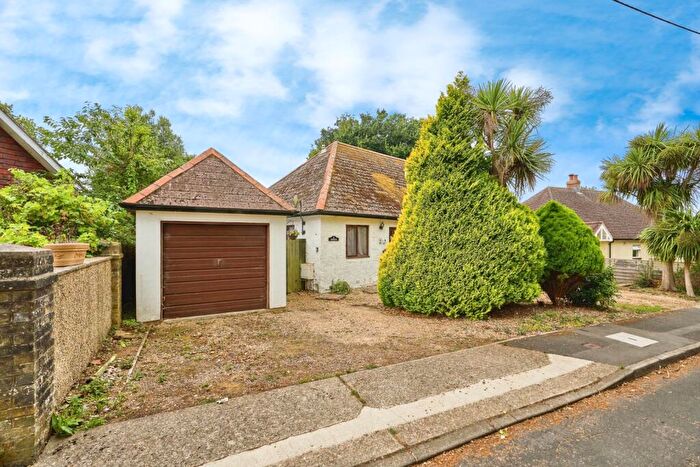
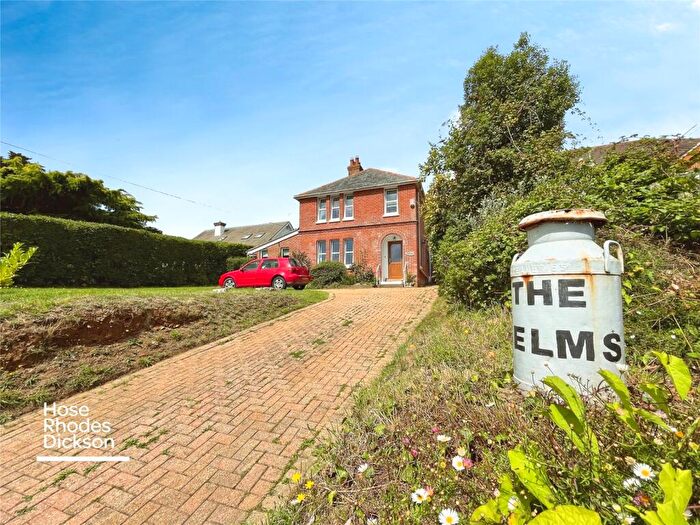
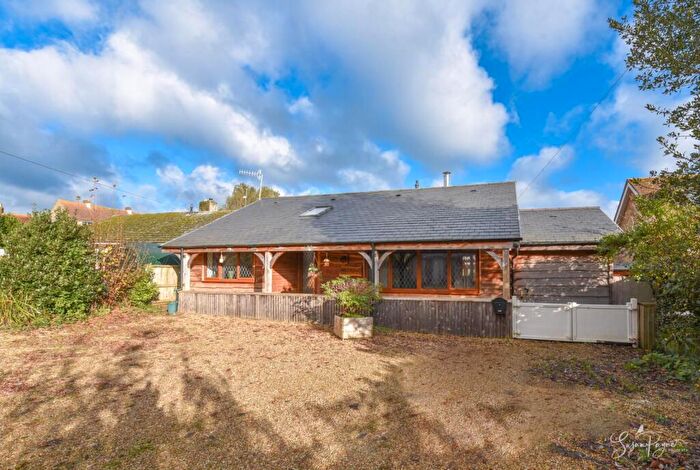
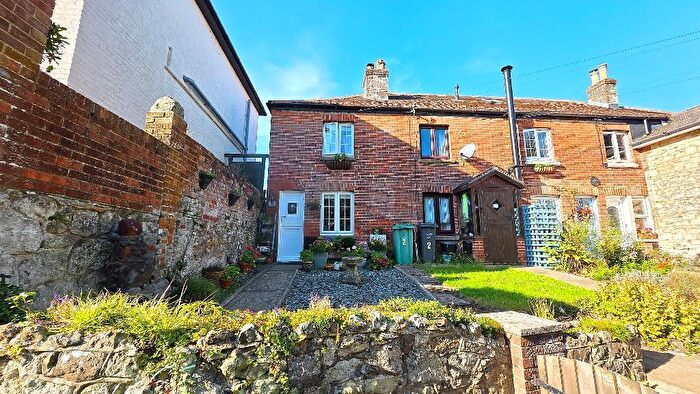
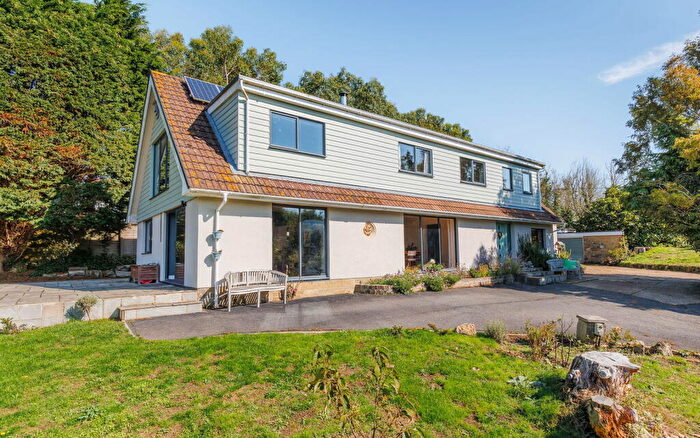
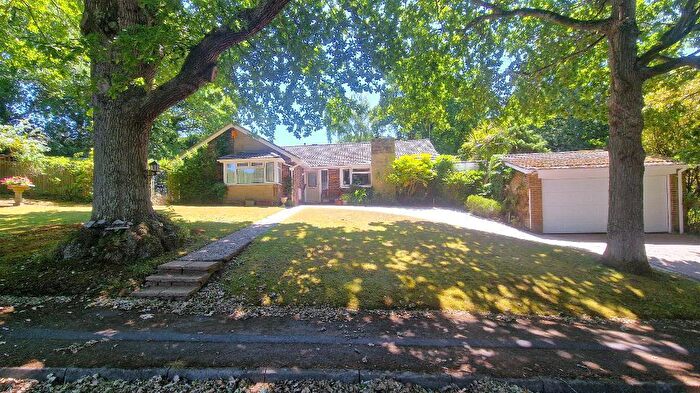
Properties for sale in Arreton And Newchurch
Roads and Postcodes in Arreton And Newchurch
Navigate through our locations to find the location of your next house in Arreton And Newchurch, Sandown for sale or to rent.
| Streets | Postcodes |
|---|---|
| Alverstone Road | PO36 0HD PO36 0LB PO36 0LD PO36 0LE PO36 0LF PO36 0LH PO36 0LJ PO36 0NY PO36 0NZ |
| Bartletts Close | PO36 0FB |
| Borthwood Lane | PO36 0HH |
| Burnt House Lane | PO36 0HB |
| Chambers Drive | PO36 0LR |
| Cupressus Avenue | PO36 0LA |
| Downsview | PO36 0NQ |
| Dyers Lane | PO36 0ND |
| Forest Dell | PO36 0LG |
| Forest Road | PO36 0JH PO36 0JY PO36 0JZ |
| Forest Way | PO36 0JJ PO36 0JL PO36 0JN PO36 0JW |
| Hale Common | PO36 0AF |
| Harbors Lake Lane | PO36 0LY |
| High Street | PO36 0NF PO36 0NH PO36 0NJ PO36 0NN |
| Hill Top | PO36 0NU |
| Hollowood Road | PO36 0HR |
| Knighton Shute | PO36 0NT |
| Langbridge | PO36 0NP |
| Longlands Lane | PO36 0NA |
| Lower Knighton Road | PO36 0NS |
| Main Road | PO36 0EX PO36 0EZ PO36 0HA |
| Mersley Lane | PO36 0NR |
| Milestone Crescent | PO36 0NG |
| Newport Road | PO36 0JR PO36 0LS PO36 9PJ |
| Palmers Lane | PO36 0PF |
| Parkway | PO36 0LN PO36 0LW |
| Princelett Shute | PO36 0JU |
| School Lane | PO36 0NL |
| Scotchells Brook Lane | PO36 0JP |
| Skinners Hill | PO36 0NX |
| The Brambles | PO36 0PX |
| The Chase | PO36 0PD |
| The Paddock | PO36 0LL |
| The Shute | PO36 0NW |
| Ventnor Road | PO36 0JT |
| Verbena Cottages | PO36 0JS |
| Wackland Lane | PO36 0NB |
| Watery Lane | PO36 0LX |
| Webster Way | PO36 0HS |
| Winford Road | PO36 0JX PO36 0LZ PO36 0NE |
| Winford Way | PO36 0LQ |
| Woods Drive | PO36 0LP PO36 0PR PO36 0PS |
| Woodside Avenue | PO36 0JD |
| Youngwoods Copse | PO36 0HJ |
| Youngwoods Way | PO36 0HE PO36 0HF |
| PO36 0EY PO36 0LT |
Transport near Arreton And Newchurch
- FAQ
- Price Paid By Year
- Property Type Price
Frequently asked questions about Arreton And Newchurch
What is the average price for a property for sale in Arreton And Newchurch?
The average price for a property for sale in Arreton And Newchurch is £364,743. This amount is 32% higher than the average price in Sandown. There are 496 property listings for sale in Arreton And Newchurch.
What streets have the most expensive properties for sale in Arreton And Newchurch?
The streets with the most expensive properties for sale in Arreton And Newchurch are Skinners Hill at an average of £690,000, Harbors Lake Lane at an average of £525,000 and Youngwoods Way at an average of £517,000.
What streets have the most affordable properties for sale in Arreton And Newchurch?
The streets with the most affordable properties for sale in Arreton And Newchurch are The Chase at an average of £160,000, Parkway at an average of £163,216 and Woods Drive at an average of £228,875.
Which train stations are available in or near Arreton And Newchurch?
Some of the train stations available in or near Arreton And Newchurch are Sandown, Lake and Shanklin.
Property Price Paid in Arreton And Newchurch by Year
The average sold property price by year was:
| Year | Average Sold Price | Price Change |
Sold Properties
|
|---|---|---|---|
| 2025 | £406,209 | 13% |
20 Properties |
| 2024 | £354,071 | -5% |
35 Properties |
| 2023 | £370,526 | 6% |
25 Properties |
| 2022 | £348,066 | -2% |
36 Properties |
| 2021 | £355,866 | 10% |
63 Properties |
| 2020 | £321,128 | 21% |
38 Properties |
| 2019 | £254,898 | -12% |
48 Properties |
| 2018 | £284,986 | -4% |
43 Properties |
| 2017 | £296,205 | 21% |
50 Properties |
| 2016 | £234,633 | -8% |
52 Properties |
| 2015 | £254,330 | -1% |
50 Properties |
| 2014 | £256,544 | 6% |
49 Properties |
| 2013 | £240,937 | 8% |
36 Properties |
| 2012 | £222,228 | -3% |
38 Properties |
| 2011 | £229,114 | -2% |
46 Properties |
| 2010 | £233,272 | -11% |
33 Properties |
| 2009 | £258,741 | 6% |
29 Properties |
| 2008 | £243,060 | -7% |
24 Properties |
| 2007 | £261,278 | 4% |
50 Properties |
| 2006 | £251,405 | 14% |
66 Properties |
| 2005 | £216,710 | 0,2% |
49 Properties |
| 2004 | £216,179 | 14% |
51 Properties |
| 2003 | £186,357 | 15% |
69 Properties |
| 2002 | £158,724 | 26% |
72 Properties |
| 2001 | £117,825 | 9% |
49 Properties |
| 2000 | £107,010 | 24% |
60 Properties |
| 1999 | £80,844 | 15% |
63 Properties |
| 1998 | £68,984 | -13% |
48 Properties |
| 1997 | £77,915 | 15% |
65 Properties |
| 1996 | £66,067 | 3% |
56 Properties |
| 1995 | £63,966 | - |
68 Properties |
Property Price per Property Type in Arreton And Newchurch
Here you can find historic sold price data in order to help with your property search.
The average Property Paid Price for specific property types in the last three years are:
| Property Type | Average Sold Price | Sold Properties |
|---|---|---|
| Semi Detached House | £318,555.00 | 17 Semi Detached Houses |
| Detached House | £448,017.00 | 72 Detached Houses |
| Terraced House | £219,450.00 | 11 Terraced Houses |
| Flat | £138,975.00 | 16 Flats |

