
Houses for sale & to rent in Sandown, Isle of Wight
House Prices in Sandown
Properties in Sandown have an average house price of £275k and had 730 Property Transactions within the last 3 years.¹
Sandown is an area in Isle of Wight with 7,333 households², where the most expensive property was sold for £950k.
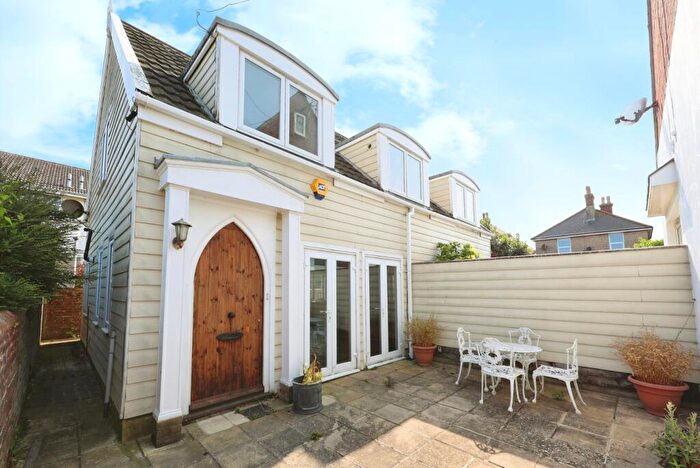
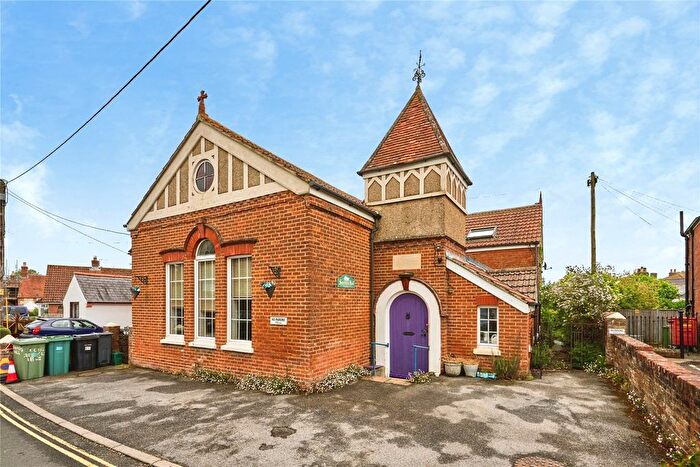
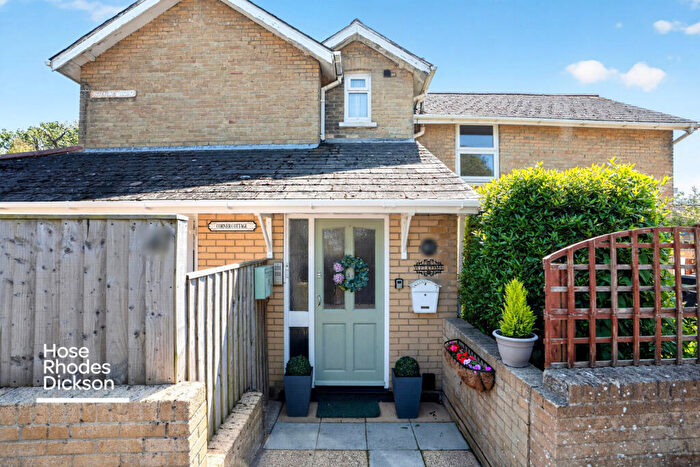
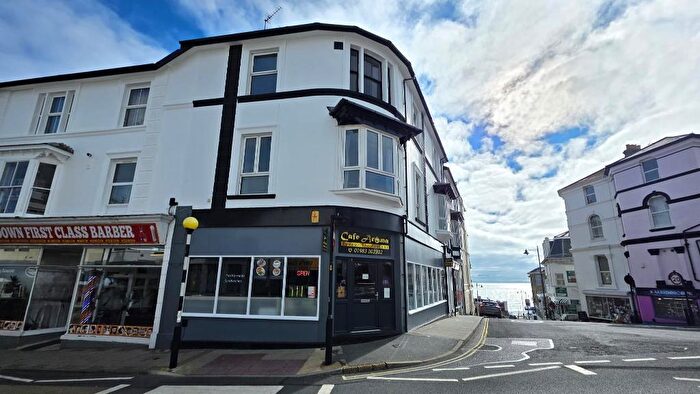
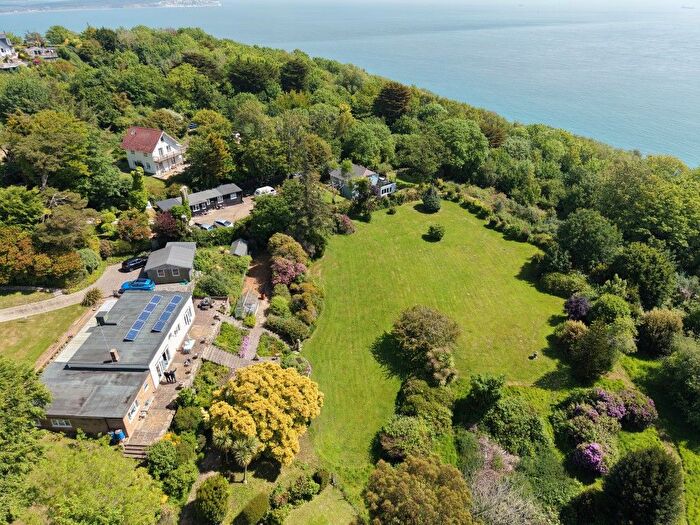
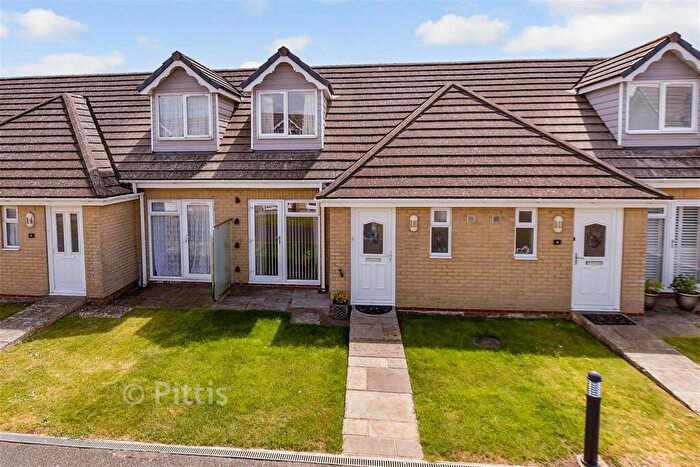
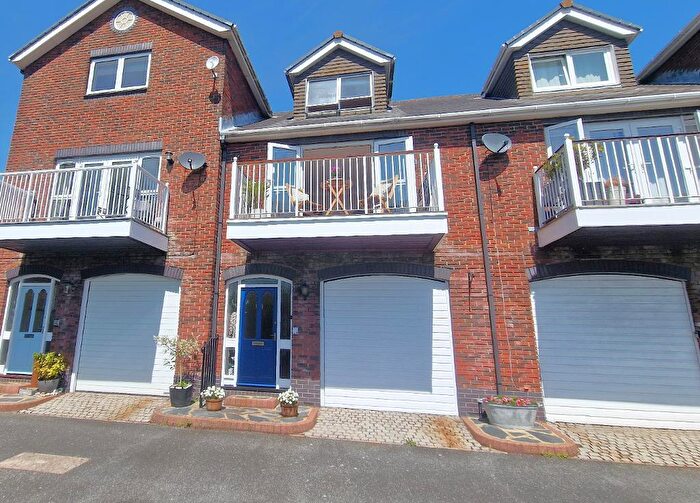
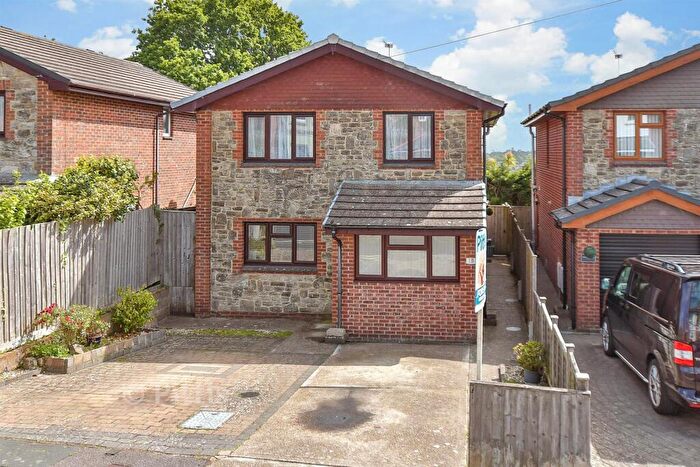
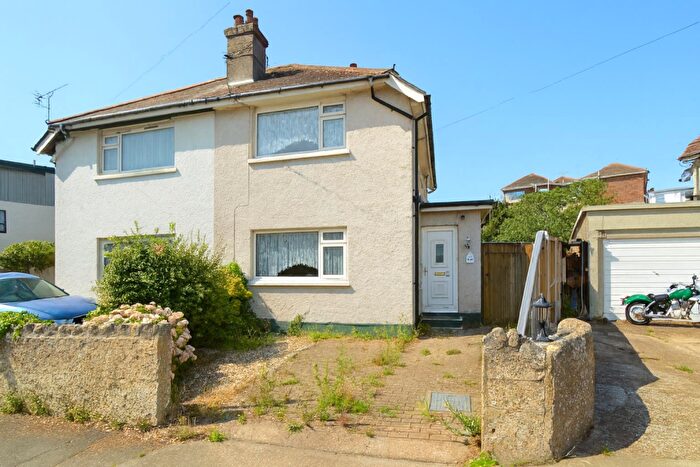
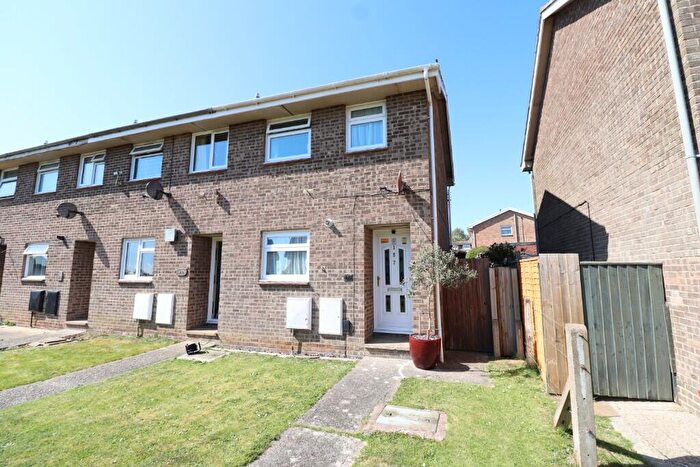
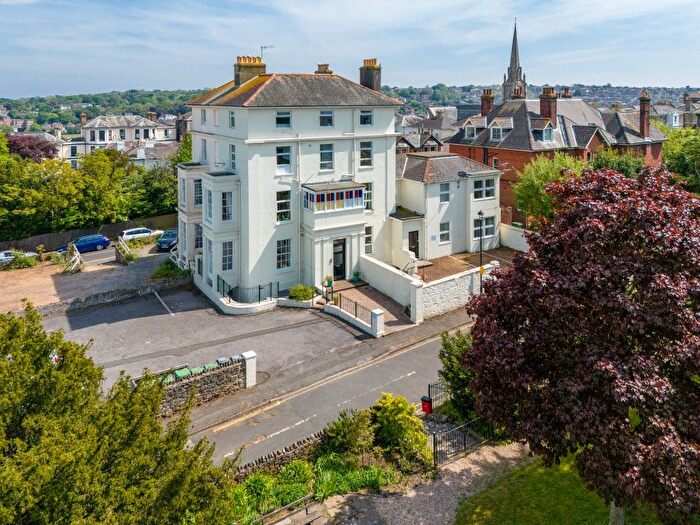
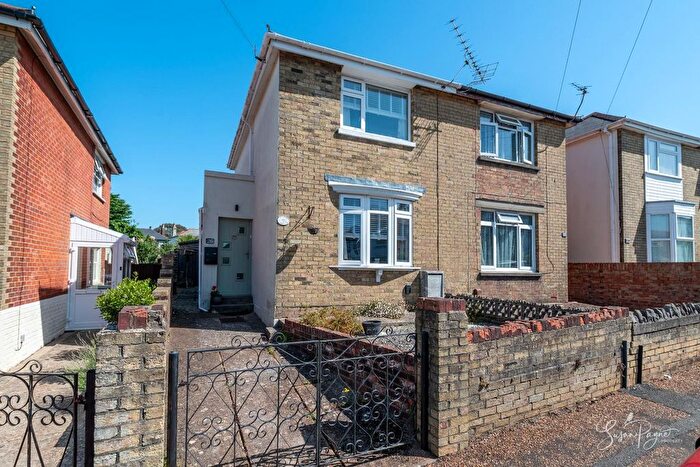
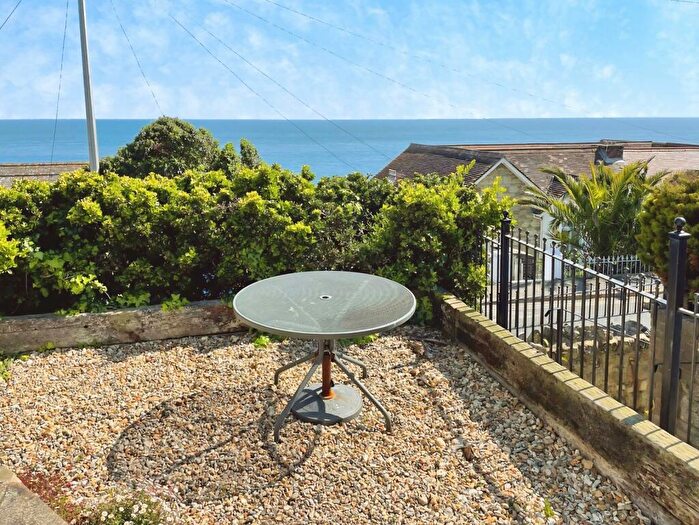
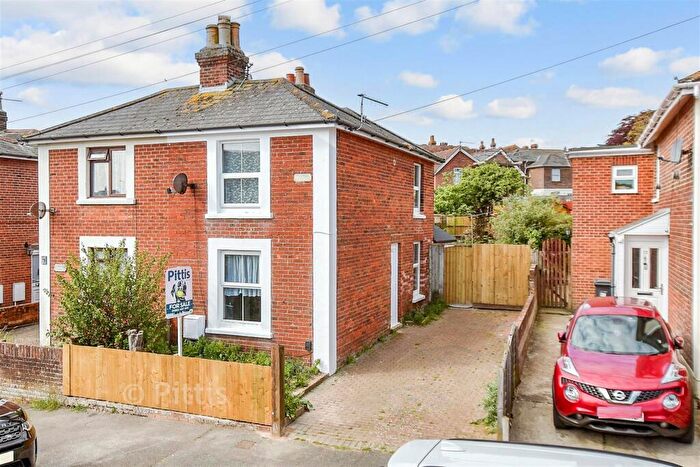
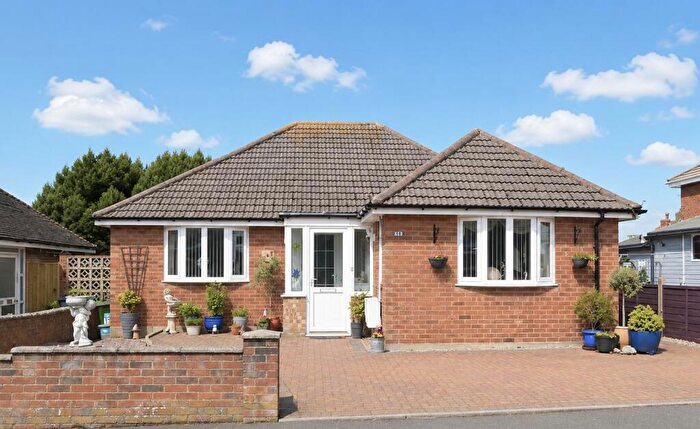
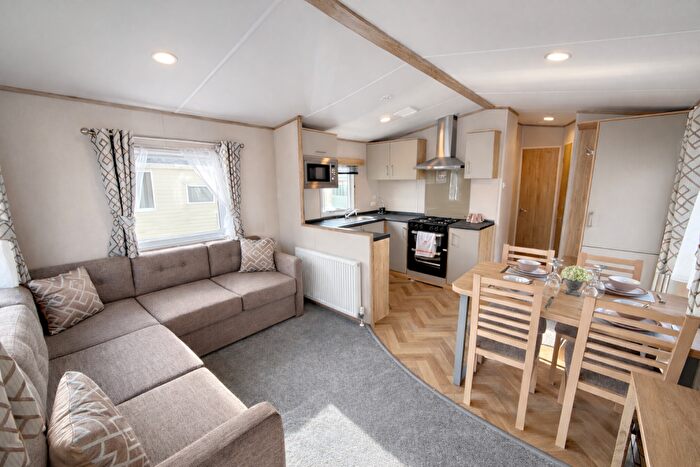
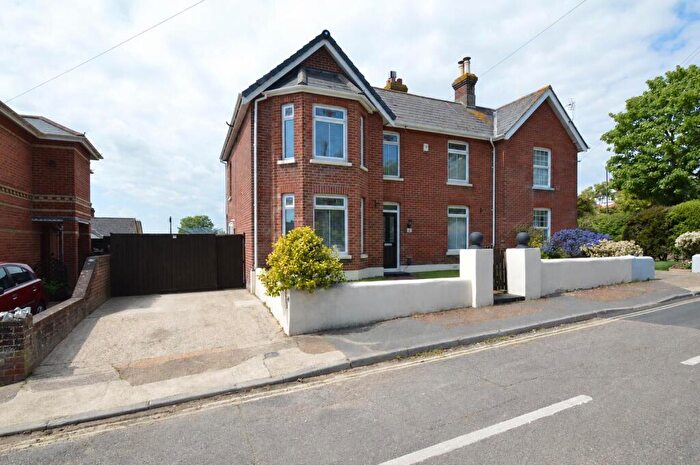
Properties for sale in Sandown
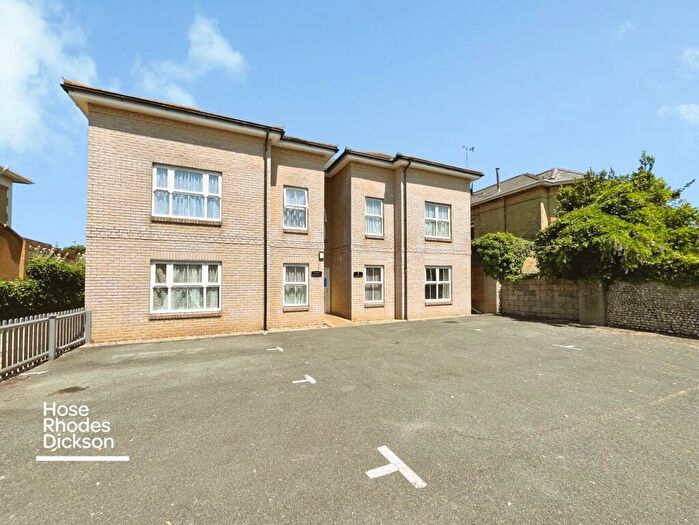
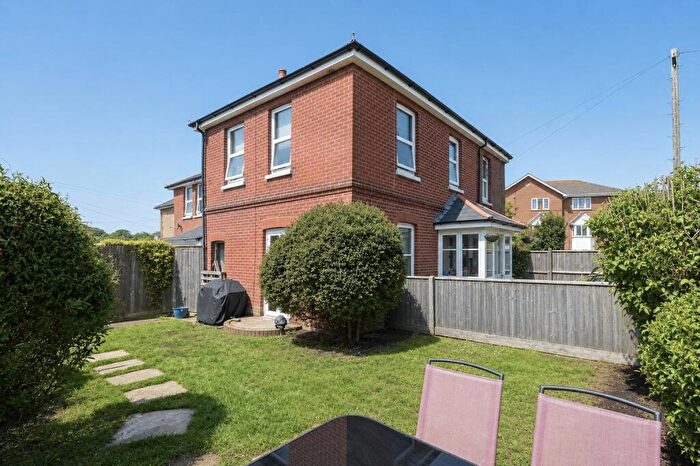
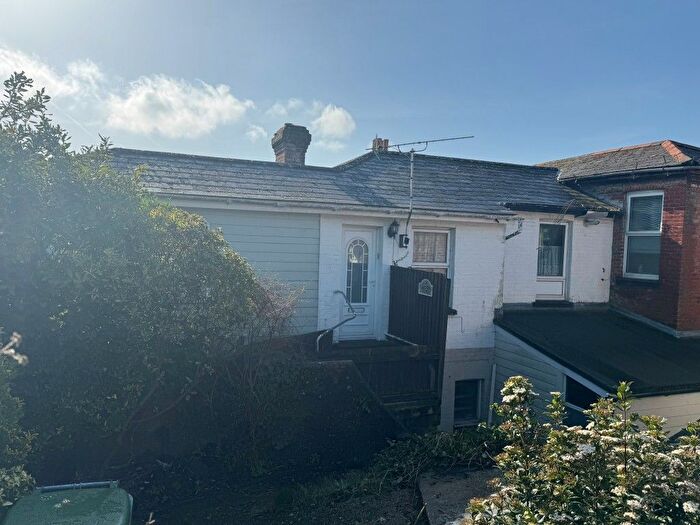
![]()
If you are looking to sell your house, let it out, or receive a property valuation, an expert can help you.
Click the button below to get started.
Neighbourhoods in Sandown
Navigate through our locations to find the location of your next house in Sandown, Isle of Wight for sale or to rent.
Transport in Sandown
Please see below transportation links in this area:

- FAQ
- Price Paid By Year
- Property Type Price
Frequently asked questions about Sandown
What is the average price for a property for sale in Sandown?
The average price for a property for sale in Sandown is £275,122. This amount is 7% lower than the average price in Isle of Wight. There are 7,578 property listings for sale in Sandown.
What locations have the most expensive properties for sale in Sandown?
The locations with the most expensive properties for sale in Sandown are Arreton And Newchurch at an average of £370,424, Brading, St Helens And Bembridge at an average of £285,903 and Sandown North at an average of £281,941.
What locations have the most affordable properties for sale in Sandown?
The locations with the most affordable properties for sale in Sandown are Sandown South at an average of £229,106, Lake North at an average of £260,402 and Lake South at an average of £267,212.
Which train stations are available in or near Sandown?
Some of the train stations available in or near Sandown are Sandown, Lake and Brading.
Property Price Paid in Sandown by Year
The average sold property price by year was:
| Year | Average Sold Price | Price Change |
Sold Properties
|
|---|---|---|---|
| 2026 | £316,770 | 14% |
17 Properties |
| 2025 | £271,601 | 1% |
227 Properties |
| 2024 | £270,104 | -4% |
273 Properties |
| 2023 | £281,982 | 2% |
213 Properties |
| 2022 | £276,457 | 4% |
300 Properties |
| 2021 | £265,394 | 14% |
387 Properties |
| 2020 | £227,958 | 4% |
259 Properties |
| 2019 | £218,747 | 6% |
340 Properties |
| 2018 | £206,669 | -2% |
338 Properties |
| 2017 | £210,574 | 10% |
354 Properties |
| 2016 | £189,633 | -1% |
370 Properties |
| 2015 | £191,851 | 6% |
330 Properties |
| 2014 | £180,594 | -1% |
358 Properties |
| 2013 | £183,024 | 6% |
288 Properties |
| 2012 | £172,141 | -2% |
256 Properties |
| 2011 | £175,762 | 1% |
266 Properties |
| 2010 | £173,250 | 2% |
266 Properties |
| 2009 | £170,648 | -8% |
285 Properties |
| 2008 | £183,641 | -5% |
225 Properties |
| 2007 | £192,630 | 6% |
468 Properties |
| 2006 | £180,581 | 10% |
525 Properties |
| 2005 | £162,740 | 0,2% |
372 Properties |
| 2004 | £162,438 | 13% |
478 Properties |
| 2003 | £140,822 | 16% |
470 Properties |
| 2002 | £117,954 | 16% |
549 Properties |
| 2001 | £99,074 | 14% |
419 Properties |
| 2000 | £85,294 | 17% |
460 Properties |
| 1999 | £70,867 | 10% |
488 Properties |
| 1998 | £64,051 | 10% |
437 Properties |
| 1997 | £57,797 | 10% |
486 Properties |
| 1996 | £51,950 | -0,1% |
372 Properties |
| 1995 | £52,005 | - |
367 Properties |
Property Price per Property Type in Sandown
Here you can find historic sold price data in order to help with your property search.
The average Property Paid Price for specific property types in the last three years are:
| Property Type | Average Sold Price | Sold Properties |
|---|---|---|
| Semi Detached House | £265,034.00 | 172 Semi Detached Houses |
| Detached House | £372,959.00 | 290 Detached Houses |
| Terraced House | £212,284.00 | 112 Terraced Houses |
| Flat | £149,480.00 | 156 Flats |