
Houses for sale & to rent in PO37 6QL, Victoria Avenue, Shanklin Central, Shanklin
House Prices in PO37 6QL, Victoria Avenue, Shanklin Central
Properties in PO37 6QL have no sales history available within the last 3 years. PO37 6QL is a postcode in Victoria Avenue located in Shanklin Central, an area in Shanklin, Isle of Wight, with 3 households².
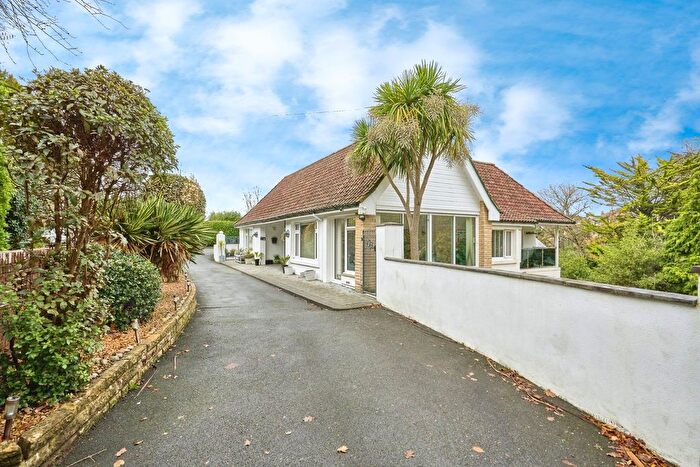
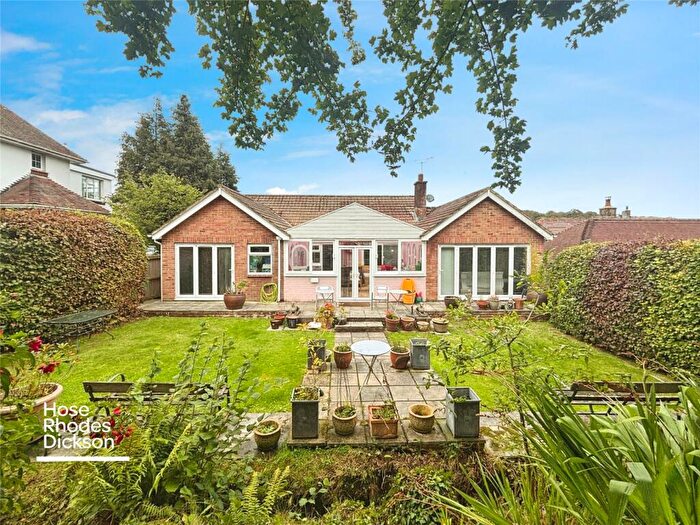
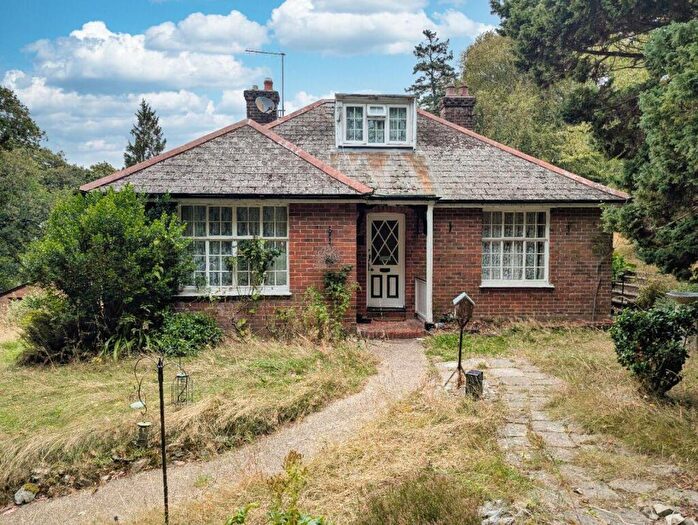
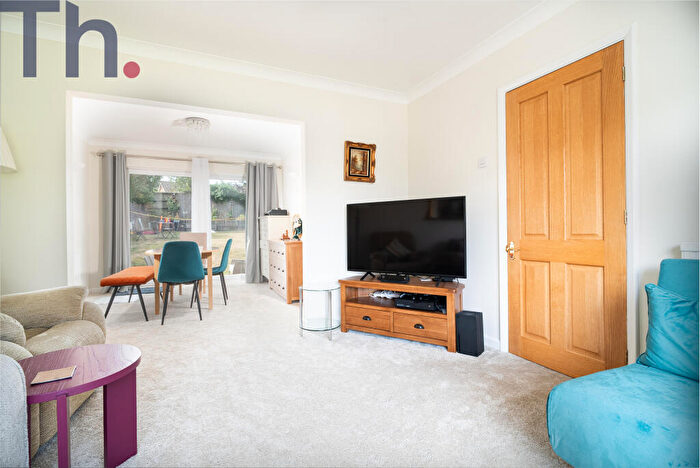
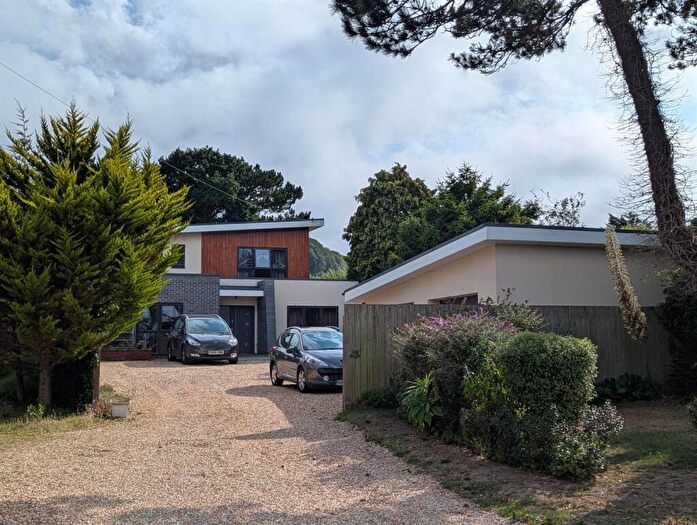
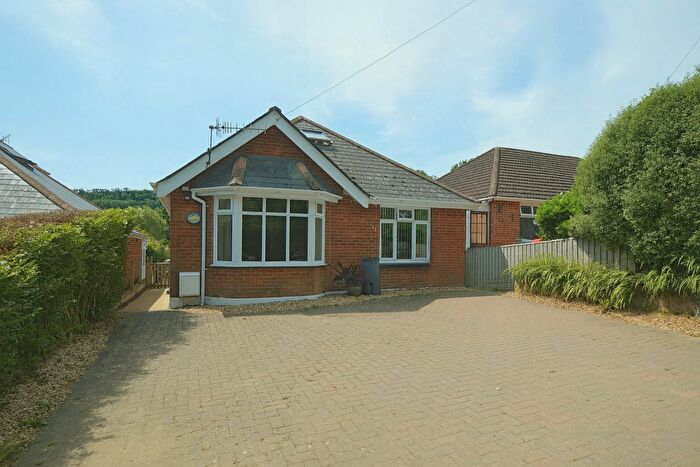
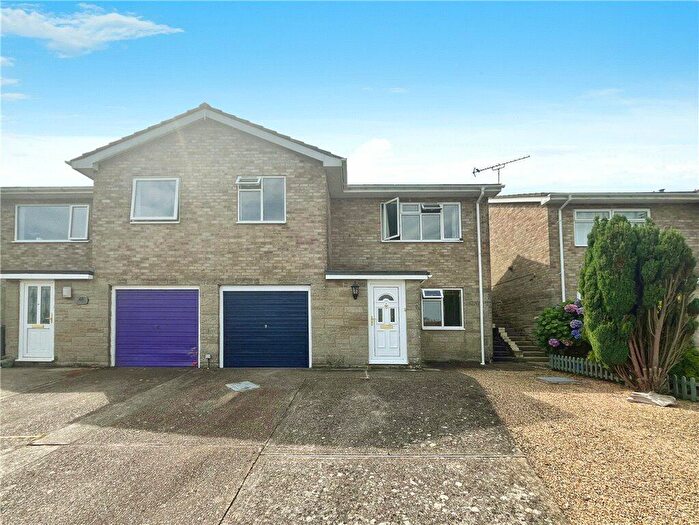
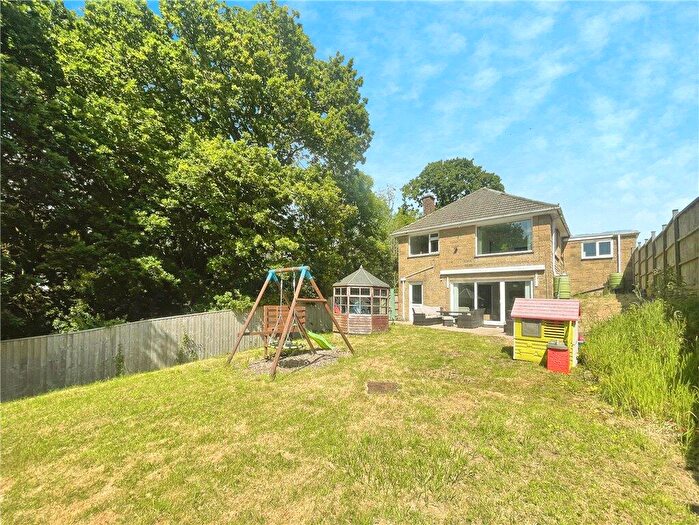
Properties for sale near PO37 6QL, Victoria Avenue


![]()
If you are looking to sell your house, let it out, or receive a property valuation, an expert can help you.
Click the button below to get started.
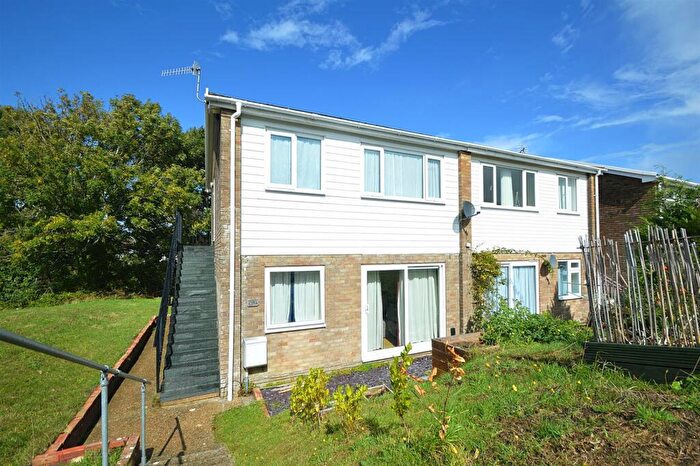
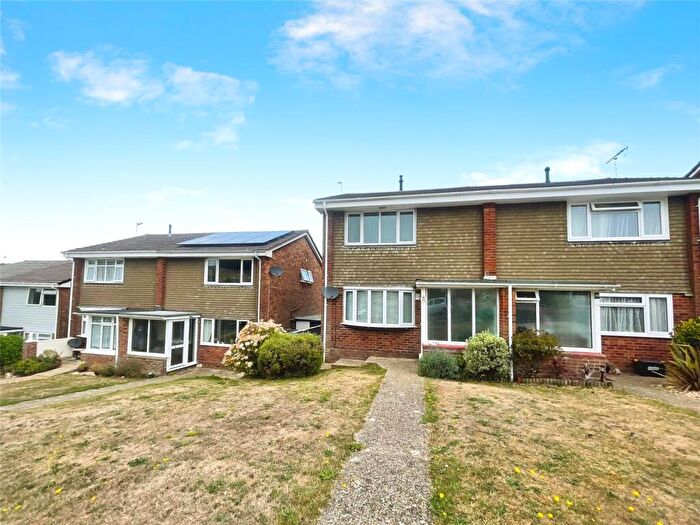
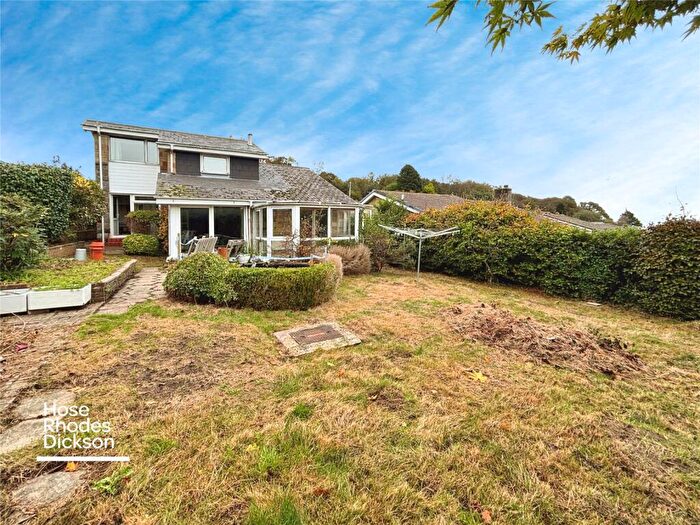
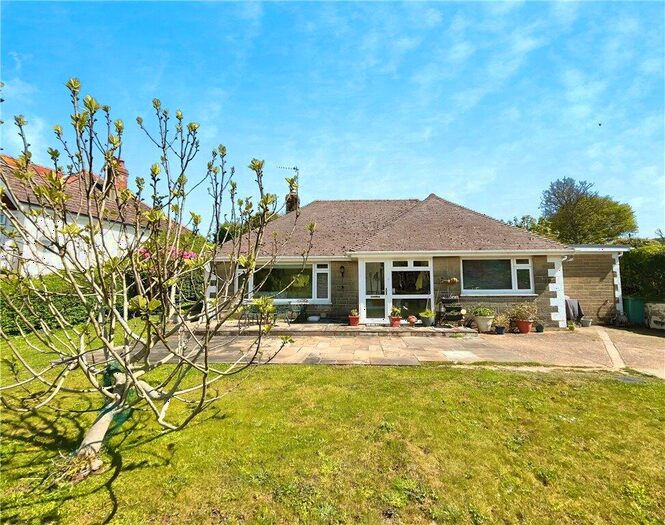

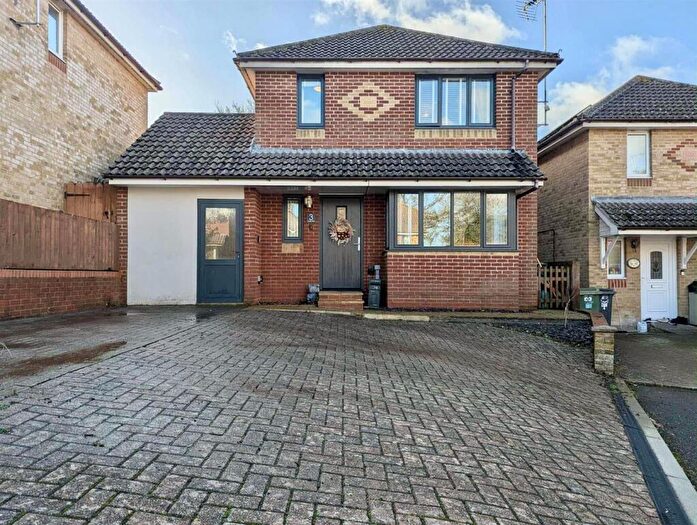
Previously listed properties near PO37 6QL, Victoria Avenue
Price Paid in Victoria Avenue, PO37 6QL, Shanklin Central
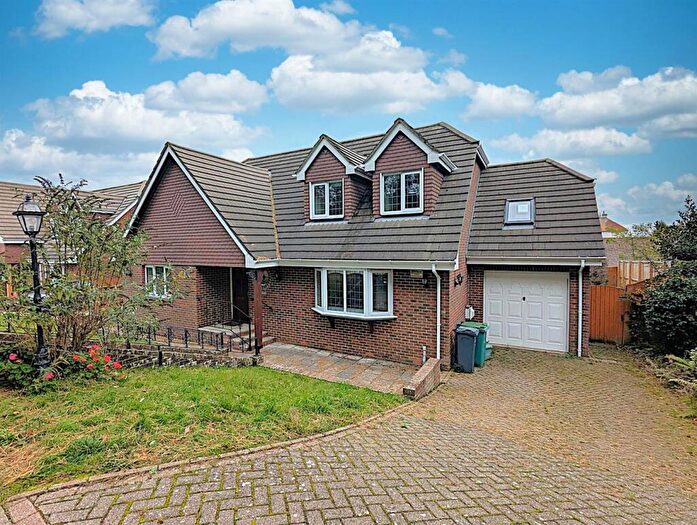
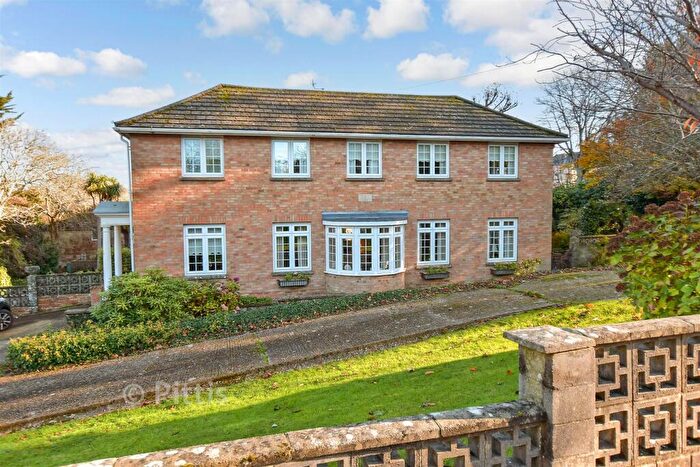
116 Victoria Avenue, PO37 6QL, Shanklin Central Shanklin
Property 116 has been sold 3 times. The last time it was sold was in 29/11/2013 and the sold price was £370,000.00.
This detached house, sold as a freehold on 29/11/2013, is a 116 sqm detached house with an EPC rating of E.
| Date | Price | Property Type | Tenure | Classification |
|---|---|---|---|---|
| 29/11/2013 | £370,000.00 | Detached House | freehold | Established Building |
| 20/09/2012 | £325,000.00 | Detached House | freehold | Established Building |
| 14/01/2011 | £320,000.00 | Detached House | freehold | Established Building |
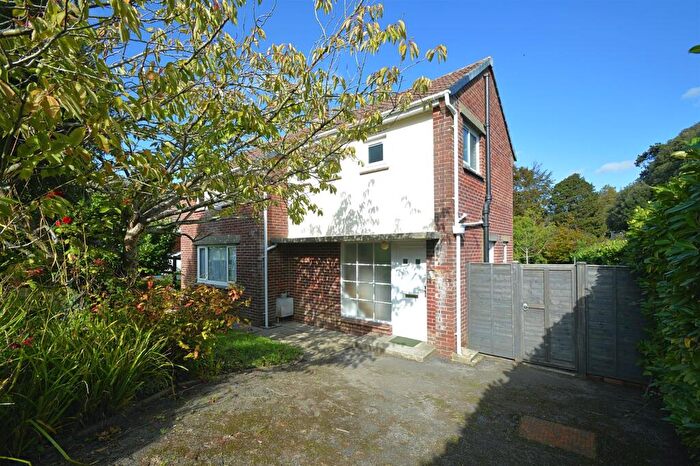
111 Victoria Avenue, PO37 6QL, Shanklin Central Shanklin
Property 111 has been sold 4 times. The last time it was sold was in 21/06/2005 and the sold price was £350,000.00.
This is a Detached House which was sold as a freehold in 21/06/2005
| Date | Price | Property Type | Tenure | Classification |
|---|---|---|---|---|
| 21/06/2005 | £350,000.00 | Detached House | freehold | Established Building |
| 02/08/2004 | £330,000.00 | Detached House | freehold | Established Building |
| 28/02/2001 | £111,500.00 | Detached House | freehold | Established Building |
| 18/07/1999 | £76,000.00 | Detached House | freehold | Established Building |
Transport near PO37 6QL, Victoria Avenue

House price paid reports for PO37 6QL, Victoria Avenue
Click on the buttons below to see price paid reports by year or property price:
- Price Paid By Year
Property Price Paid in PO37 6QL, Victoria Avenue by Year
The average sold property price by year was:
| Year | Average Sold Price | Price Change |
Sold Properties
|
|---|---|---|---|
| 2013 | £370,000 | 12% |
1 Property |
| 2012 | £325,000 | 2% |
1 Property |
| 2011 | £320,000 | -9% |
1 Property |
| 2005 | £350,000 | 6% |
1 Property |
| 2004 | £330,000 | 66% |
1 Property |
| 2001 | £111,500 | 32% |
1 Property |
| 1999 | £76,000 | - |
1 Property |