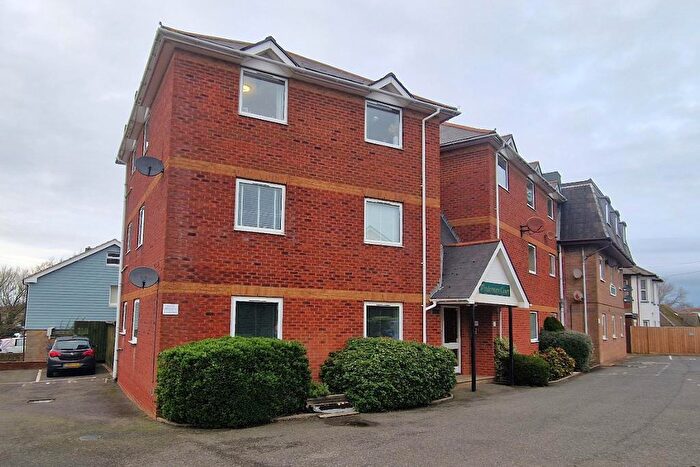
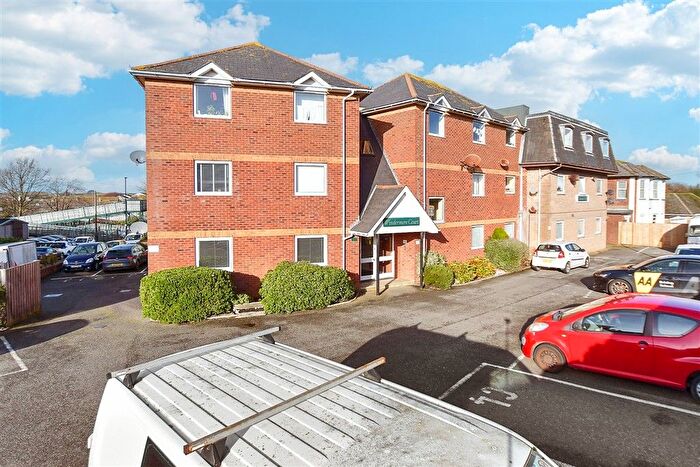
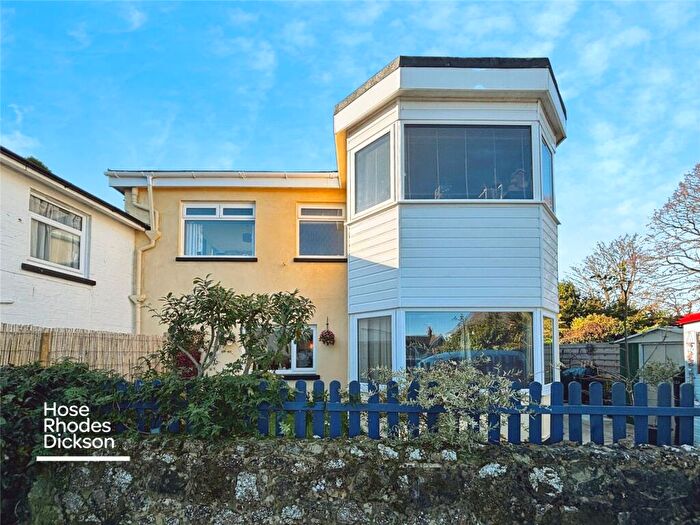
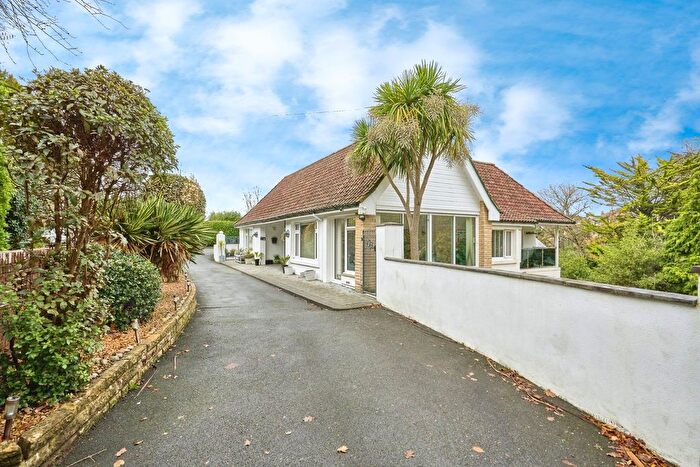
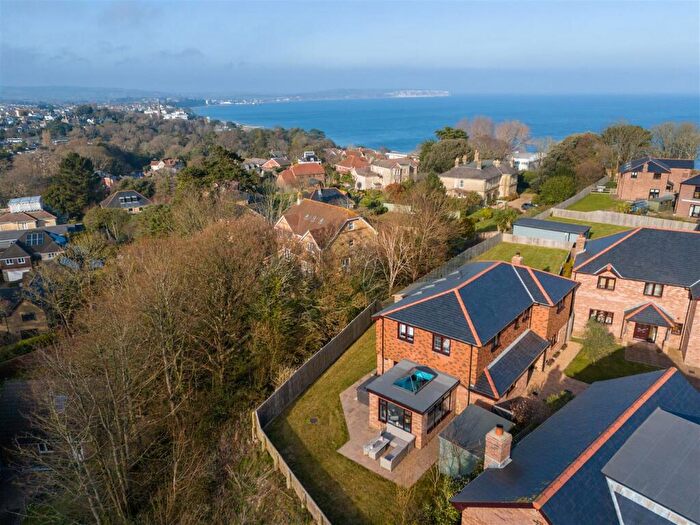
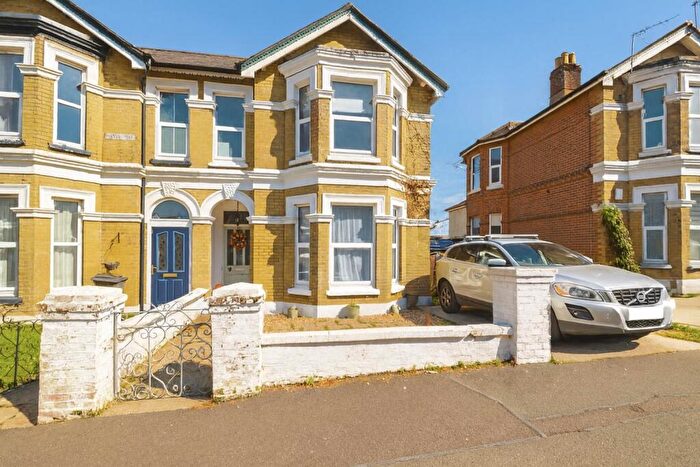
Houses for sale & to rent in Shanklin Central, Shanklin
House Prices in Shanklin Central
Properties in Shanklin Central have an average house price of £251,418.00 and had 214 Property Transactions within the last 3 years¹.
Shanklin Central is an area in Shanklin, Isle of Wight with 1,532 households², where the most expensive property was sold for £757,500.00.
Properties for sale in Shanklin Central
Roads and Postcodes in Shanklin Central
Navigate through our locations to find the location of your next house in Shanklin Central, Shanklin for sale or to rent.
| Streets | Postcodes |
|---|---|
| America Wood Cottages | PO37 7PT |
| Apse Manor Road | PO37 7PW |
| Arthurs Hill | PO37 6EE PO37 6EF PO37 6EU PO37 6EW PO37 6EX PO37 6EY PO37 6EZ |
| Atherley Cross Road | PO37 7AX |
| Atherley Park Close | PO37 7BE |
| Atherley Park Way | PO37 7AZ |
| Atherley Road | PO37 7AT PO37 7AU PO37 7BF |
| Avenue Road | PO37 7BG |
| Batts Road | PO37 7NU |
| Beatrice Avenue | PO37 6EN |
| Blythe Way | PO37 7NH PO37 7NJ PO37 7NL |
| Brockwood Drive | PO37 7JN |
| Brook Road | PO37 7LD PO37 7LW |
| Carter Avenue | PO37 7LF PO37 7LG PO37 7LQ PO37 7NG PO37 7NQ |
| Carter Road | PO37 7HR |
| Clarence Gardens | PO37 6HA |
| Clarence Road | PO37 7BH |
| Clarendon Road | PO37 6DP |
| Cliff View Mews | PO37 6FA |
| Collingwood Road | PO37 7LP |
| Crescent Road | PO37 6DH PO37 6DR PO37 6EJ PO37 6DJ |
| Culver Road | PO37 6ER |
| Denny Gardens | PO37 7JW |
| Donnington Drive | PO37 7JA |
| Dracaena Gardens | PO37 7JQ |
| Duncroft Gardens | PO37 7JJ |
| East Mount Road | PO37 6DN PO37 6DS PO37 6EB PO37 6DL |
| Falcon Cross Road | PO37 7LA |
| Green Lane | PO37 7JF PO37 7JH |
| Hollybrooke Close | PO37 7PD |
| Hope Road | PO37 6EA PO37 6EG PO37 6EL PO37 6FF PO37 6ED PO37 6EH |
| Howard Road | PO37 6HD |
| Hyde Road | PO37 7JZ PO37 7LE |
| Josephs Way | PO37 7JT |
| Landguard Manor Road | PO37 7HZ PO37 7JD PO37 7HY PO37 7QB |
| Landguard Road | PO37 7HT PO37 7HU PO37 7JY PO37 7JR |
| Languard Road | PO37 7LL |
| Lower Hyde Road | PO37 7LJ |
| Lucerne Road | PO37 7JL |
| Magnum Hall | PO37 6HJ |
| Marine Cross Road | PO37 7BB |
| Milford Road | PO37 7BQ |
| Newbridge Close | PO37 7AY |
| North Road | PO37 6DE PO37 6DF |
| Northcliff Gardens | PO37 6ES |
| Oak Hills | PO37 7QJ |
| Pierrellen Gardens | PO37 7JG |
| Queens Road | PO37 6DQ PO37 6DG |
| Regent Street | PO37 7AE PO37 7AP PO37 7BP PO37 7AJ PO37 7AR PO37 7BJ PO37 7BL |
| Sandown Road | PO37 6HF |
| Silver Trees | PO37 7ND |
| Spring Gardens | PO37 7AQ |
| St Boniface Cliff Road | PO37 6ET |
| St Martins Avenue | PO37 6HB |
| St Pauls Avenue | PO37 7AH PO37 7AL |
| St Pauls Crescent | PO37 7AN PO37 7AW |
| Station Approach | PO37 7AS PO37 7HX |
| Upper Hyde Farm Lane | PO37 7PS |
| Upper Hyde Lane | PO37 7PR |
| Victoria Avenue | PO37 6QL |
| Wilton Park Road | PO37 7BT PO37 7BU PO37 7BW |
| Witbank Close | PO37 7DQ |
| Witbank Gardens | PO37 7DH PO37 7JE |
Transport near Shanklin Central
- FAQ
- Price Paid By Year
- Property Type Price
Frequently asked questions about Shanklin Central
What is the average price for a property for sale in Shanklin Central?
The average price for a property for sale in Shanklin Central is £251,418. This amount is 11% lower than the average price in Shanklin. There are 1,523 property listings for sale in Shanklin Central.
What streets have the most expensive properties for sale in Shanklin Central?
The streets with the most expensive properties for sale in Shanklin Central are Upper Hyde Farm Lane at an average of £526,250, Clarence Gardens at an average of £472,500 and St Pauls Crescent at an average of £415,000.
What streets have the most affordable properties for sale in Shanklin Central?
The streets with the most affordable properties for sale in Shanklin Central are Landguard Road at an average of £143,400, Hope Road at an average of £160,054 and Avenue Road at an average of £166,250.
Which train stations are available in or near Shanklin Central?
Some of the train stations available in or near Shanklin Central are Shanklin, Lake and Sandown.
Property Price Paid in Shanklin Central by Year
The average sold property price by year was:
| Year | Average Sold Price | Price Change |
Sold Properties
|
|---|---|---|---|
| 2025 | £242,604 | -11% |
37 Properties |
| 2024 | £268,956 | 10% |
47 Properties |
| 2023 | £243,232 | -3% |
50 Properties |
| 2022 | £250,308 | -8% |
80 Properties |
| 2021 | £269,308 | 6% |
79 Properties |
| 2020 | £253,028 | 12% |
69 Properties |
| 2019 | £222,444 | -4% |
75 Properties |
| 2018 | £230,518 | 19% |
95 Properties |
| 2017 | £187,843 | -5% |
123 Properties |
| 2016 | £196,460 | -2% |
105 Properties |
| 2015 | £199,808 | 5% |
110 Properties |
| 2014 | £189,904 | 8% |
84 Properties |
| 2013 | £174,473 | -3% |
63 Properties |
| 2012 | £179,379 | -4% |
59 Properties |
| 2011 | £186,197 | -4% |
52 Properties |
| 2010 | £193,562 | 15% |
48 Properties |
| 2009 | £165,085 | -12% |
61 Properties |
| 2008 | £184,167 | -2% |
53 Properties |
| 2007 | £188,237 | -9% |
103 Properties |
| 2006 | £205,036 | 12% |
92 Properties |
| 2005 | £180,361 | -1% |
73 Properties |
| 2004 | £181,889 | 19% |
98 Properties |
| 2003 | £148,141 | 12% |
107 Properties |
| 2002 | £129,802 | 18% |
117 Properties |
| 2001 | £106,047 | 19% |
107 Properties |
| 2000 | £85,992 | 7% |
90 Properties |
| 1999 | £80,149 | 17% |
105 Properties |
| 1998 | £66,920 | 1% |
80 Properties |
| 1997 | £66,303 | 18% |
113 Properties |
| 1996 | £54,192 | 7% |
89 Properties |
| 1995 | £50,558 | - |
86 Properties |
Property Price per Property Type in Shanklin Central
Here you can find historic sold price data in order to help with your property search.
The average Property Paid Price for specific property types in the last three years are:
| Property Type | Average Sold Price | Sold Properties |
|---|---|---|
| Semi Detached House | £295,905.00 | 68 Semi Detached Houses |
| Detached House | £345,127.00 | 54 Detached Houses |
| Terraced House | £217,245.00 | 10 Terraced Houses |
| Flat | £156,982.00 | 82 Flats |

