
Houses for sale & to rent in PO37 6LD, Yarborough Arcade, Shanklin South, Shanklin
House Prices in PO37 6LD, Yarborough Arcade, Shanklin South
Properties in PO37 6LD have no sales history available within the last 3 years. PO37 6LD is a postcode in Yarborough Arcade located in Shanklin South, an area in Shanklin, Isle of Wight, with 10 households².
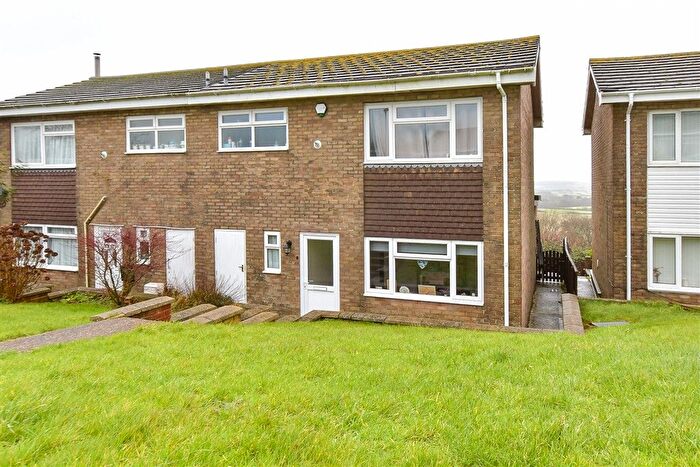
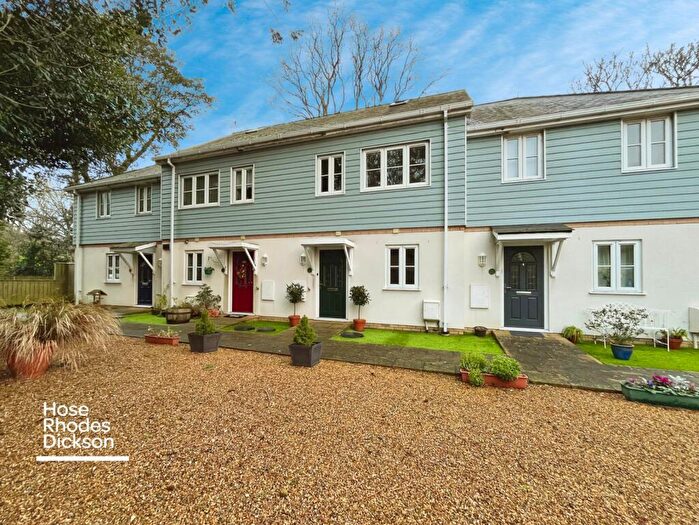
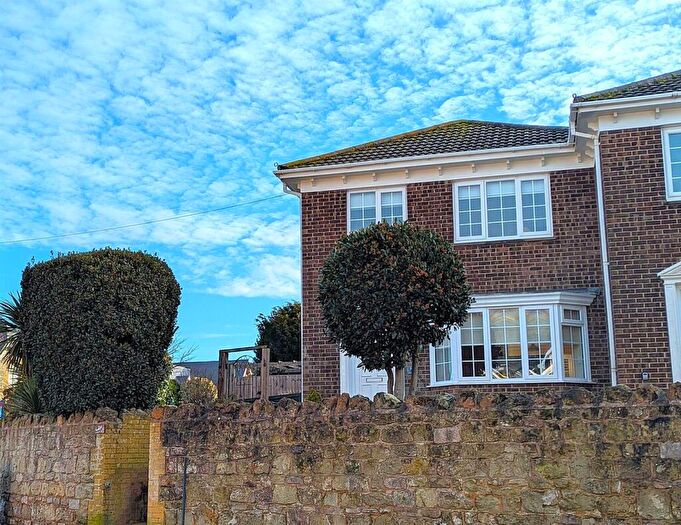
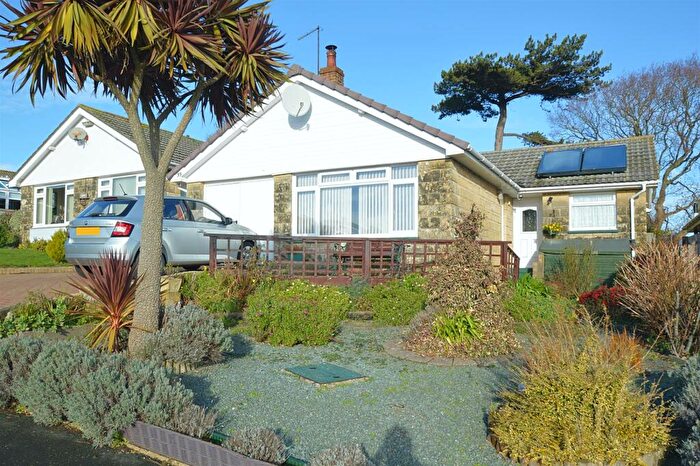
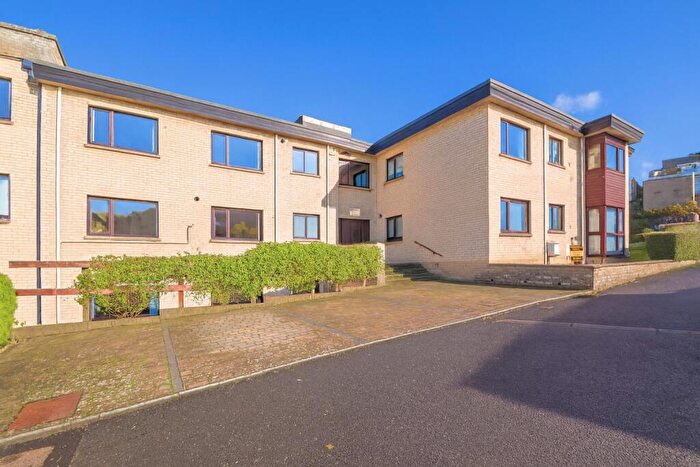
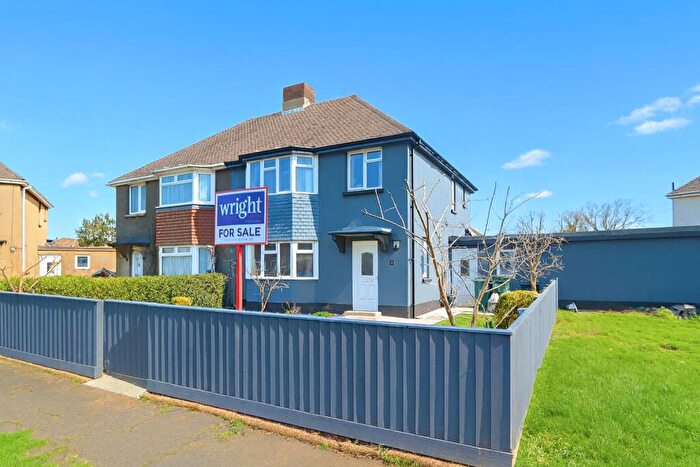
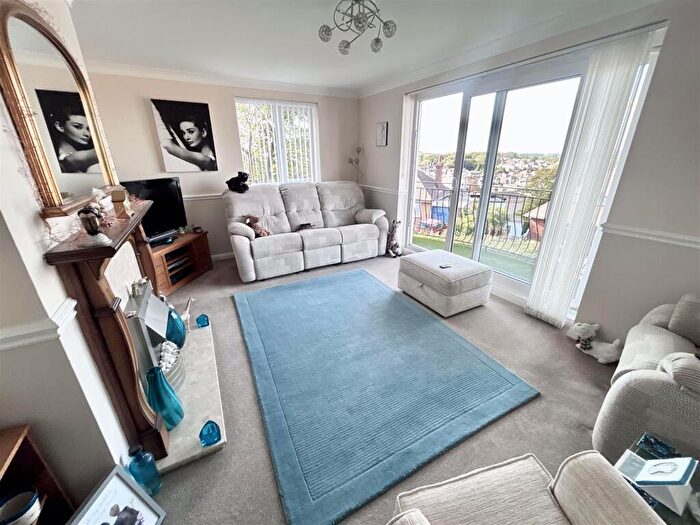
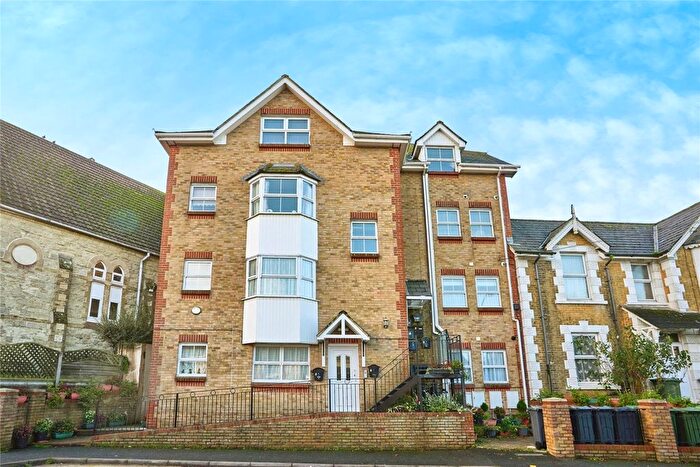
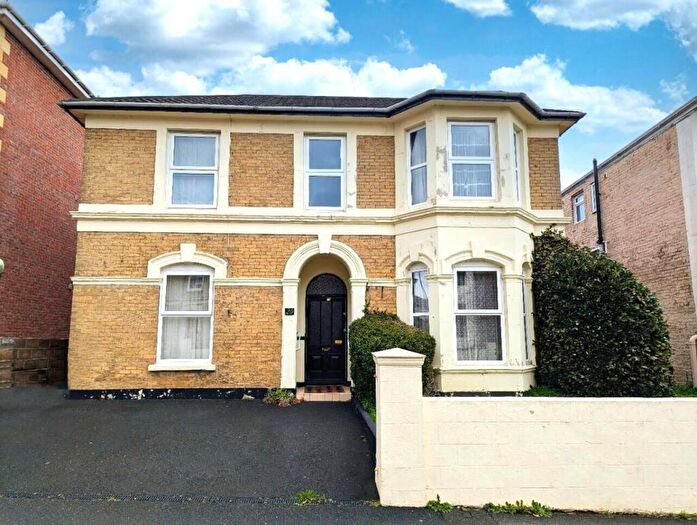
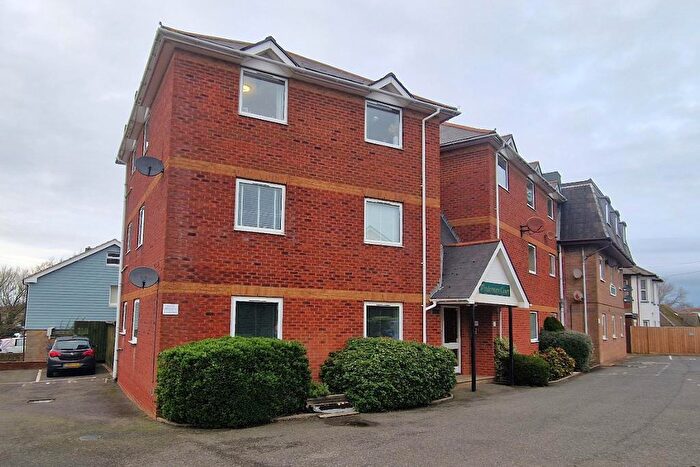
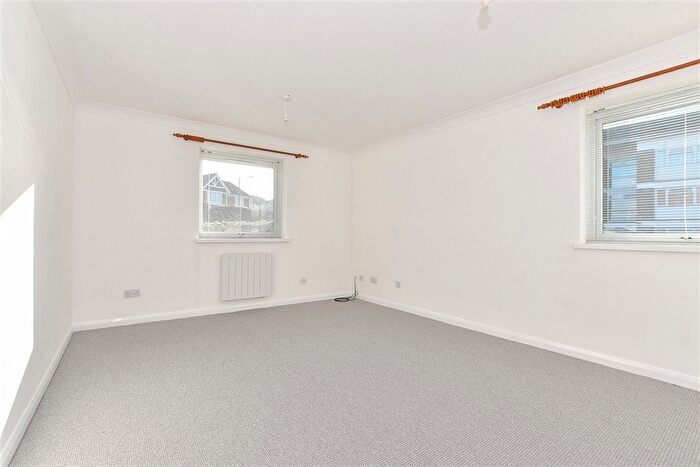
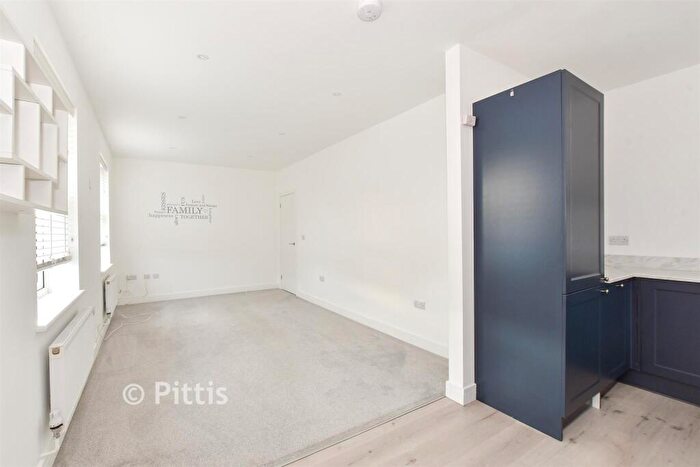
Properties for sale near PO37 6LD, Yarborough Arcade
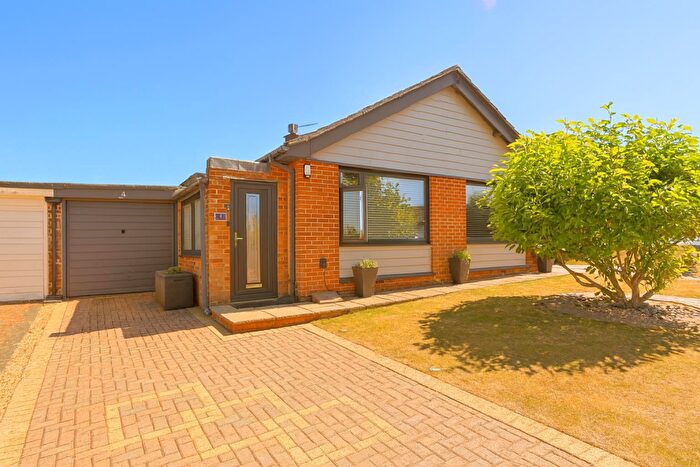
![]()
If you are looking to sell your house, let it out, or receive a property valuation, an expert can help you.
Click the button below to get started.


Price Paid in Yarborough Arcade, PO37 6LD, Shanklin South
8 - 9 FLAT 6 Yarborough Arcade, PO37 6LD, Shanklin South Shanklin
Property 8 - 9 FLAT 6 has been sold 2 times. The last time it was sold was in 03/08/2018 and the sold price was £96,500.00.
This is a Flat which was sold as a leasehold in 03/08/2018
| Date | Price | Property Type | Tenure | Classification |
|---|---|---|---|---|
| 03/08/2018 | £96,500.00 | Flat | leasehold | Established Building |
| 25/05/2007 | £100,000.00 | Flat | leasehold | Established Building |
8 - 9 FLAT 1 Yarborough Arcade, PO37 6LD, Shanklin South Shanklin
Property 8 - 9 FLAT 1 has been sold 1 time. The last time it was sold was in 20/12/2007 and the sold price was £90,000.00.
This is a Flat which was sold as a leasehold in 20/12/2007
| Date | Price | Property Type | Tenure | Classification |
|---|---|---|---|---|
| 20/12/2007 | £90,000.00 | Flat | leasehold | Established Building |
1 Yarborough Arcade, PO37 6LD, Shanklin South Shanklin
Property 1 has been sold 2 times. The last time it was sold was in 31/10/2003 and the sold price was £42,500.00.
This flat, sold as a leasehold on 31/10/2003, is a 81 sqm mid-floor flat with an EPC rating of C.
| Date | Price | Property Type | Tenure | Classification |
|---|---|---|---|---|
| 31/10/2003 | £42,500.00 | Flat | leasehold | Established Building |
| 20/04/2000 | £19,000.00 | Flat | leasehold | Established Building |
6 Connaught Apartments 8-9 High Street, PO37 6LD, Shanklin South Shanklin
This is a 63 square meter Top-floor Flat with an EPC rating of D. Currently, there is no transaction history available for this property.
Transport near PO37 6LD, Yarborough Arcade

House price paid reports for PO37 6LD, Yarborough Arcade
Click on the buttons below to see price paid reports by year or property price:
- Price Paid By Year
Property Price Paid in PO37 6LD, Yarborough Arcade by Year
The average sold property price by year was:
| Year | Average Sold Price | Price Change |
Sold Properties
|
|---|---|---|---|
| 2018 | £96,500 | 2% |
1 Property |
| 2007 | £95,000 | 55% |
2 Properties |
| 2003 | £42,500 | 55% |
1 Property |
| 2000 | £19,000 | - |
1 Property |