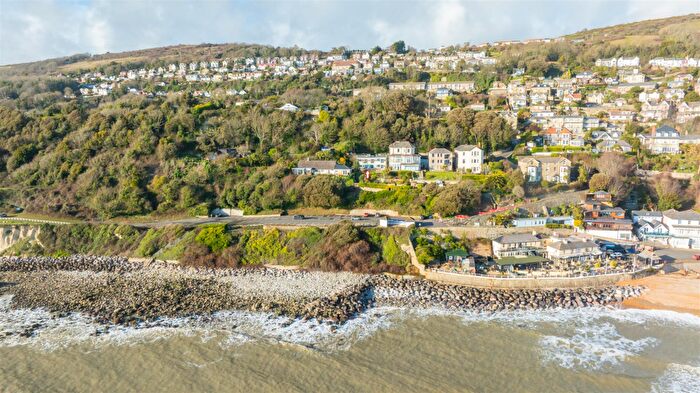
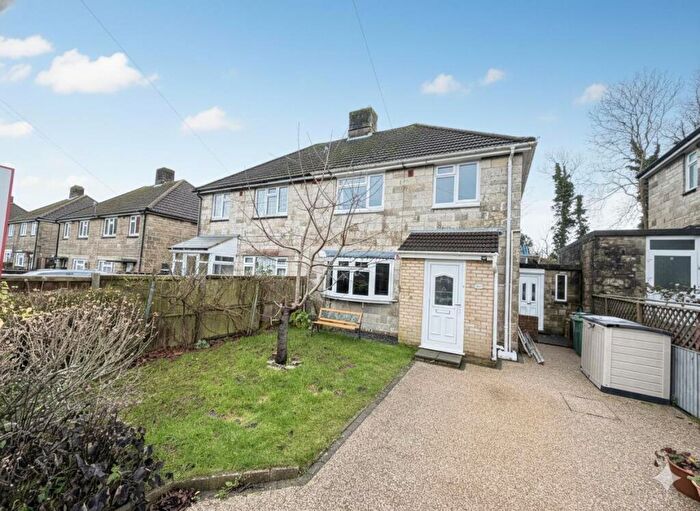
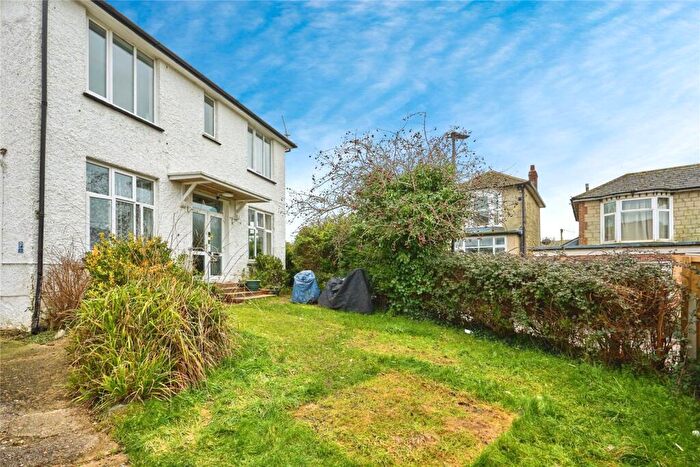
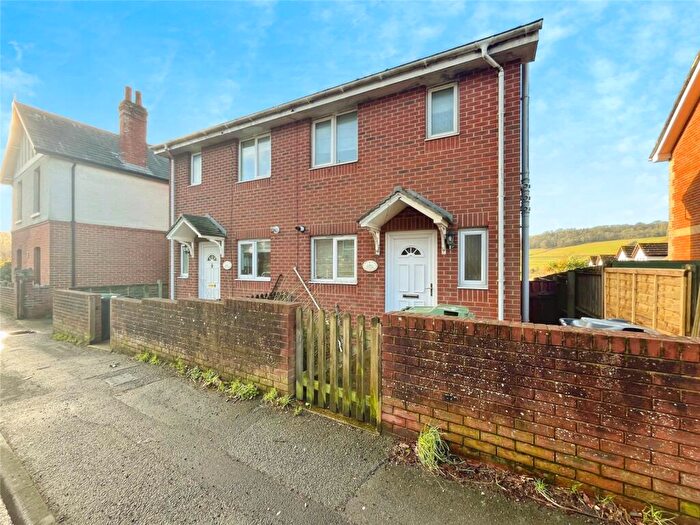
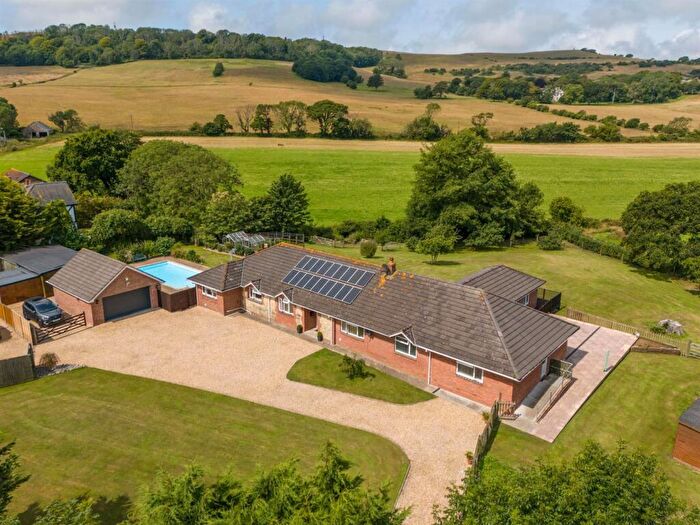
Houses for sale & to rent in Ventnor West, Ventnor
House Prices in Ventnor West
Properties in Ventnor West have an average house price of £367,553.00 and had 119 Property Transactions within the last 3 years¹.
Ventnor West is an area in Ventnor, Isle of Wight with 1,332 households², where the most expensive property was sold for £2,250,000.00.
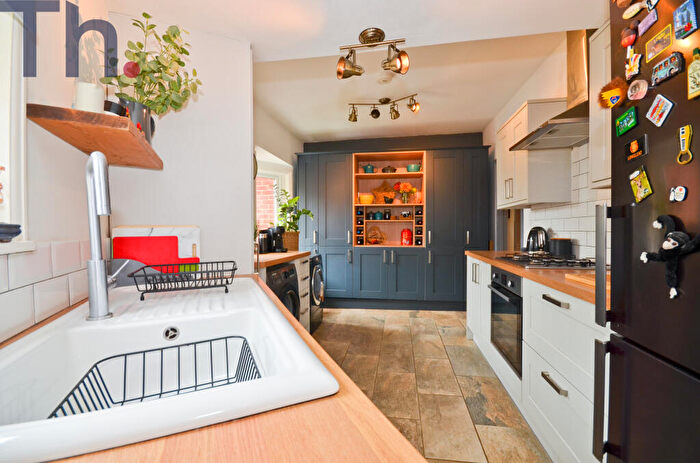
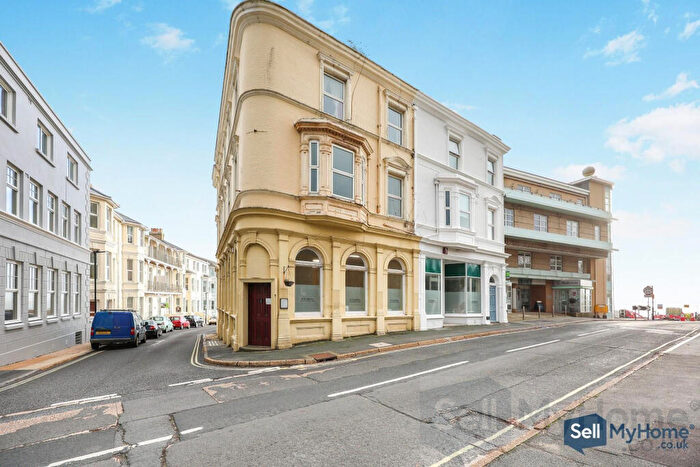
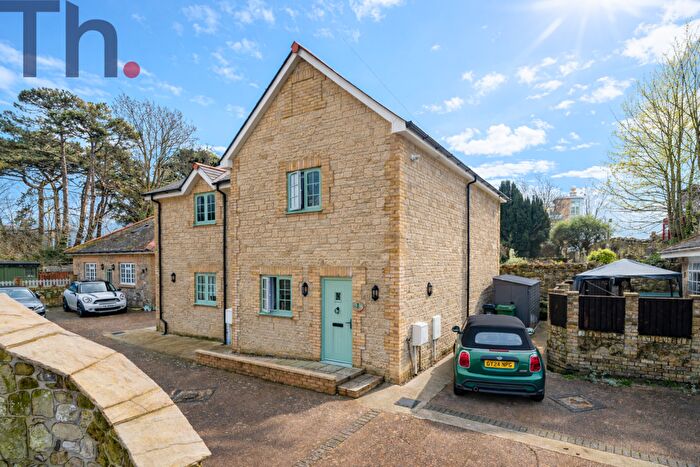
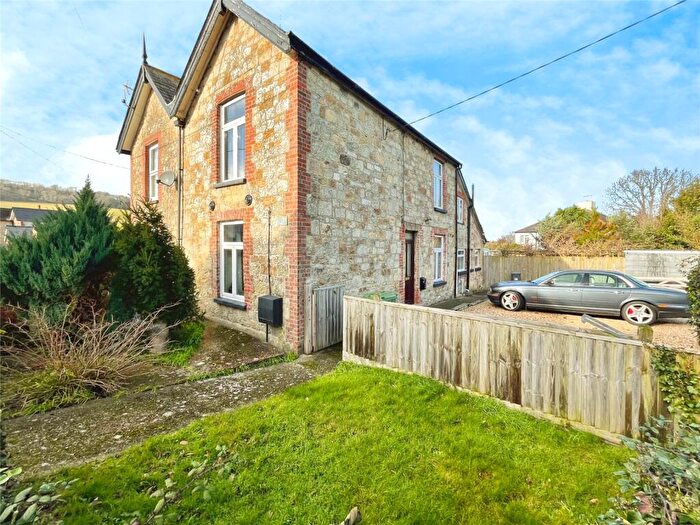
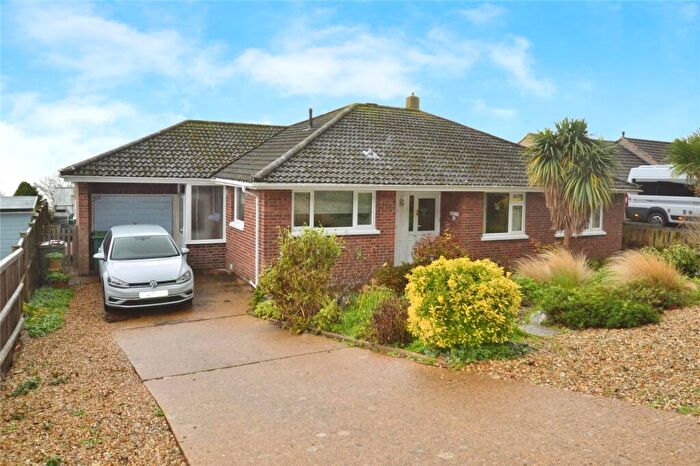
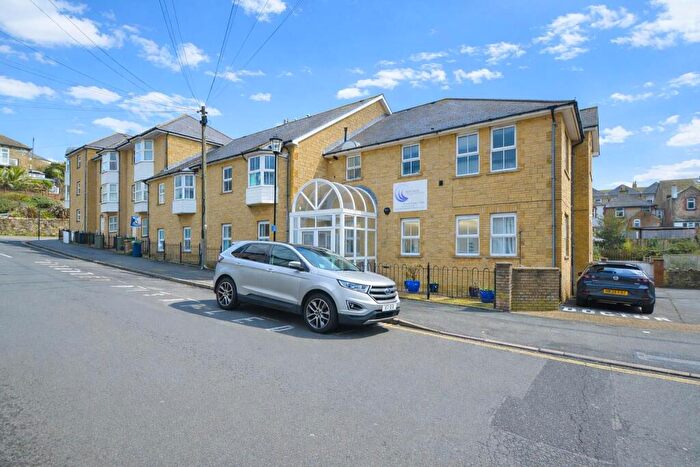
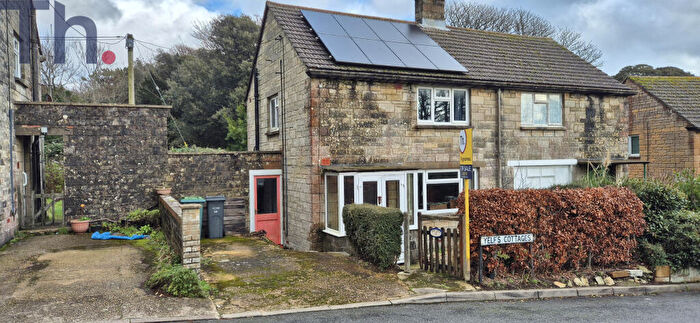
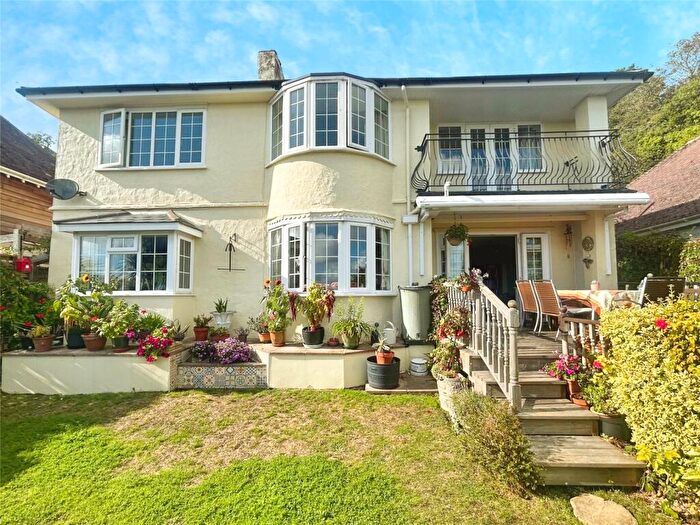
Properties for sale in Ventnor West
Roads and Postcodes in Ventnor West
Navigate through our locations to find the location of your next house in Ventnor West, Ventnor for sale or to rent.
| Streets | Postcodes |
|---|---|
| Alma Road | PO38 1JU |
| Alpine Road | PO38 1BT PO38 1BU PO38 1BX PO38 1JB |
| Ash Court | PO38 1BW |
| Barn Close | PO38 1UT |
| Bath Road | PO38 1JY |
| Belgrave Road | PO38 1JD PO38 1JH PO38 1JZ PO38 1JJ |
| Belle Vue Road | PO38 1DB |
| Castle Close | PO38 1UD |
| Castle Court | PO38 1UE |
| Castle Road | PO38 1LG PO38 1LQ |
| Chestnut Close | PO38 1DQ |
| Cornwall Road | PO38 1AS |
| Down Lane | PO38 1AH |
| Downlands Crescent | PO38 1BE |
| Downside | PO38 1AL |
| Esplanade | PO38 1JP PO38 1JR PO38 1JT PO38 1JX PO38 1TA |
| Esplanade Road | PO38 1JL PO38 1JW |
| Fishers | PO38 1UU |
| Foxhills | PO38 1LX |
| Gills Cliff Road | PO38 1AD PO38 1LH |
| Gloucester Road | PO38 1AT PO38 1AU |
| Hazel Close | PO38 1DZ |
| Hunts Road | PO38 1XT |
| Inglewood Park | PO38 1UX |
| Littleton Close | PO38 1AJ |
| Lowtherville Road | PO38 1AP PO38 1AR PO38 1BL |
| Marine Parade | PO38 1JN |
| Newport Road | PO38 1AE PO38 1AQ PO38 1AW PO38 1BA PO38 1BB PO38 1BD PO38 1BG PO38 1BQ PO38 1YH |
| Ocean View Road | PO38 1AA PO38 1AB PO38 1DH |
| Old Park Road | PO38 1XR PO38 1XU PO38 1XS |
| Park Avenue | PO38 1LD PO38 1LE PO38 1LF PO38 1LB PO38 1LR |
| Pelham Road | PO38 1UR |
| Rew Close | PO38 1BH |
| Rew Lane | PO38 3AX |
| Seven Sisters Close | PO38 1XE |
| Seven Sisters Road | PO38 1UY PO38 1UZ PO38 1XA |
| South View | PO38 1AN |
| Spindlers Road | PO38 1XB PO38 1XD |
| St Albans Gardens | PO38 1DF |
| St Albans Road | PO38 1DE |
| St Margarets | PO38 1BJ |
| St Margarets Glade | PO38 1DG |
| Steephill Court Road | PO38 1UH PO38 1UJ |
| Steephill Cove | PO38 1UG |
| Steephill Down Road | PO38 1AF PO38 1BP |
| Steephill Road | PO38 1UF |
| The Cliff Path | PO38 1UN |
| Twining Road | PO38 1TX |
| Undercliff Drive | PO38 1UL PO38 1UQ PO38 1UW PO38 1XF PO38 1XG PO38 1XH PO38 1XJ PO38 1XX PO38 1XY PO38 1XZ |
| Undercliff Gardens | PO38 1UB |
| Whitwell Road | PO38 1LJ PO38 2AA PO38 1LP |
| Willow Close | PO38 1DY |
| Woody Bay Cottages | PO38 1XP |
| Woolverton Road | PO38 1XN PO38 1XW |
| York Road | PO38 1AX PO38 1AY |
| York Villas | PO38 1AZ |
| Zig Zag Road | PO38 1BY PO38 1BZ PO38 1DA PO38 1DD PO38 1EA PO38 1LL |
Transport near Ventnor West
-
Shanklin Station
-
Lake Station
-
Sandown Station
-
Brading Station
-
Smallbrook Junction Station
-
Ryde St.John's Road Station
- FAQ
- Price Paid By Year
- Property Type Price
Frequently asked questions about Ventnor West
What is the average price for a property for sale in Ventnor West?
The average price for a property for sale in Ventnor West is £367,553. This amount is 9% higher than the average price in Ventnor. There are 1,172 property listings for sale in Ventnor West.
What streets have the most expensive properties for sale in Ventnor West?
The streets with the most expensive properties for sale in Ventnor West are Old Park Road at an average of £1,376,666, Esplanade at an average of £825,000 and Barn Close at an average of £750,000.
What streets have the most affordable properties for sale in Ventnor West?
The streets with the most affordable properties for sale in Ventnor West are Cornwall Road at an average of £139,166, Ocean View Road at an average of £139,300 and Willow Close at an average of £145,000.
Which train stations are available in or near Ventnor West?
Some of the train stations available in or near Ventnor West are Shanklin, Lake and Sandown.
Property Price Paid in Ventnor West by Year
The average sold property price by year was:
| Year | Average Sold Price | Price Change |
Sold Properties
|
|---|---|---|---|
| 2025 | £356,272 | -12% |
40 Properties |
| 2024 | £399,314 | 12% |
35 Properties |
| 2023 | £352,545 | -2% |
44 Properties |
| 2022 | £361,082 | -2% |
60 Properties |
| 2021 | £367,841 | 11% |
82 Properties |
| 2020 | £326,607 | 11% |
65 Properties |
| 2019 | £291,333 | 9% |
63 Properties |
| 2018 | £264,681 | -0,3% |
70 Properties |
| 2017 | £265,452 | 2% |
57 Properties |
| 2016 | £260,713 | 5% |
67 Properties |
| 2015 | £247,230 | 9% |
74 Properties |
| 2014 | £224,274 | -9% |
64 Properties |
| 2013 | £244,143 | 15% |
57 Properties |
| 2012 | £206,798 | -10% |
41 Properties |
| 2011 | £227,328 | -15% |
53 Properties |
| 2010 | £260,840 | 13% |
57 Properties |
| 2009 | £226,582 | 5% |
48 Properties |
| 2008 | £216,045 | -11% |
53 Properties |
| 2007 | £239,104 | -4% |
92 Properties |
| 2006 | £249,178 | 19% |
111 Properties |
| 2005 | £201,781 | -3% |
69 Properties |
| 2004 | £208,471 | 20% |
73 Properties |
| 2003 | £167,383 | 20% |
91 Properties |
| 2002 | £133,789 | 14% |
81 Properties |
| 2001 | £114,542 | 12% |
88 Properties |
| 2000 | £100,732 | -1% |
95 Properties |
| 1999 | £102,138 | 21% |
111 Properties |
| 1998 | £81,041 | 20% |
78 Properties |
| 1997 | £64,727 | 2% |
102 Properties |
| 1996 | £63,364 | 13% |
92 Properties |
| 1995 | £54,959 | - |
54 Properties |
Property Price per Property Type in Ventnor West
Here you can find historic sold price data in order to help with your property search.
The average Property Paid Price for specific property types in the last three years are:
| Property Type | Average Sold Price | Sold Properties |
|---|---|---|
| Semi Detached House | £211,722.00 | 27 Semi Detached Houses |
| Detached House | £551,469.00 | 50 Detached Houses |
| Terraced House | £222,350.00 | 20 Terraced Houses |
| Flat | £272,815.00 | 22 Flats |

