
Houses for sale & to rent in Ventnor East, Ventnor
House Prices in Ventnor East
Properties in Ventnor East have an average house price of £284k and had 158 Property Transactions within the last 3 years¹.
Ventnor East is an area in Ventnor, Isle of Wight with 1,514 households², where the most expensive property was sold for £2.11M.
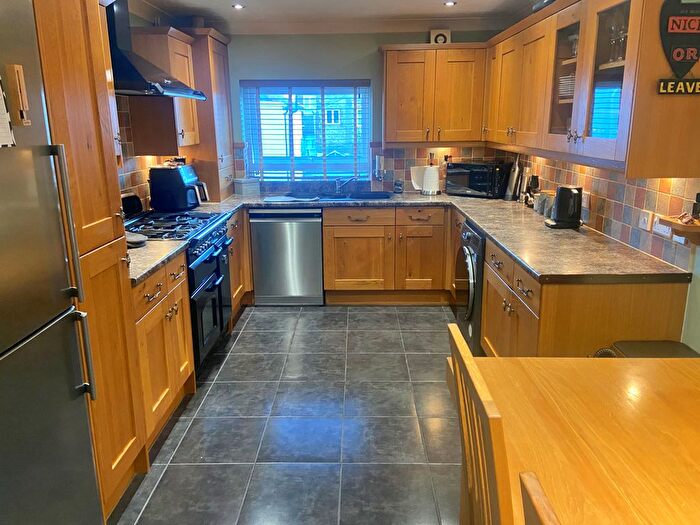
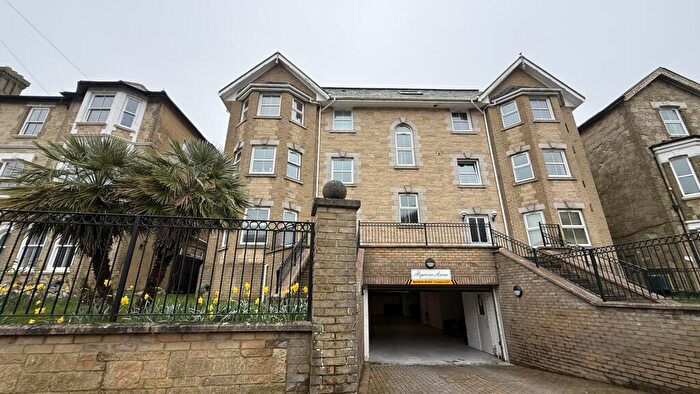
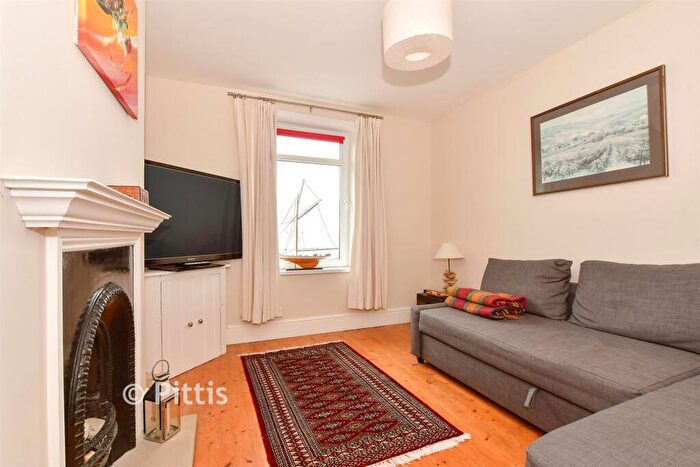
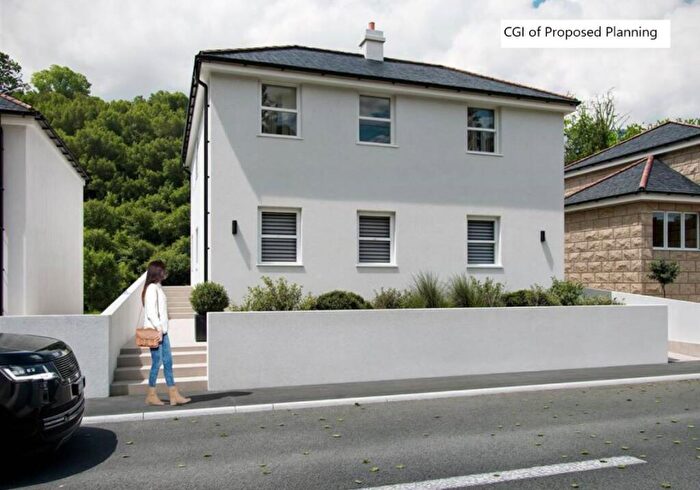
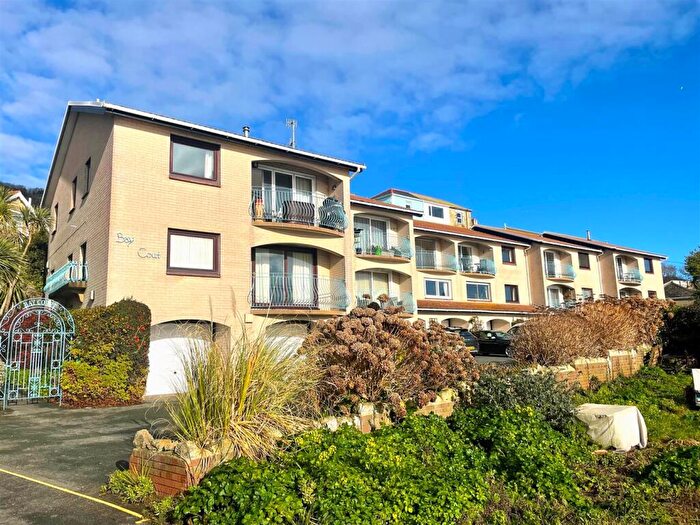
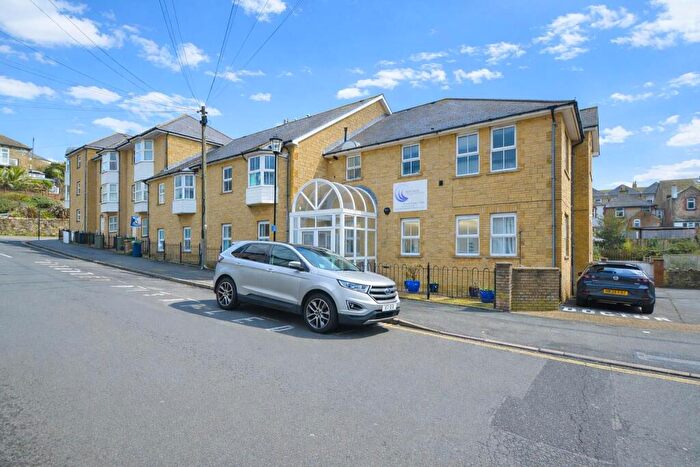
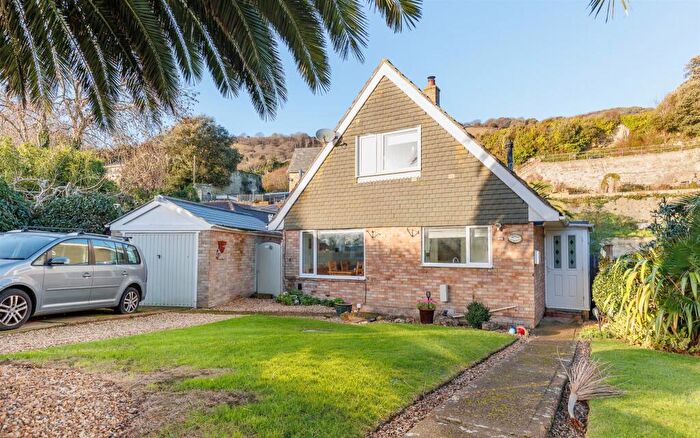
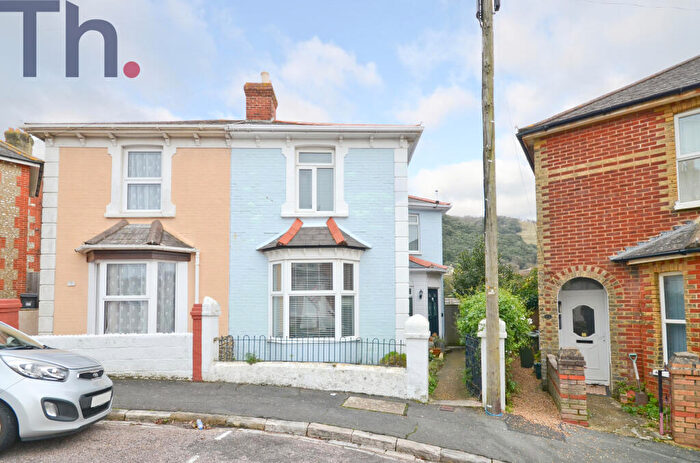
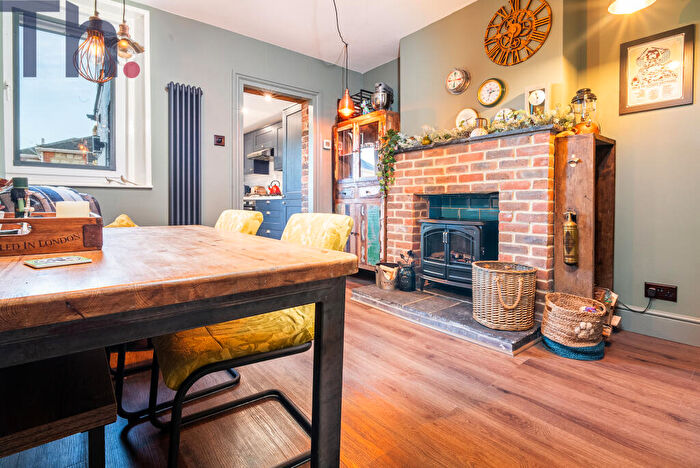
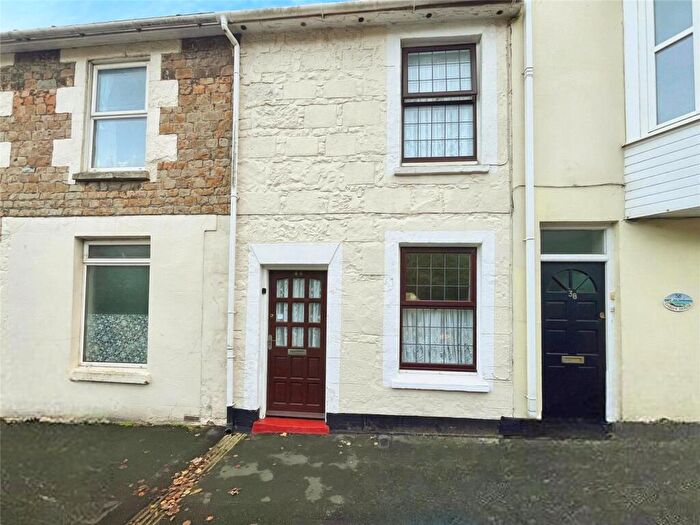
Properties for sale in Ventnor East
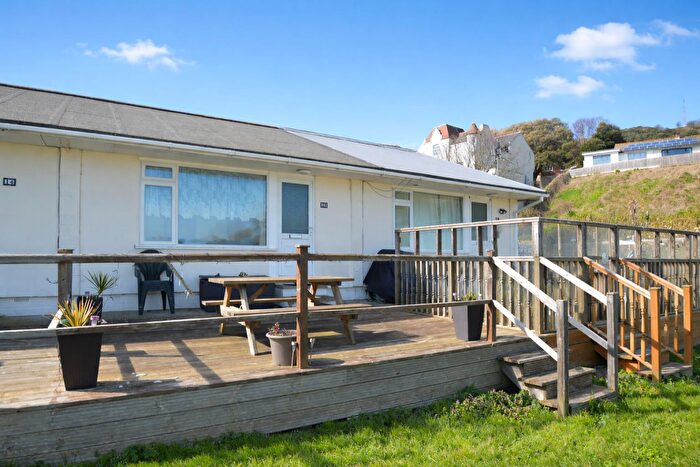
![]()
If you are looking to sell your house, let it out, or receive a property valuation, an expert can help you.
Click the button below to get started.
Roads and Postcodes in Ventnor East
Navigate through our locations to find the location of your next house in Ventnor East, Ventnor for sale or to rent.
Transport near Ventnor East

- FAQ
- Price Paid By Year
- Property Type Price
Frequently asked questions about Ventnor East
What is the average price for a property for sale in Ventnor East?
The average price for a property for sale in Ventnor East is £284,447. This amount is 16% lower than the average price in Ventnor. There are 764 property listings for sale in Ventnor East.
What streets have the most expensive properties for sale in Ventnor East?
The streets with the most expensive properties for sale in Ventnor East are Mitchell Avenue at an average of £628,333, The Grove at an average of £582,000 and Bonchurch Village Road at an average of £560,666.
What streets have the most affordable properties for sale in Ventnor East?
The streets with the most affordable properties for sale in Ventnor East are Spring Hill Court at an average of £75,000, Pier Street at an average of £102,333 and Pound Lane at an average of £118,875.
Which train stations are available in or near Ventnor East?
Some of the train stations available in or near Ventnor East are Shanklin, Lake and Sandown.
Property Price Paid in Ventnor East by Year
The average sold property price by year was:
| Year | Average Sold Price | Price Change |
Sold Properties
|
|---|---|---|---|
| 2025 | £229,960 | -18% |
44 Properties |
| 2024 | £271,794 | -20% |
44 Properties |
| 2023 | £326,650 | 18% |
70 Properties |
| 2022 | £267,512 | -8% |
94 Properties |
| 2021 | £288,251 | 17% |
114 Properties |
| 2020 | £240,093 | 17% |
72 Properties |
| 2019 | £199,487 | -7% |
77 Properties |
| 2018 | £213,980 | 11% |
76 Properties |
| 2017 | £190,130 | -5% |
79 Properties |
| 2016 | £199,522 | 16% |
101 Properties |
| 2015 | £167,471 | -9% |
104 Properties |
| 2014 | £182,997 | 11% |
90 Properties |
| 2013 | £162,346 | -14% |
70 Properties |
| 2012 | £184,729 | -13% |
60 Properties |
| 2011 | £209,588 | 12% |
67 Properties |
| 2010 | £184,021 | -5% |
76 Properties |
| 2009 | £192,407 | 15% |
64 Properties |
| 2008 | £163,329 | -8% |
66 Properties |
| 2007 | £176,309 | -5% |
143 Properties |
| 2006 | £185,773 | 16% |
121 Properties |
| 2005 | £156,419 | 5% |
109 Properties |
| 2004 | £149,341 | 15% |
141 Properties |
| 2003 | £127,605 | 16% |
115 Properties |
| 2002 | £107,545 | 24% |
140 Properties |
| 2001 | £81,948 | 17% |
128 Properties |
| 2000 | £68,079 | -1% |
142 Properties |
| 1999 | £68,563 | 25% |
133 Properties |
| 1998 | £51,099 | 5% |
123 Properties |
| 1997 | £48,291 | 11% |
106 Properties |
| 1996 | £42,854 | -7% |
87 Properties |
| 1995 | £45,919 | - |
64 Properties |
Property Price per Property Type in Ventnor East
Here you can find historic sold price data in order to help with your property search.
The average Property Paid Price for specific property types in the last three years are:
| Property Type | Average Sold Price | Sold Properties |
|---|---|---|
| Semi Detached House | £295,796.00 | 27 Semi Detached Houses |
| Detached House | £537,404.00 | 34 Detached Houses |
| Terraced House | £217,925.00 | 34 Terraced Houses |
| Flat | £178,968.00 | 63 Flats |