
Houses for sale & to rent in N19 3XJ, Jessie Blythe Lane, Hillrise, London
House Prices in N19 3XJ, Jessie Blythe Lane, Hillrise
Properties in N19 3XJ have no sales history available within the last 3 years. N19 3XJ is a postcode in Jessie Blythe Lane located in Hillrise, an area in London, Islington London Borough, with 19 households².
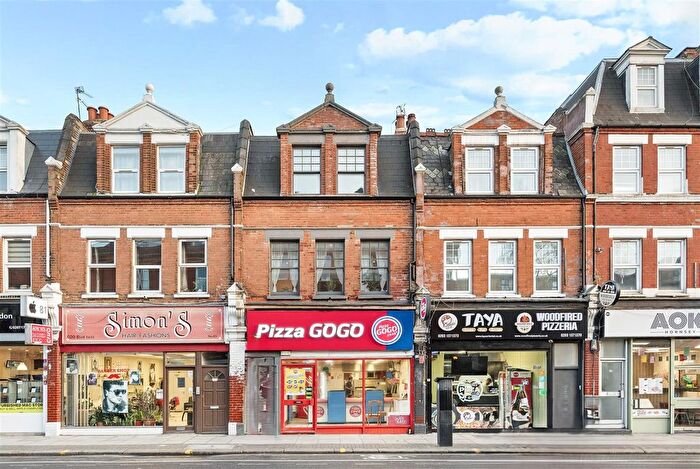
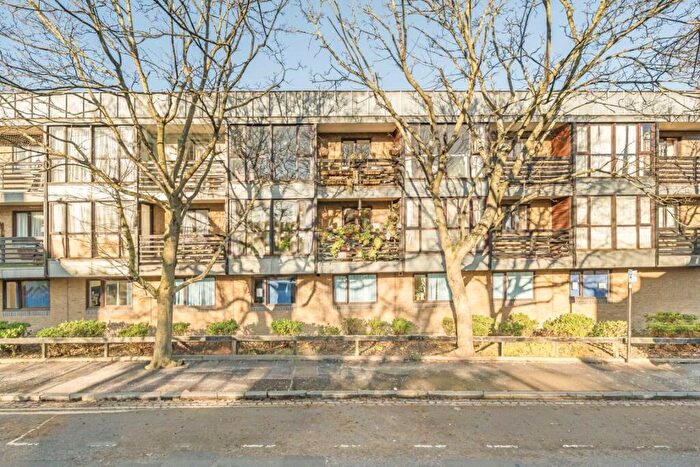
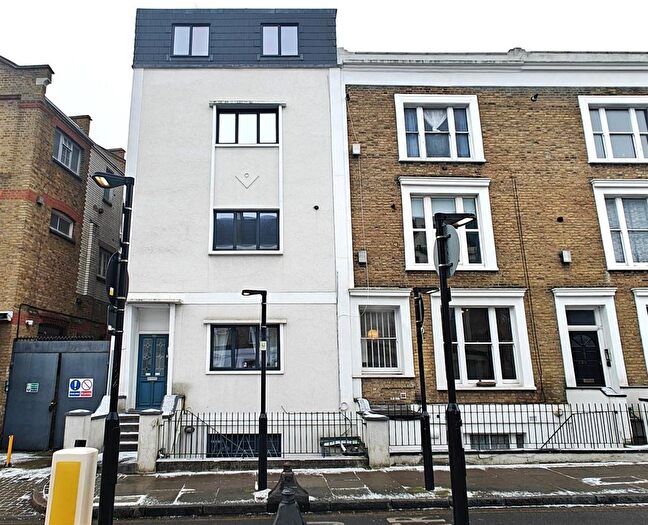
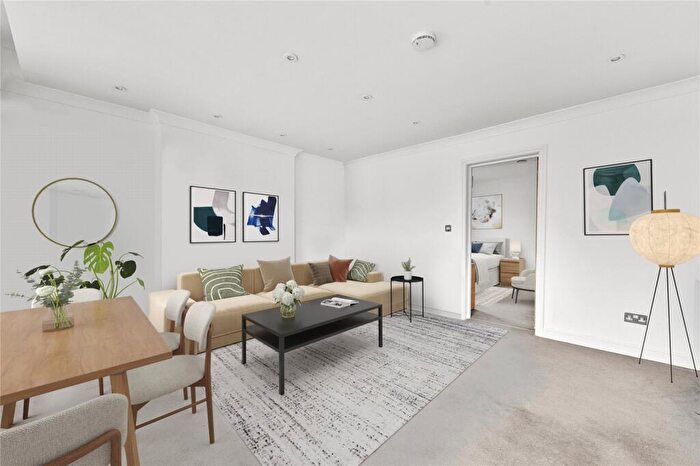
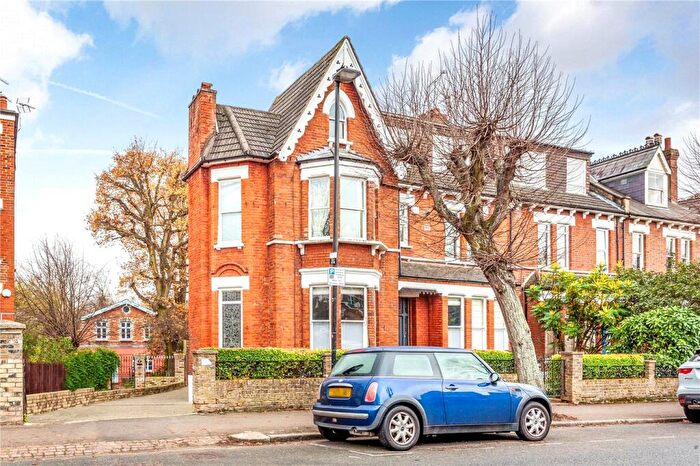
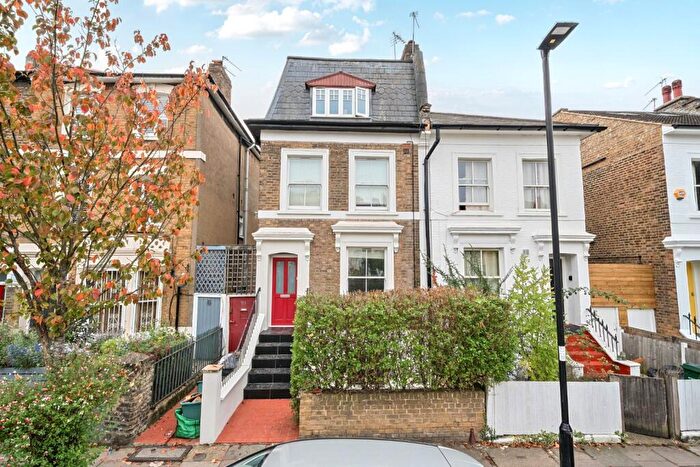
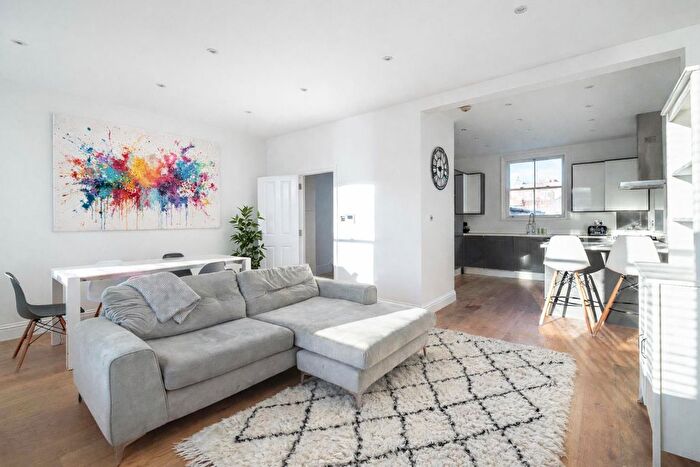
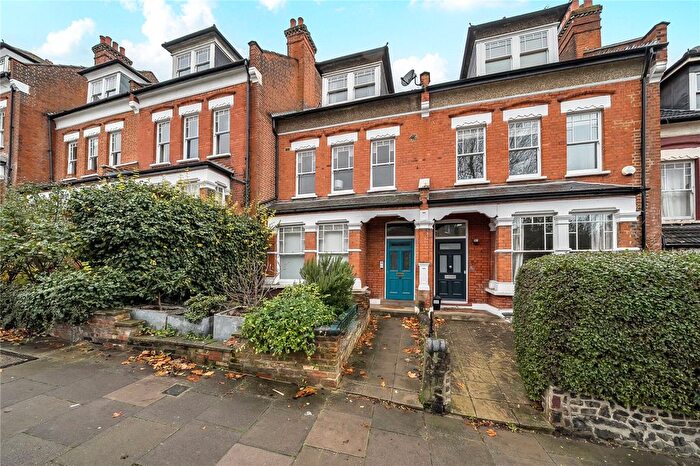
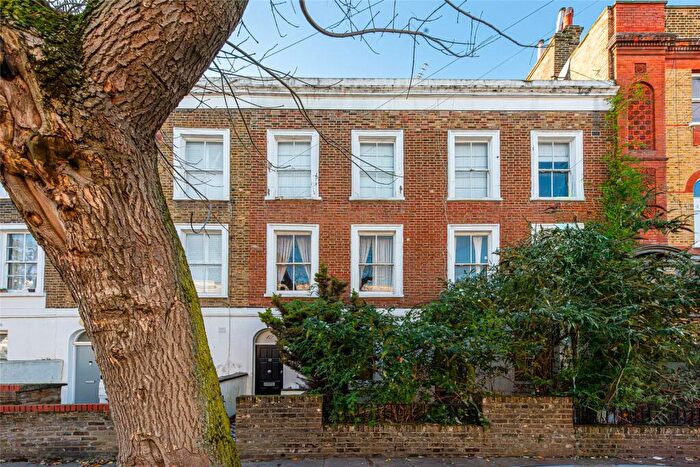
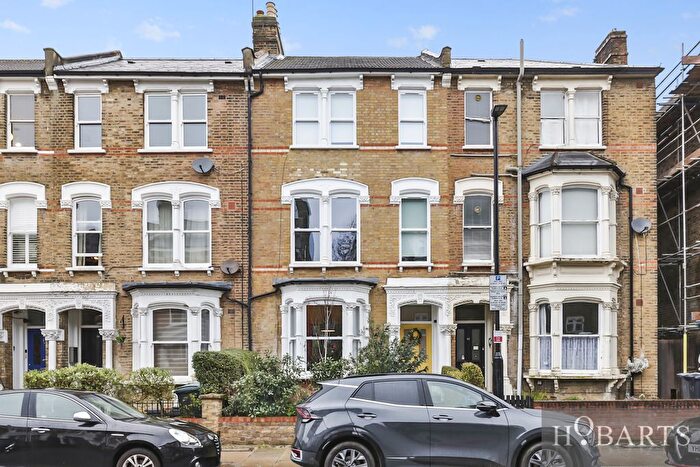
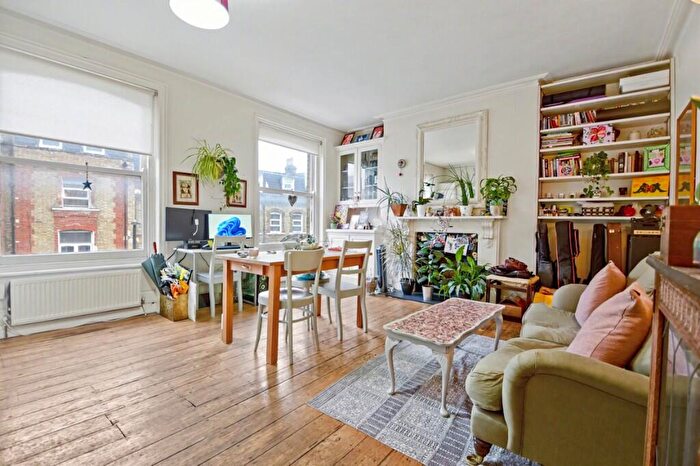
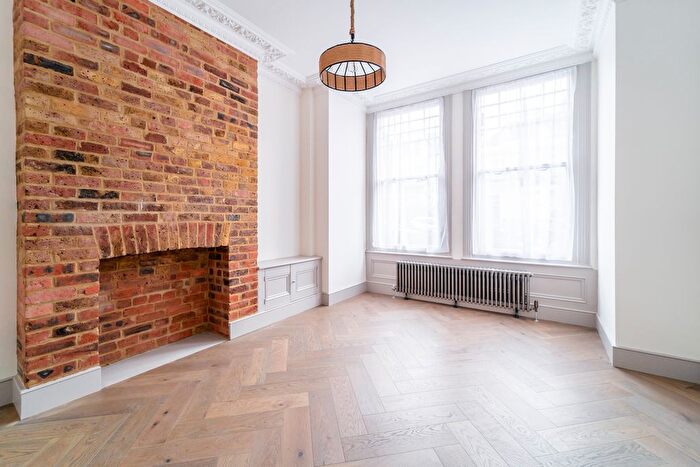
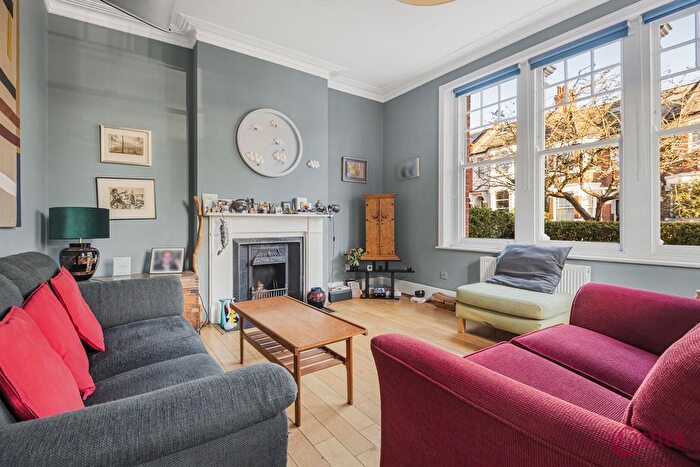
Properties for sale near N19 3XJ, Jessie Blythe Lane

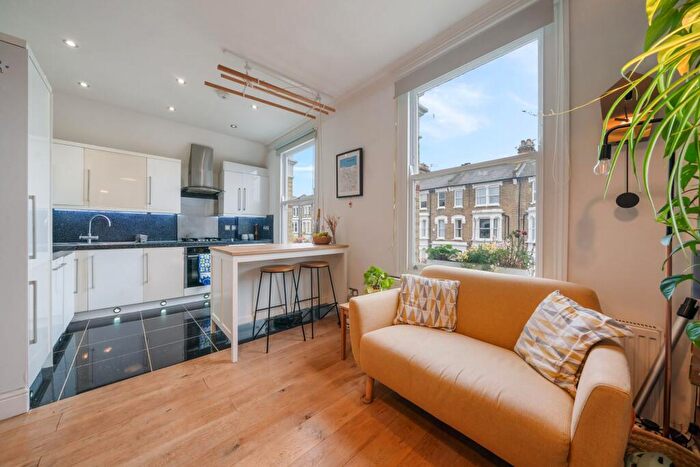
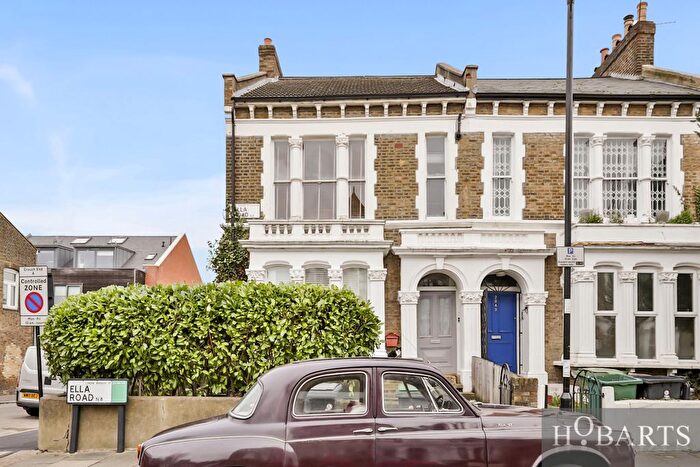
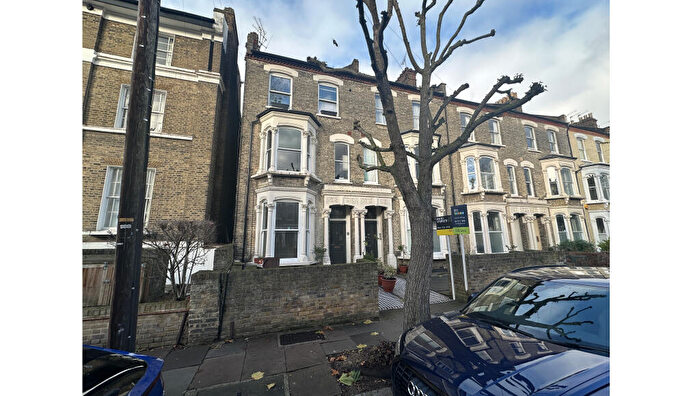
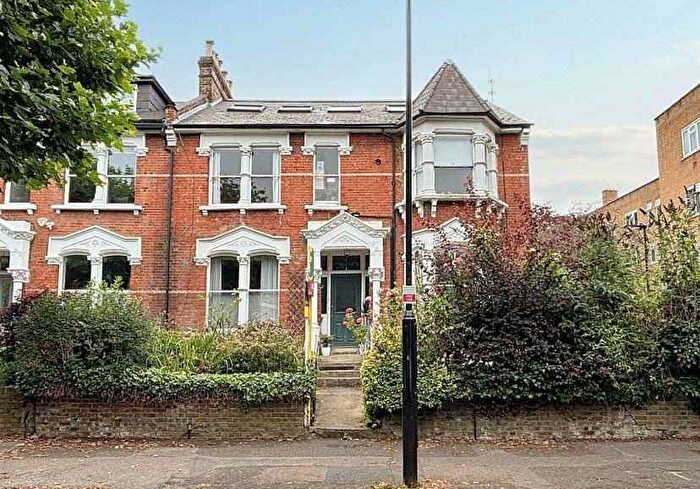
![]()
If you are looking to sell your house, let it out, or receive a property valuation, an expert can help you.
Click the button below to get started.
Price Paid in Jessie Blythe Lane, N19 3XJ, Hillrise
7 Jessie Blythe Lane, N19 3XJ, Hillrise London
Property 7 has been sold 2 times. The last time it was sold was in 16/12/2021 and the sold price was £465,000.00.
This terraced house, sold as a freehold on 16/12/2021, is a 63 sqm end-terrace house with an EPC rating of D.
| Date | Price | Property Type | Tenure | Classification |
|---|---|---|---|---|
| 16/12/2021 | £465,000.00 | Terraced House | freehold | Established Building |
| 25/11/2013 | £170,000.00 | Terraced House | freehold | Established Building |
12 Jessie Blythe Lane, N19 3XJ, Hillrise London
Property 12 has been sold 2 times. The last time it was sold was in 31/01/2007 and the sold price was £235,000.00.
This is a Terraced House which was sold as a freehold in 31/01/2007
| Date | Price | Property Type | Tenure | Classification |
|---|---|---|---|---|
| 31/01/2007 | £235,000.00 | Terraced House | freehold | Established Building |
| 01/10/2003 | £180,000.00 | Terraced House | freehold | Established Building |
Postcodes in Jessie Blythe Lane, Hillrise
Navigate through other locations in Jessie Blythe Lane, Hillrise, London to see more property listings for sale or to rent.
Transport near N19 3XJ, Jessie Blythe Lane
-

 Crouch Hill Station
 -
Upper Holloway Station
-
 Archway Station
 -
Harringay Station
-
Finsbury Park Station
-
Highgate Station
-
Hornsey Station
-
Harringay Green Lanes Station
-
Manor House Station
-
Arsenal Station
House price paid reports for N19 3XJ, Jessie Blythe Lane
Click on the buttons below to see price paid reports by year or property price:
- Price Paid By Year
Property Price Paid in N19 3XJ, Jessie Blythe Lane by Year
The average sold property price by year was:
| Year | Average Sold Price | Price Change |
Sold Properties
|
|---|---|---|---|
| 2021 | £465,000 | 63% |
1 Property |
| 2013 | £170,000 | -38% |
1 Property |
| 2007 | £235,000 | 23% |
1 Property |
| 2003 | £180,000 | - |
1 Property |