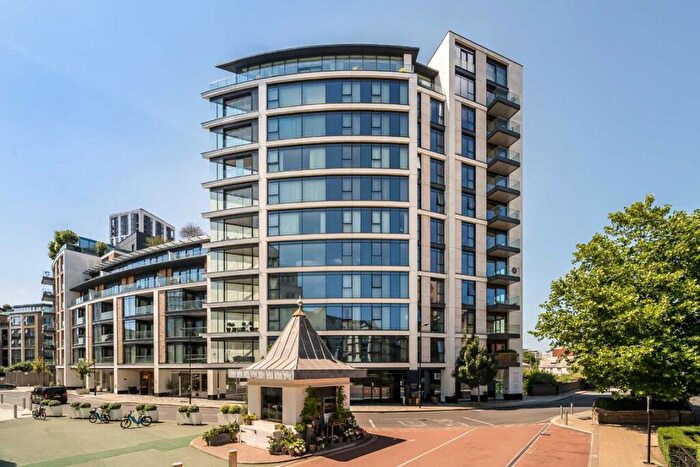
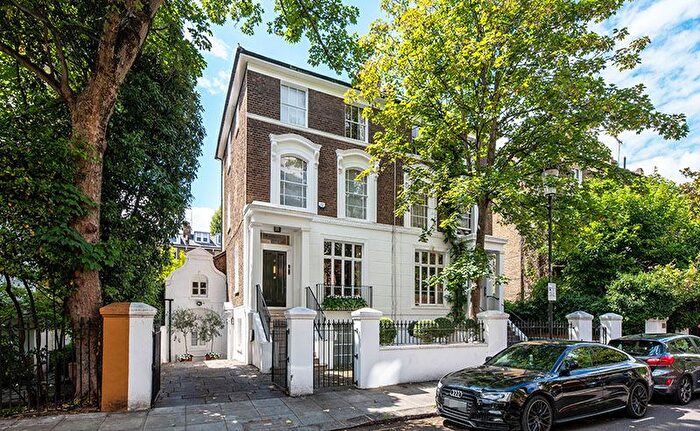
Houses for sale & to rent in Stanley, London
House Prices in Stanley
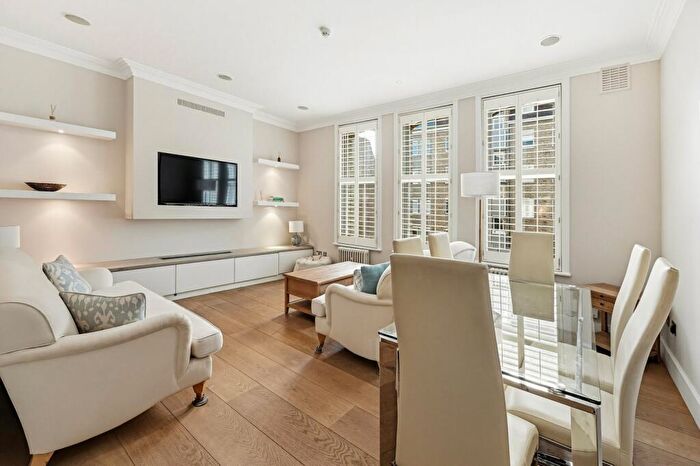
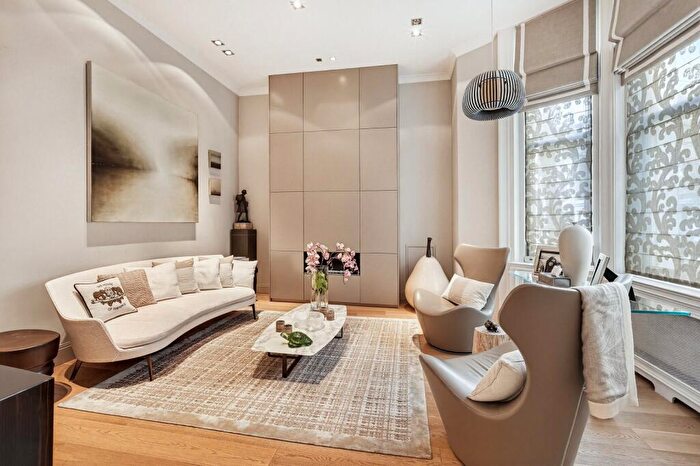
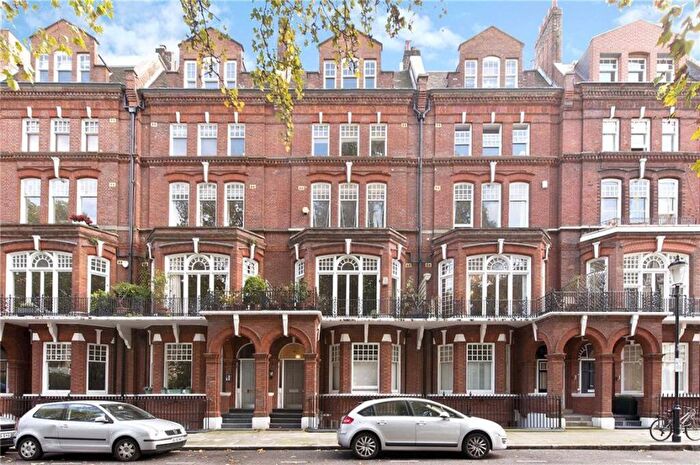
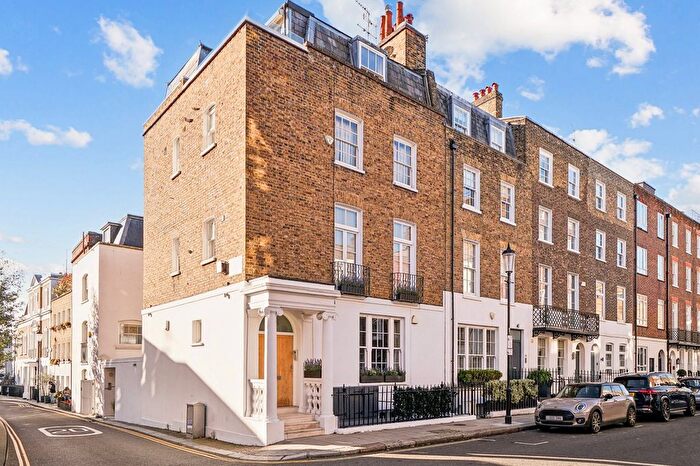
Properties in this part of Stanley within London have an average house price of £2,593,267.00 and had 439 Property Transactions within the last 3 years¹. This area has 4,912 households² , where the most expensive property was sold for £26,100,000.00.
Properties for sale in Stanley
Roads and Postcodes in Stanley
Navigate through our locations to find the location of your next house in Stanley, London for sale or to rent.
Transport near Stanley
-
South Kensington Station
-
Gloucester Road Station
-
West Brompton Station
-
Earls Court Station
-
Imperial Wharf Station
-
Sloane Square Station
-
Fulham Broadway Station
-
Knightsbridge Station
-
High Street Kensington Station
-
Battersea Park Station
- FAQ
- Price Paid By Year
- Property Type Price
Frequently asked questions about Stanley
What is the average price for a property for sale in Stanley?
The average price for a property for sale in Stanley is £2,593,267. This amount is 14% higher than the average price in London. There are more than 10,000 property listings for sale in Stanley.
What streets have the most expensive properties for sale in Stanley?
The streets with the most expensive properties for sale in Stanley are Chelsea Square at an average of £16,104,000, Mulberry Walk at an average of £10,229,166 and Carlyle Square at an average of £10,168,000.
What streets have the most affordable properties for sale in Stanley?
The streets with the most affordable properties for sale in Stanley are Chelsea Manor Street at an average of £558,911, College Place at an average of £570,000 and The Sandhills at an average of £695,000.
Which train stations are available in or near Stanley?
Some of the train stations available in or near Stanley are West Brompton, Imperial Wharf and Battersea Park.
Which tube stations are available in or near Stanley?
Some of the tube stations available in or near Stanley are South Kensington, Gloucester Road and West Brompton.
Property Price Paid in Stanley by Year
The average sold property price by year was:
| Year | Average Sold Price | Price Change |
Sold Properties
|
|---|---|---|---|
| 2025 | £2,014,416 | -32% |
51 Properties |
| 2024 | £2,651,110 | 16% |
121 Properties |
| 2023 | £2,216,894 | -39% |
125 Properties |
| 2022 | £3,083,190 | 5% |
142 Properties |
| 2021 | £2,926,645 | 26% |
146 Properties |
| 2020 | £2,166,994 | -2% |
119 Properties |
| 2019 | £2,204,953 | -13% |
120 Properties |
| 2018 | £2,502,419 | 14% |
98 Properties |
| 2017 | £2,147,560 | 3% |
104 Properties |
| 2016 | £2,078,926 | 5% |
103 Properties |
| 2015 | £1,984,441 | -22% |
142 Properties |
| 2014 | £2,420,793 | 18% |
194 Properties |
| 2013 | £1,979,831 | 28% |
201 Properties |
| 2012 | £1,419,048 | -9% |
141 Properties |
| 2011 | £1,552,725 | 17% |
162 Properties |
| 2010 | £1,292,401 | 13% |
174 Properties |
| 2009 | £1,121,200 | -9% |
136 Properties |
| 2008 | £1,227,022 | 10% |
107 Properties |
| 2007 | £1,108,169 | -0,4% |
257 Properties |
| 2006 | £1,112,956 | 18% |
275 Properties |
| 2005 | £912,800 | 15% |
199 Properties |
| 2004 | £778,656 | 5% |
263 Properties |
| 2003 | £742,747 | 2% |
445 Properties |
| 2002 | £726,688 | 14% |
247 Properties |
| 2001 | £624,993 | -4% |
216 Properties |
| 2000 | £649,040 | 30% |
239 Properties |
| 1999 | £457,569 | 11% |
263 Properties |
| 1998 | £406,889 | 5% |
206 Properties |
| 1997 | £384,975 | 9% |
311 Properties |
| 1996 | £349,083 | 26% |
265 Properties |
| 1995 | £258,288 | - |
209 Properties |
Property Price per Property Type in Stanley
Here you can find historic sold price data in order to help with your property search.
The average Property Paid Price for specific property types in the last three years are:
| Property Type | Average Sold Price | Sold Properties |
|---|---|---|
| Flat | £1,063,555.00 | 282 Flats |
| Terraced House | £4,887,125.00 | 142 Terraced Houses |
| Detached House | £13,825,000.00 | 3 Detached Houses |
| Semi Detached House | £8,589,583.00 | 12 Semi Detached Houses |

