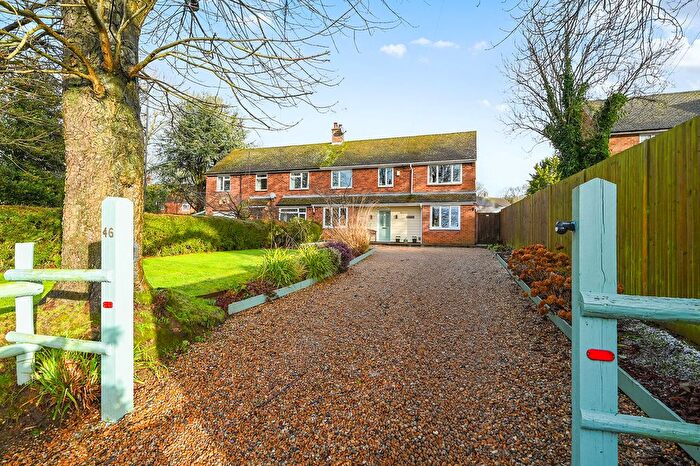
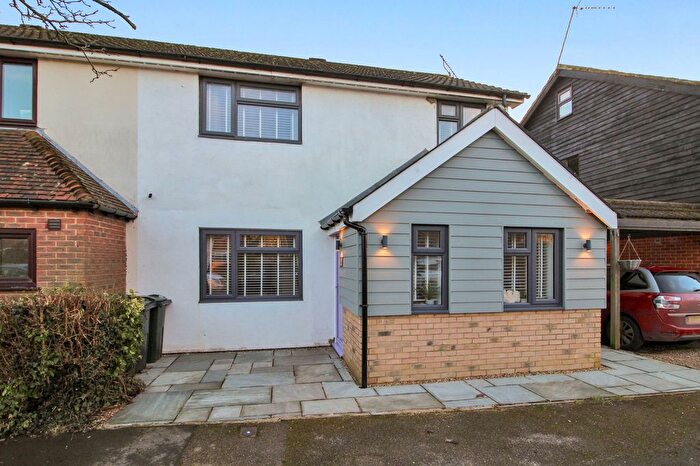
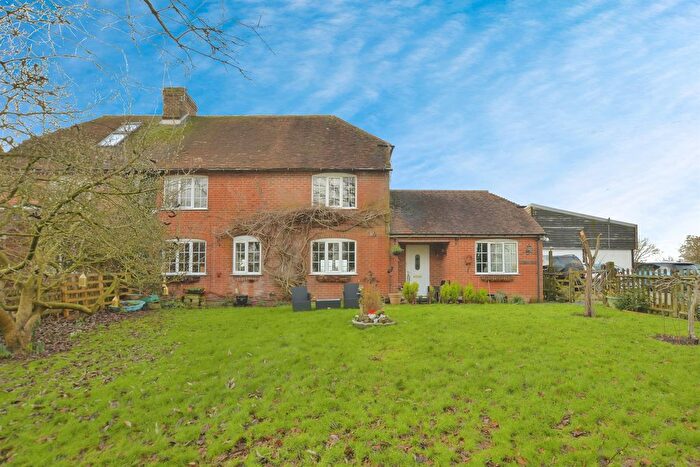
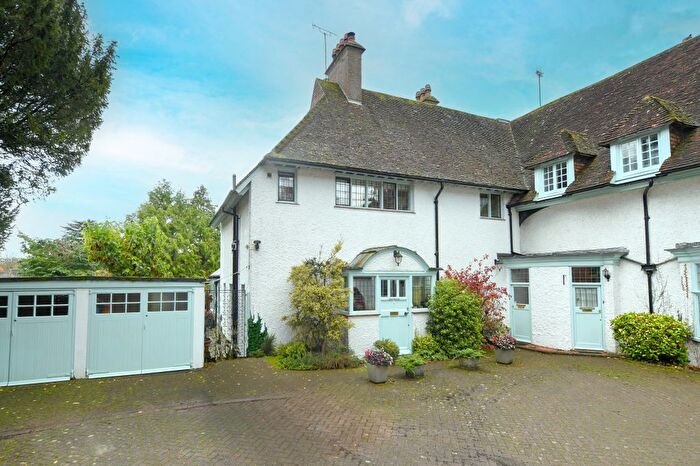
Houses for sale & to rent in Charing, Ashford
House Prices in Charing
Properties in Charing have an average house price of £486,424.00 and had 89 Property Transactions within the last 3 years¹.
Charing is an area in Ashford, Kent with 1,054 households², where the most expensive property was sold for £1,210,000.00.
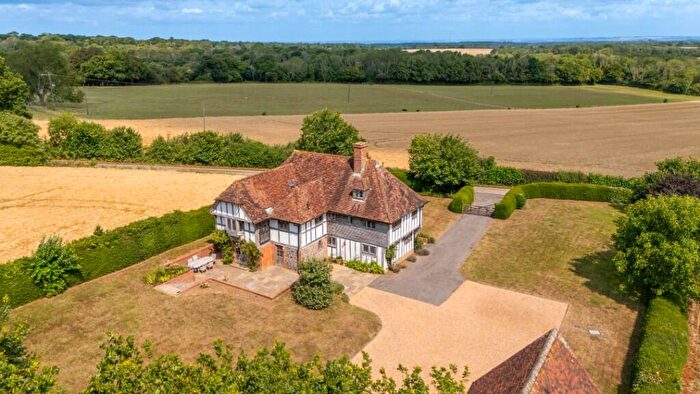
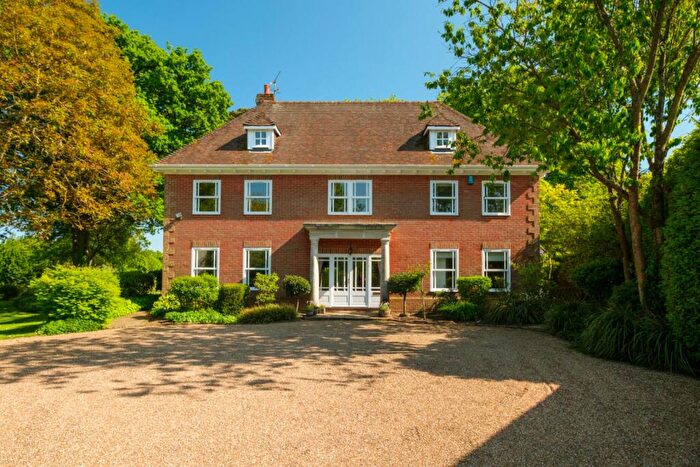
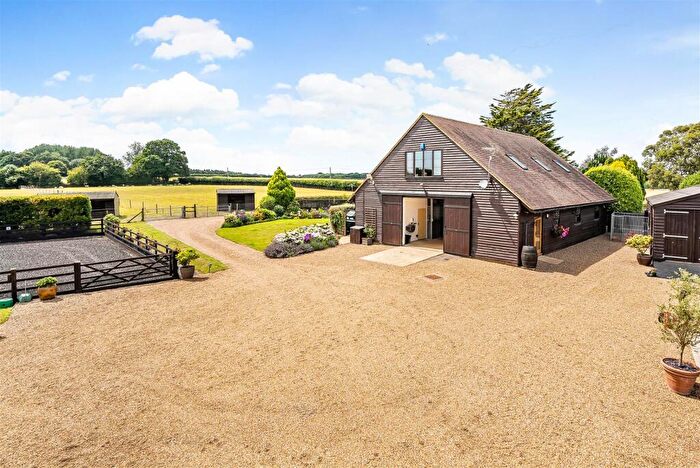
Properties for sale in Charing
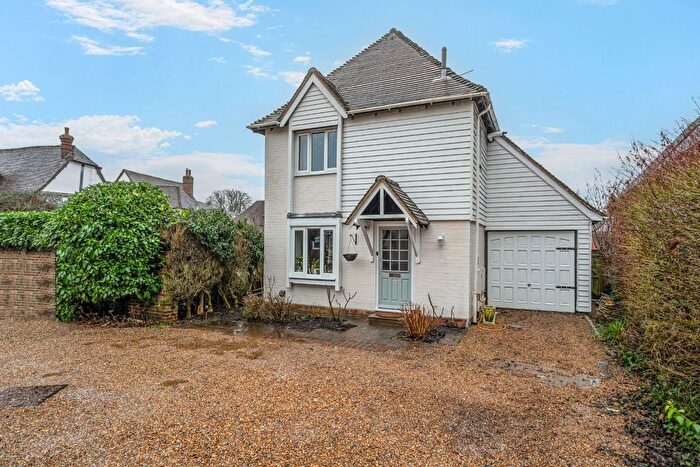
Previously listed properties in Charing
Roads and Postcodes in Charing
Navigate through our locations to find the location of your next house in Charing, Ashford for sale or to rent.
| Streets | Postcodes |
|---|---|
| Alderbed Close | TN27 0DG TN27 0DH |
| Ashford Road | TN27 0DX TN27 0EA TN27 0ED TN27 0EE TN27 0JL TN27 0AD TN27 0DF TN27 0DY |
| Blackberry Lane | TN27 0AE TN27 0BQ |
| Bowl Road | TN27 0HB TN27 0HD TN27 0NH |
| Brenchley Mews | TN27 0JQ TN27 0JW |
| Burleigh Road | TN27 0JB |
| Canterbury Road | TN25 4DP TN27 0EX TN27 0EY TN27 0EU |
| Centenary Close | TN27 0LL |
| Chapel Woods | TN27 0NP |
| Charing Heath Road | TN27 0AL TN27 0AT |
| Charing Hill | TN27 0LX TN27 0NB TN27 0NF TN27 0NG TN27 0NL |
| Clearmount Drive | TN27 0LH |
| Dog Kennel Lane | TN27 0HS |
| Downs Close | TN27 0LB |
| Downsway | TN27 0JP TN27 0LA TN27 0LQ TN27 0LF TN27 0LG |
| Egg Hill Road | TN27 0HG |
| Eliza Cottages | TN27 0JG |
| Ellen Close | TN27 0GX |
| Faversham Road | TN27 0NN TN27 0NR TN27 0NS |
| Haffenden Meadow | TN27 0JR |
| Hart Hill | TN27 0HW TN27 0HN TN27 0HP |
| High Street | TN27 0HU TN27 0HX TN27 0LS |
| Hither Field | TN27 0HZ |
| Hook Lane | TN27 0AN |
| Hurst Lane | TN27 0BJ |
| Kennelling Road | TN27 0HF |
| Littledale | TN27 0AP |
| Longbeech Park | TN27 0HA |
| Maidstone Road | TN27 0DE TN27 0JD TN27 0JE TN27 0JS TN27 0DA |
| Market Place | TN27 0LP TN27 0LR |
| Moat House | TN27 0JJ |
| Monkery Lane | TN27 0DJ |
| Monks Walk | TN27 0HT |
| New Court Wood | TN27 0EB |
| Newlands Road | TN27 0AR |
| Pett Lane | TN27 0DL TN27 0DS TN27 0DW |
| Pilgrims Way | TN27 0DP TN27 0DR TN27 0NA TN27 0LY |
| Pluckley Road | TN27 0AG TN27 0AH TN27 0AJ TN27 0AQ TN27 0BZ |
| Poppyfields | TN27 0AA |
| Ravensdane Wood | TN27 0NJ |
| Ruglys Way | TN27 0GZ |
| Rushmere Lane | TN27 0AF |
| Sayer Road | TN27 0JT |
| School Road | TN27 0JN TN27 0LT |
| Shaw Cottages | TN27 0DB |
| Stalisfield Church Road | TN27 0HE |
| Station Road | TN27 0JA |
| Surgery Close | TN27 0AW |
| Tatchell Drive | TN27 0GY |
| The Grove | TN27 0LD |
| The Hill | TN27 0LU |
| The Moat | TN27 0JH |
| The Wynd | TN27 0ND |
| Towner Close | TN27 0BF |
| Warren Street Road | TN27 0HL |
| Westwell Lane | TN27 0BW |
| Westwell Leacon | TN27 0EH TN27 0EL TN27 0EN |
| Wheler Road | TN27 0JU TN27 0JX |
| Wickens Lane | TN27 0DT |
| Wilkinson Close | TN27 0AB |
| Woodbrook | TN27 0DN |
| Wootton Lane | TN27 0DU |
| Yew Tree Park Homes | TN27 0DD |
| TN27 0ET TN27 0QQ TN27 0WU TN27 0YF |
Transport near Charing
- FAQ
- Price Paid By Year
- Property Type Price
Frequently asked questions about Charing
What is the average price for a property for sale in Charing?
The average price for a property for sale in Charing is £486,424. This amount is 34% higher than the average price in Ashford. There are 303 property listings for sale in Charing.
What streets have the most expensive properties for sale in Charing?
The streets with the most expensive properties for sale in Charing are Pluckley Road at an average of £952,166, Burleigh Road at an average of £880,000 and Pilgrims Way at an average of £820,000.
What streets have the most affordable properties for sale in Charing?
The streets with the most affordable properties for sale in Charing are Surgery Close at an average of £210,000, Westwell Leacon at an average of £218,400 and Downsway at an average of £252,500.
Which train stations are available in or near Charing?
Some of the train stations available in or near Charing are Charing, Lenham and Pluckley.
Property Price Paid in Charing by Year
The average sold property price by year was:
| Year | Average Sold Price | Price Change |
Sold Properties
|
|---|---|---|---|
| 2025 | £471,352 | -7% |
22 Properties |
| 2024 | £505,578 | 6% |
38 Properties |
| 2023 | £472,758 | -20% |
29 Properties |
| 2022 | £567,181 | 17% |
43 Properties |
| 2021 | £469,872 | 2% |
59 Properties |
| 2020 | £459,287 | 2% |
36 Properties |
| 2019 | £447,912 | -1% |
32 Properties |
| 2018 | £452,653 | 4% |
34 Properties |
| 2017 | £434,153 | -15% |
41 Properties |
| 2016 | £498,978 | 20% |
51 Properties |
| 2015 | £399,498 | 25% |
43 Properties |
| 2014 | £300,535 | -4% |
42 Properties |
| 2013 | £312,034 | -10% |
36 Properties |
| 2012 | £344,725 | 27% |
25 Properties |
| 2011 | £253,226 | -23% |
15 Properties |
| 2010 | £311,369 | 2% |
37 Properties |
| 2009 | £306,147 | 7% |
34 Properties |
| 2008 | £285,260 | -25% |
25 Properties |
| 2007 | £357,949 | 14% |
45 Properties |
| 2006 | £308,675 | 1% |
58 Properties |
| 2005 | £306,336 | 0,3% |
64 Properties |
| 2004 | £305,287 | 15% |
53 Properties |
| 2003 | £259,521 | -1% |
44 Properties |
| 2002 | £262,005 | 30% |
68 Properties |
| 2001 | £183,243 | -2% |
43 Properties |
| 2000 | £186,960 | 32% |
40 Properties |
| 1999 | £126,838 | 6% |
34 Properties |
| 1998 | £119,817 | -1% |
37 Properties |
| 1997 | £120,723 | 7% |
40 Properties |
| 1996 | £112,574 | 9% |
35 Properties |
| 1995 | £102,534 | - |
26 Properties |
Property Price per Property Type in Charing
Here you can find historic sold price data in order to help with your property search.
The average Property Paid Price for specific property types in the last three years are:
| Property Type | Average Sold Price | Sold Properties |
|---|---|---|
| Semi Detached House | £408,020.00 | 25 Semi Detached Houses |
| Detached House | £642,136.00 | 42 Detached Houses |
| Terraced House | £298,277.00 | 18 Terraced Houses |
| Flat | £188,125.00 | 4 Flats |

