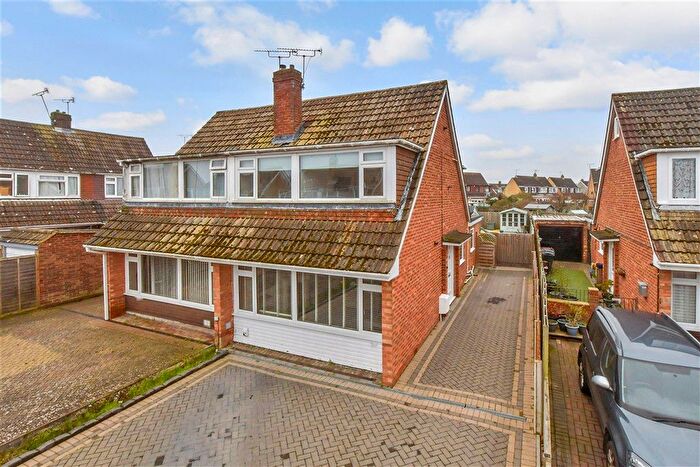
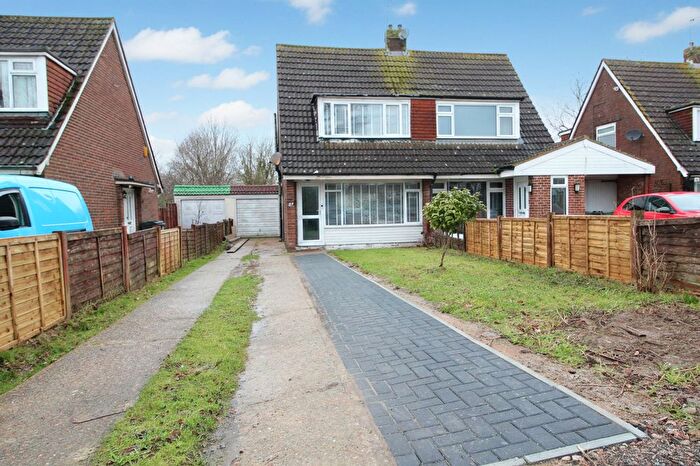
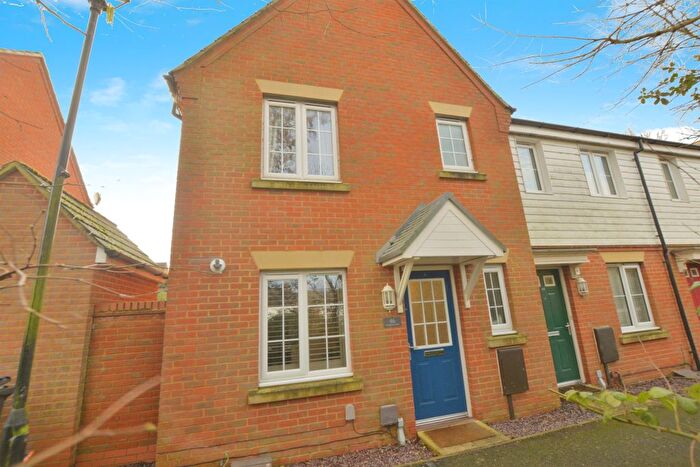
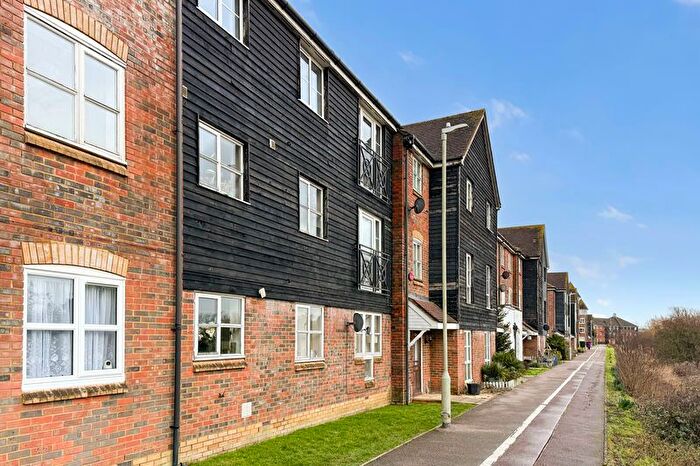
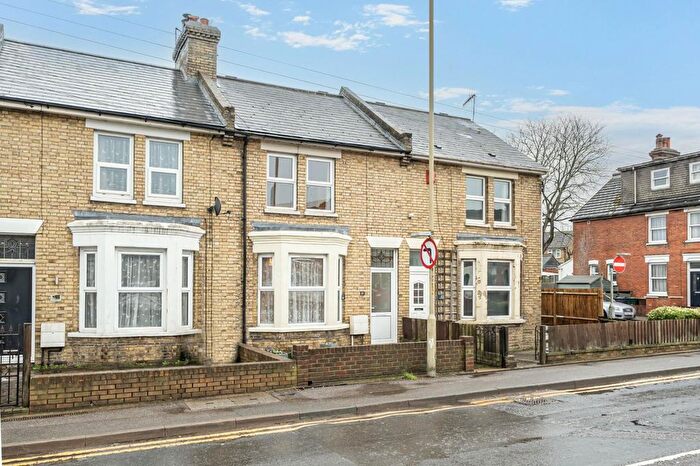
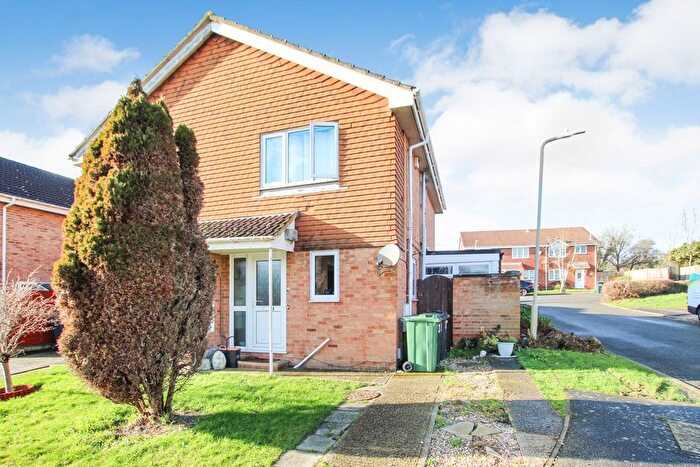
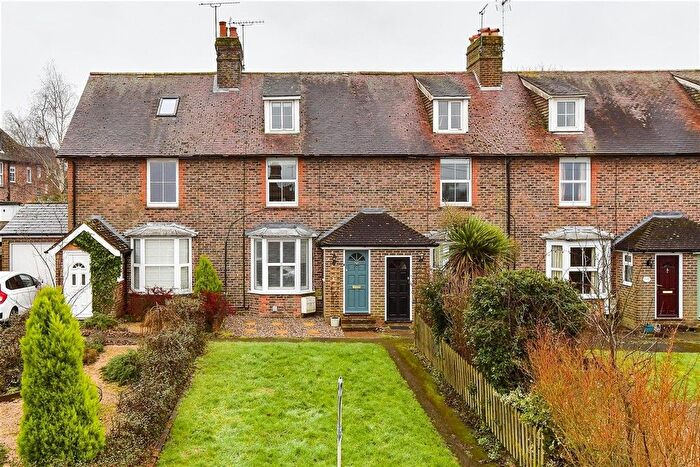
Houses for sale & to rent in Ashford, Kent
House Prices in Ashford
Properties in Ashford have an average house price of £362,700.00 and had 4,328 Property Transactions within the last 3 years.¹
Ashford is an area in Kent with 44,444 households², where the most expensive property was sold for £1,580,000.00.
Properties for sale in Ashford
Neighbourhoods in Ashford
Navigate through our locations to find the location of your next house in Ashford, Kent for sale or to rent.
- Aylesford Green
- Beaver
- Benenden And Cranbrook
- Biddenden
- Bockhanger
- Boughton Aluph And Eastwell
- Bybrook
- Charing
- Downs North
- Downs West
- East Downs
- Frittenden And Sissinghurst
- Godinton
- Great Chart With Singleton North
- Headcorn
- Highfield
- Isle Of Oxney
- Kennington
- Little Burton Farm
- Lympne And Stanford
- Norman
- North Downs
- North Downs West
- North Willesborough
- Park Farm North
- Park Farm South
- Romney Marsh
- Saxon Shore
- Singleton South
- South Willesborough
- Stanhope
- Stour
- Victoria
- Washford
- Weald Central
- Weald East
- Weald North
- Weald South
- Wye
- Singleton East
- Upper Weald
- Aylesford & East Stour
- Willesborough
- Mersham, Sevington South with Finberry
- Conningbrook & Little Burton Farm
- Furley
- Goat Lees
- Wye with Hinxhill
- Bircholt
- Hythe Rural
- Kingsnorth Village & Bridgefield
- Walland & Denge Marsh
- Tenterden St Michael's
- Repton
- Roman
Transport in Ashford
Please see below transportation links in this area:
- FAQ
- Price Paid By Year
- Property Type Price
Frequently asked questions about Ashford
What is the average price for a property for sale in Ashford?
The average price for a property for sale in Ashford is £362,700. This amount is 8% lower than the average price in Kent. There are more than 10,000 property listings for sale in Ashford.
What locations have the most expensive properties for sale in Ashford?
The locations with the most expensive properties for sale in Ashford are Downs North at an average of £643,500, Lympne And Stanford at an average of £587,900 and Biddenden at an average of £574,995.
What locations have the most affordable properties for sale in Ashford?
The locations with the most affordable properties for sale in Ashford are Stanhope at an average of £236,617, South Willesborough at an average of £250,222 and Norman at an average of £254,580.
Which train stations are available in or near Ashford?
Some of the train stations available in or near Ashford are Ashford International, Pluckley and Wye.
Property Price Paid in Ashford by Year
The average sold property price by year was:
| Year | Average Sold Price | Price Change |
Sold Properties
|
|---|---|---|---|
| 2025 | £366,131 | 2% |
1,392 Properties |
| 2024 | £360,421 | -0,4% |
1,560 Properties |
| 2023 | £361,813 | -4% |
1,376 Properties |
| 2022 | £377,544 | 6% |
1,960 Properties |
| 2021 | £354,497 | 2% |
2,627 Properties |
| 2020 | £346,351 | 9% |
1,964 Properties |
| 2019 | £315,475 | -1% |
2,058 Properties |
| 2018 | £318,049 | 6% |
2,058 Properties |
| 2017 | £299,457 | 9% |
2,363 Properties |
| 2016 | £271,262 | 2% |
2,607 Properties |
| 2015 | £265,576 | 8% |
2,391 Properties |
| 2014 | £245,260 | 4% |
2,114 Properties |
| 2013 | £235,382 | 8% |
1,734 Properties |
| 2012 | £217,320 | 1% |
1,520 Properties |
| 2011 | £214,534 | -4% |
1,672 Properties |
| 2010 | £223,058 | 5% |
1,684 Properties |
| 2009 | £212,631 | -6% |
1,483 Properties |
| 2008 | £225,844 | -1% |
1,352 Properties |
| 2007 | £227,866 | 7% |
2,547 Properties |
| 2006 | £212,851 | 7% |
2,756 Properties |
| 2005 | £198,419 | 4% |
2,595 Properties |
| 2004 | £191,284 | 10% |
3,100 Properties |
| 2003 | £172,420 | 12% |
2,588 Properties |
| 2002 | £151,219 | 14% |
2,951 Properties |
| 2001 | £130,328 | 11% |
2,852 Properties |
| 2000 | £116,429 | 17% |
2,386 Properties |
| 1999 | £96,753 | 4% |
2,105 Properties |
| 1998 | £92,444 | 10% |
1,968 Properties |
| 1997 | £82,747 | 5% |
2,106 Properties |
| 1996 | £78,746 | 9% |
1,715 Properties |
| 1995 | £72,032 | - |
1,537 Properties |
Property Price per Property Type in Ashford
Here you can find historic sold price data in order to help with your property search.
The average Property Paid Price for specific property types in the last three years are:
| Property Type | Average Sold Price | Sold Properties |
|---|---|---|
| Semi Detached House | £339,047.00 | 1,259 Semi Detached Houses |
| Terraced House | £281,201.00 | 1,344 Terraced Houses |
| Detached House | £549,899.00 | 1,234 Detached Houses |
| Flat | £175,961.00 | 491 Flats |

