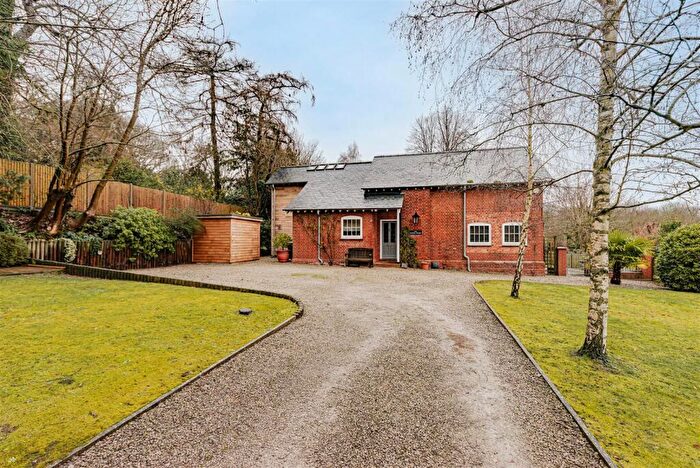
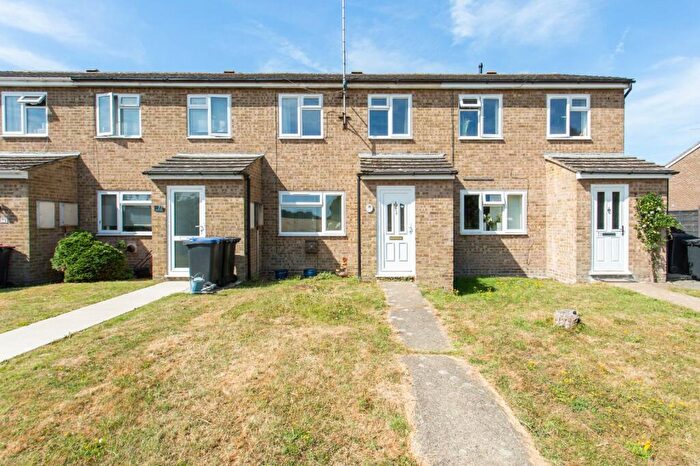
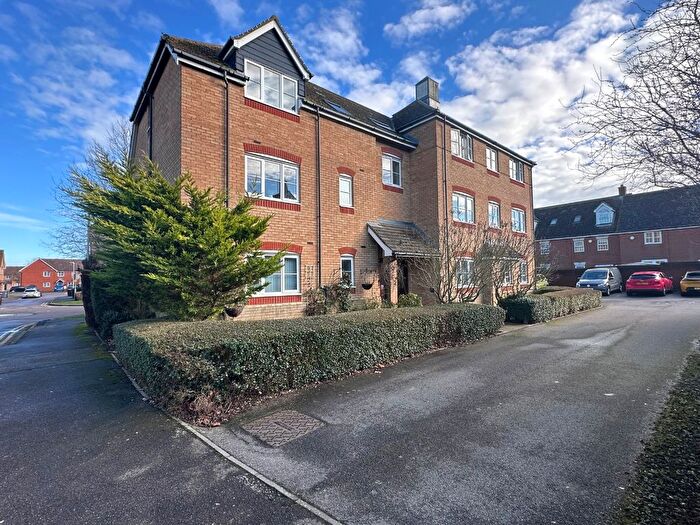
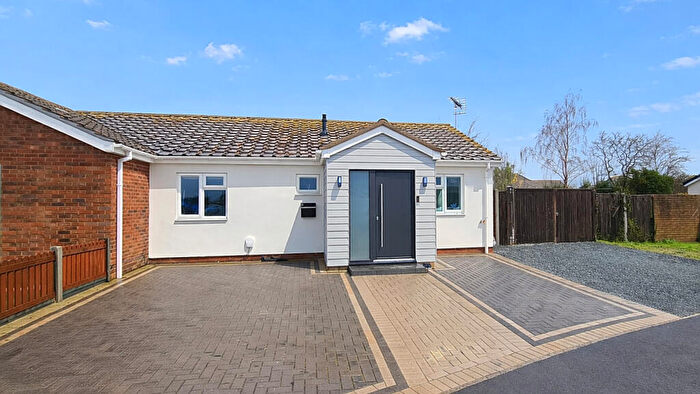
Houses for sale & to rent in Marshside, Canterbury
House Prices in Marshside
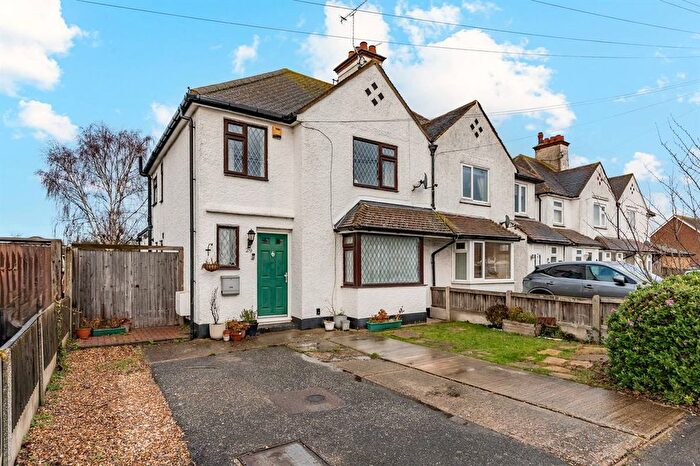
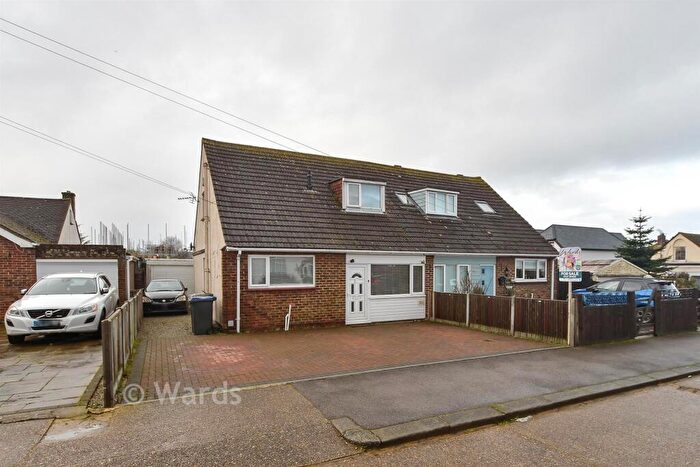
Properties in Marshside have an average house price of £348,780.00 and had 97 Property Transactions within the last 3 years¹.
Marshside is an area in Canterbury, Kent with 1,215 households², where the most expensive property was sold for £970,000.00.
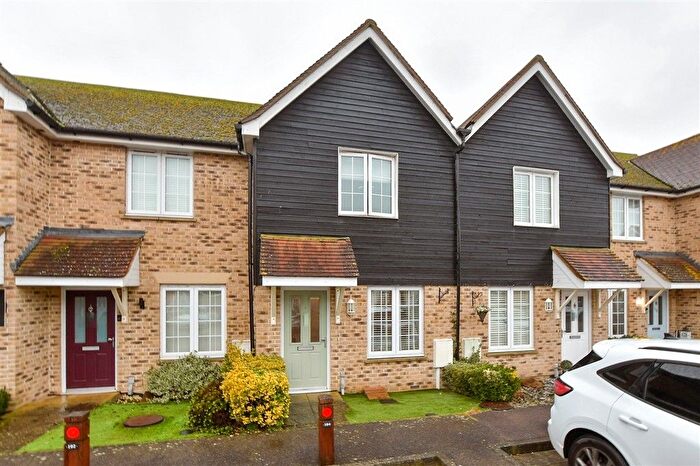
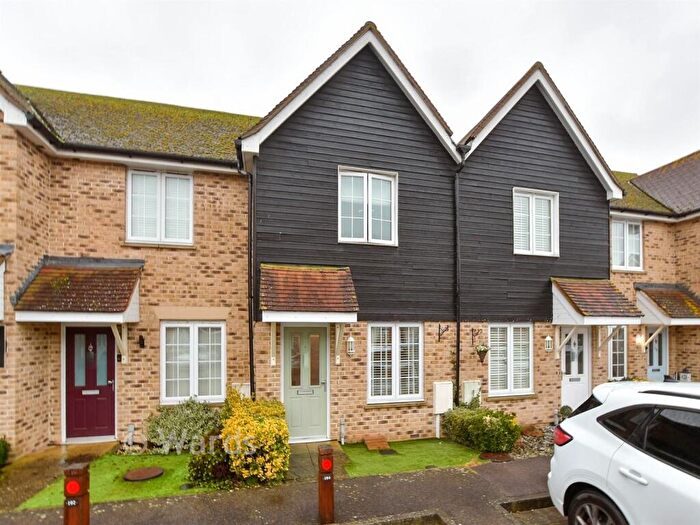
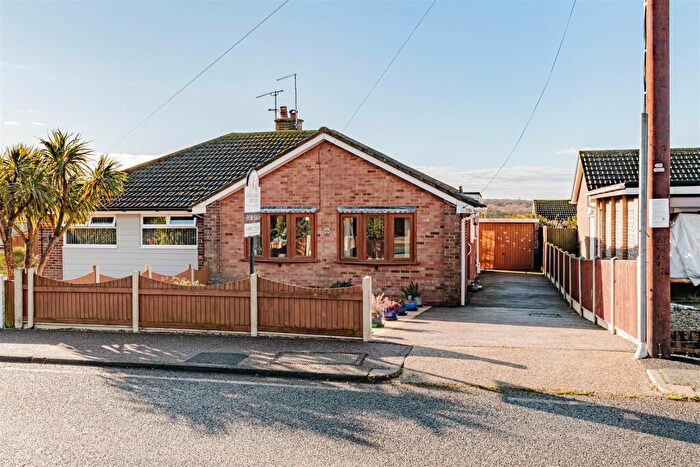
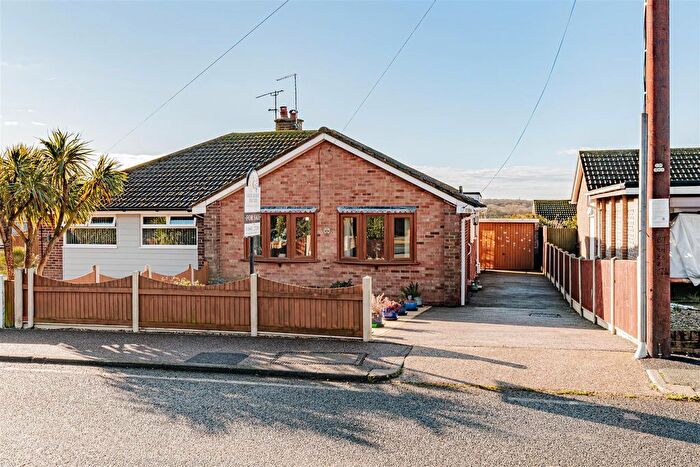
Properties for sale in Marshside
Roads and Postcodes in Marshside
Navigate through our locations to find the location of your next house in Marshside, Canterbury for sale or to rent.
| Streets | Postcodes |
|---|---|
| Aberdeen Close | CT3 4BX |
| Abingdon Grove | CT3 4DW |
| Acacia Drive | CT3 4GD |
| Ash Crescent | CT3 4HU |
| Barn Close | CT3 4JU |
| Becketts Wood | CT3 4DQ |
| Blackthorn Road | CT3 4GA CT3 4GB |
| Boyden Gate Hill | CT3 4ED |
| Bushy Hill Road | CT2 0HE |
| Canterbury Industrial Park | CT3 4HQ |
| Chapel Lane | CT3 4EP |
| Chislet Forstal | CT3 4DT |
| Chislet Park Farm Cottages | CT3 4BY |
| Church Lane | CT2 0HA CT3 4EB |
| East View | CT3 4HH |
| Ford | CT3 4LT |
| Forge Lane | CT3 4EF |
| Grove Ferry Hill | CT3 4DH |
| Hazel Court | CT3 4GJ |
| Highstead | CT3 4LX |
| Hoath Road | CT3 4JN CT3 4JP |
| Hollow Street | CT3 4DS |
| Island Road | CT2 0EX CT3 4BZ CT3 4DA CT3 4DD CT3 4DE CT3 4HD CT3 4HG CT3 4JD |
| Knaves Ash | CT3 4JR |
| Larch Close | CT3 4GE |
| Maple Court | CT3 4JF |
| Maple Gardens | CT3 4HZ |
| Marley Lane | CT3 4JX CT3 4JY |
| Maypole | CT3 4LN CT3 4LW |
| Maypole Lane | CT3 4LJ CT3 4LL |
| Millbank | CT3 4LP CT3 4LR |
| Nethergong Hill | CT3 4DN |
| North Stream | CT3 4EE CT3 4EG CT3 4EL CT3 4EN CT3 4EQ |
| North View | CT3 4HJ |
| Old Tree | CT3 4LE |
| Old Tree Road | CT3 4LH |
| Pennington Close | CT2 0HL |
| Puddledock | CT3 4DP |
| Reynolds Lane | CT3 4EJ |
| Shaftesbury Road | CT3 4HS |
| Shelvingford | CT3 4LG |
| Six Bells Cottages | CT3 4DX |
| South View | CT3 4EY CT3 4HE CT3 4HF |
| St Albans Road | CT3 4EU CT3 4EX |
| St Marys Gardens | CT3 4DJ |
| Staines Hill | CT2 0ET |
| Stour Valley Close | CT3 4DB |
| Sutton Road | CT3 4HW |
| The Avenue | CT3 4GF CT3 4HL CT3 4HR CT3 4HX |
| The Elms | CT3 4HP |
| The Firs | CT3 4HT |
| The Glen | CT3 4DL |
| The Oaks | CT3 4HN |
| The Poplars | CT3 4EZ |
| The Row | CT3 4LA |
| The Sycamores | CT3 4JA |
| The Villas | CT3 4HA |
| Thomas Way | CT3 4NH |
| Under The Wood | CT3 4LY |
| Walnut Tree Lane | CT2 0HG |
| Westbere Lane | CT2 0HH CT2 0HJ |
| Woodview | CT3 4LD |
| CT3 4JT |
Transport near Marshside
- FAQ
- Price Paid By Year
- Property Type Price
Frequently asked questions about Marshside
What is the average price for a property for sale in Marshside?
The average price for a property for sale in Marshside is £348,780. This amount is 7% lower than the average price in Canterbury. There are 1,559 property listings for sale in Marshside.
What streets have the most expensive properties for sale in Marshside?
The streets with the most expensive properties for sale in Marshside are Highstead at an average of £735,666, Pennington Close at an average of £603,593 and Walnut Tree Lane at an average of £552,500.
What streets have the most affordable properties for sale in Marshside?
The streets with the most affordable properties for sale in Marshside are St Albans Road at an average of £103,000, Blackthorn Road at an average of £195,200 and Maple Gardens at an average of £238,500.
Which train stations are available in or near Marshside?
Some of the train stations available in or near Marshside are Sturry, Herne Bay and Bekesbourne.
Property Price Paid in Marshside by Year
The average sold property price by year was:
| Year | Average Sold Price | Price Change |
Sold Properties
|
|---|---|---|---|
| 2025 | £370,055 | 17% |
34 Properties |
| 2024 | £307,330 | -18% |
29 Properties |
| 2023 | £362,860 | -23% |
34 Properties |
| 2022 | £444,889 | 14% |
50 Properties |
| 2021 | £384,716 | 23% |
62 Properties |
| 2020 | £295,848 | -4% |
43 Properties |
| 2019 | £308,363 | 7% |
39 Properties |
| 2018 | £288,000 | 10% |
54 Properties |
| 2017 | £260,552 | 0,5% |
66 Properties |
| 2016 | £259,289 | 6% |
69 Properties |
| 2015 | £242,731 | 5% |
62 Properties |
| 2014 | £230,087 | 2% |
63 Properties |
| 2013 | £224,729 | 7% |
41 Properties |
| 2012 | £208,439 | -14% |
46 Properties |
| 2011 | £238,543 | -0,1% |
34 Properties |
| 2010 | £238,810 | 8% |
34 Properties |
| 2009 | £219,323 | -3% |
30 Properties |
| 2008 | £224,970 | 6% |
36 Properties |
| 2007 | £211,102 | -10% |
78 Properties |
| 2006 | £232,062 | 21% |
69 Properties |
| 2005 | £182,555 | 7% |
126 Properties |
| 2004 | £169,361 | -7% |
146 Properties |
| 2003 | £181,515 | 15% |
54 Properties |
| 2002 | £155,089 | 6% |
61 Properties |
| 2001 | £145,190 | 17% |
49 Properties |
| 2000 | £120,032 | 8% |
47 Properties |
| 1999 | £110,044 | 9% |
36 Properties |
| 1998 | £99,960 | -7% |
34 Properties |
| 1997 | £106,544 | 9% |
55 Properties |
| 1996 | £97,437 | 35% |
36 Properties |
| 1995 | £63,363 | - |
22 Properties |
Property Price per Property Type in Marshside
Here you can find historic sold price data in order to help with your property search.
The average Property Paid Price for specific property types in the last three years are:
| Property Type | Average Sold Price | Sold Properties |
|---|---|---|
| Semi Detached House | £336,673.00 | 36 Semi Detached Houses |
| Detached House | £534,538.00 | 26 Detached Houses |
| Terraced House | £250,979.00 | 24 Terraced Houses |
| Flat | £162,727.00 | 11 Flats |

