
Houses for sale in Canterbury, Kent
House Prices in Canterbury
Properties in Canterbury have an average house price of £374k and had 3,477 Property Transactions within the last 3 years.¹
Canterbury is an area in Kent with 39,011 households², where the most expensive property was sold for £3.73M.
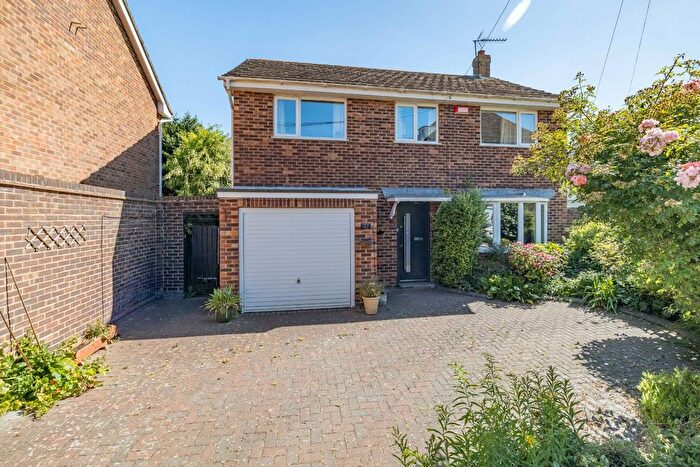
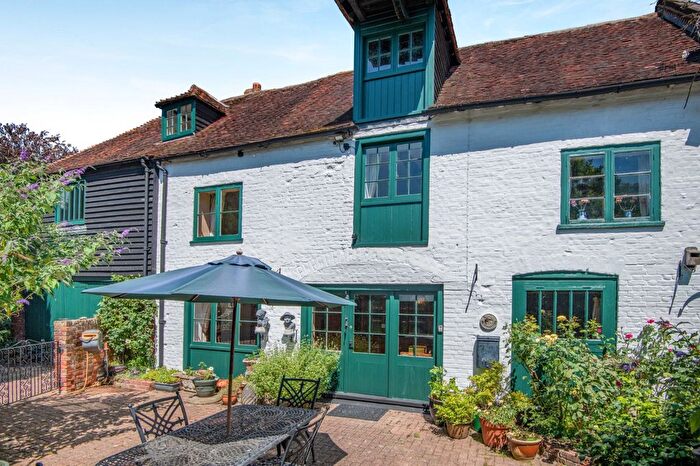
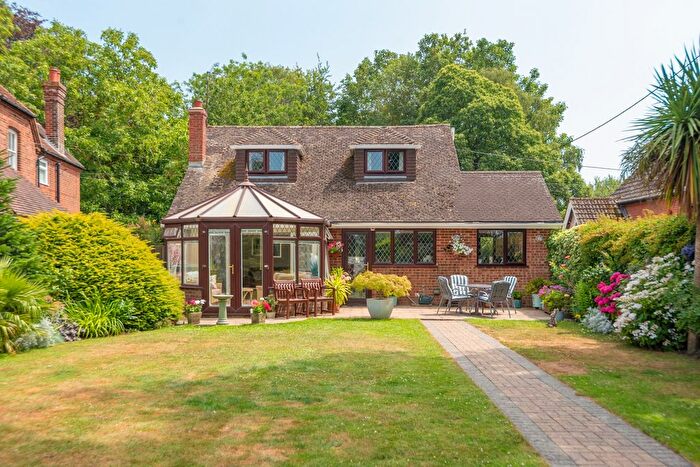
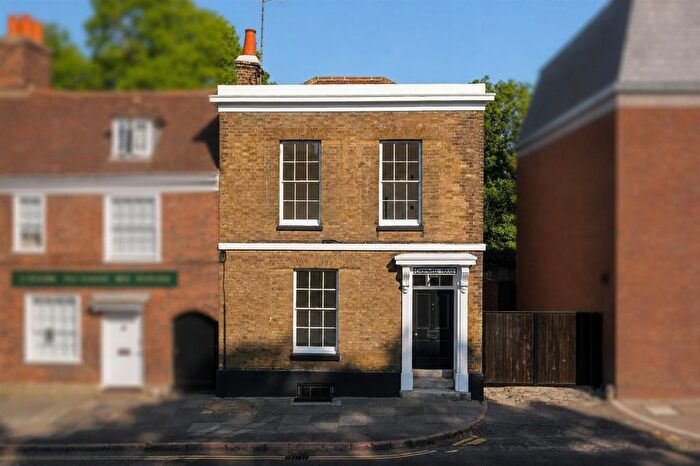
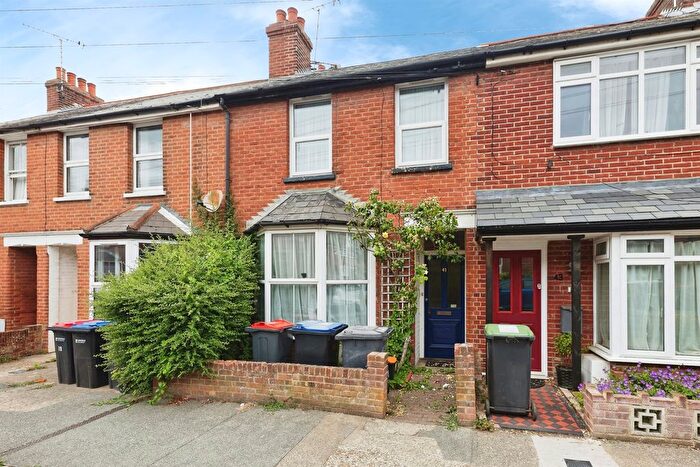
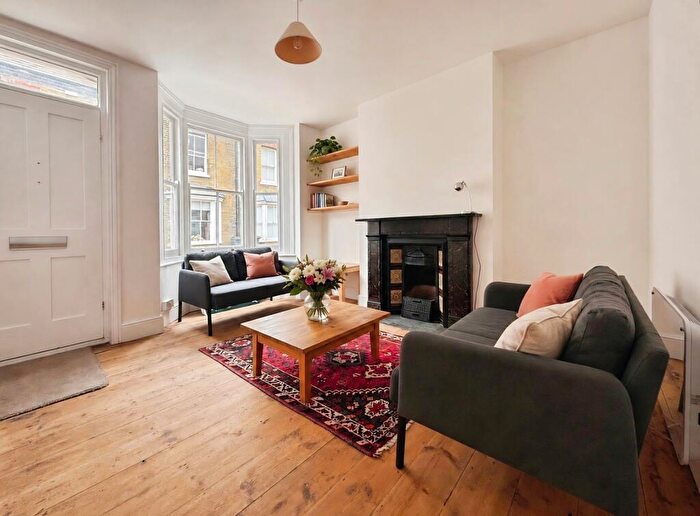
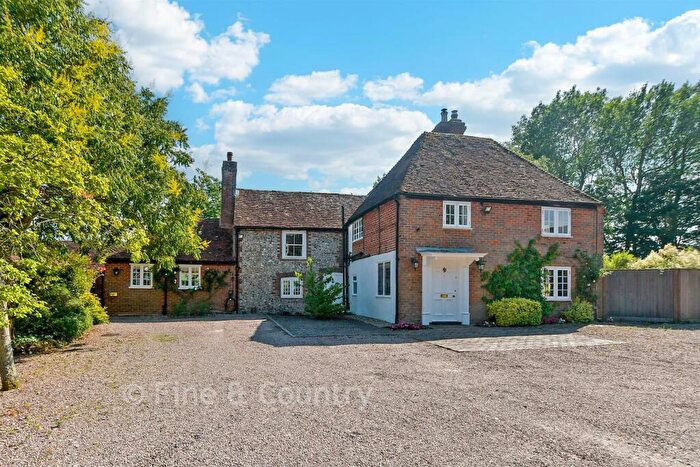
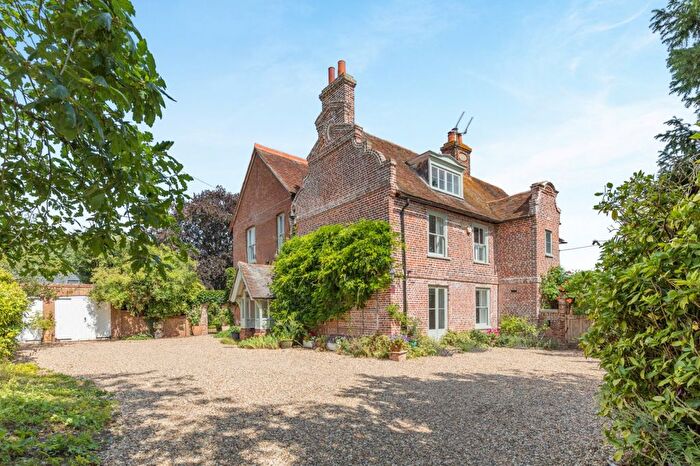
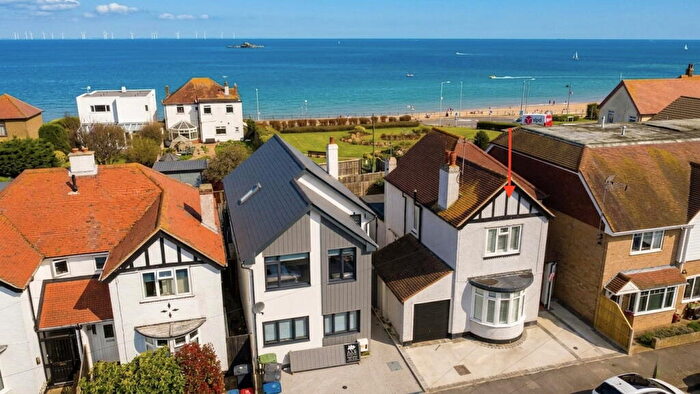
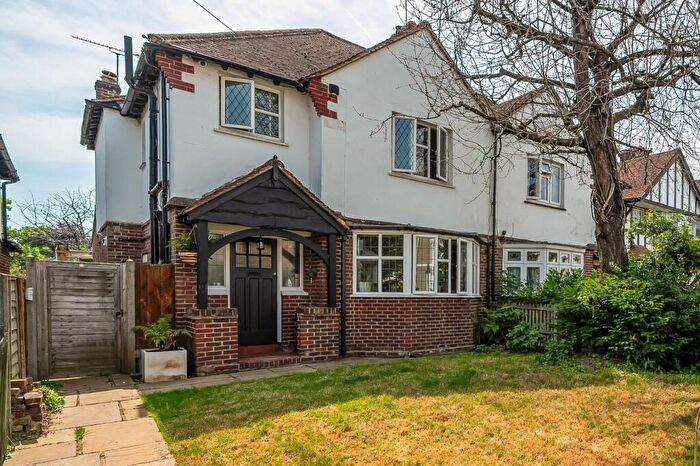
Properties for sale in Canterbury
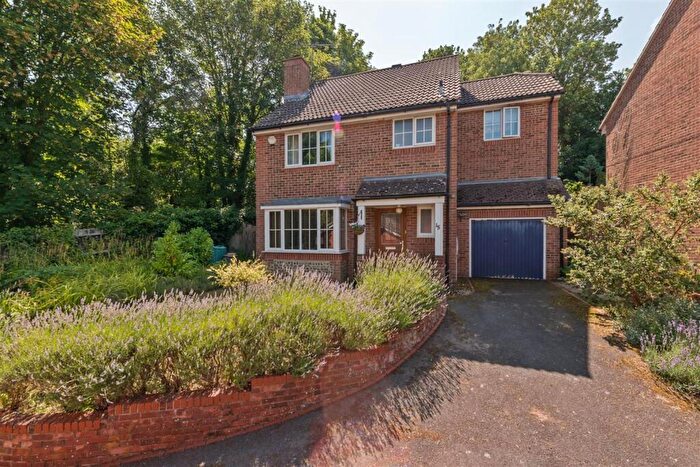

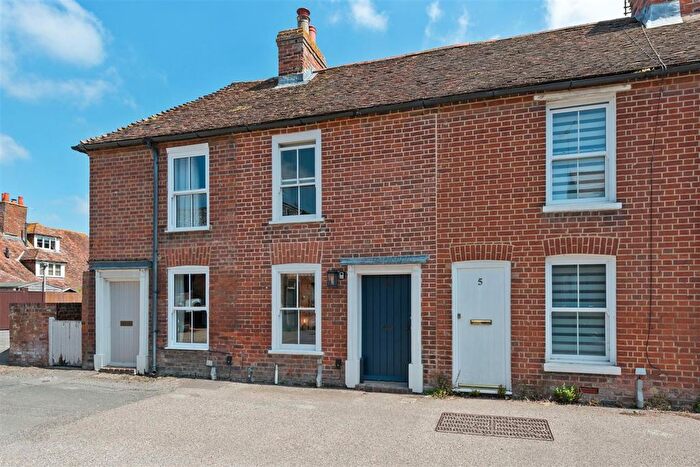
![]()
If you are looking to sell your house, let it out, or receive a property valuation, an expert can help you.
Click the button below to get started.


Neighbourhoods in Canterbury
Navigate through our locations to find the location of your next house in Canterbury, Kent for sale or to rent.
- Aylesham
- Barham Downs
- Barton
- Blean Forest
- Boughton And Courtenay
- Chartham And Stone Street
- Downs North
- Elham And Stelling Minnis
- Eythorne And Shepherdswell
- Harbledown
- Little Stour
- Little Stour And Ashstone
- Marshside
- North Downs West
- North Nailbourne
- Northgate
- Sandwich
- St Stephens
- Sturry North
- Sturry South
- Westgate
- Wincheap
- Sturry
- Chartham & Stone Street
- Little Stour & Ashstone
- Little Stour & Adisham
- Aylesham, Eythorne & Shepherdswell
- Nailbourne
- Dover Downs & River
- Reculver
Property price trends in Canterbury
According to the latest Land Registry data, the average home in Canterbury sold for £362,234 in 2026. That figure comes from a substantial record of 45,427 sales logged over the past 31 years.
Prices have softened over the last three years. Compared with 2023, when the typical sale came in around £381,066, that's a fall of roughly 4.9%.
Looking back five years, average prices are down about 2.5% since 2021, a drop of around £9,282 in cash terms.
Zoom out to the past decade for the fuller picture. Back in 2016, homes here averaged £297,188, so the typical sold price has climbed about 21.9% since then, roughly 2% a year. Stretch the view to fifteen years and that annual pace edges up closer to 2.9%.
Frequently asked questions about Canterbury
What is the average price for a property for sale in Canterbury?
The average price for a property for sale in Canterbury is £374,199. This amount is 5% lower than the average price in Kent. There are more than 10,000 property listings for sale in Canterbury.
What locations have the most expensive properties for sale in Canterbury?
The locations with the most expensive properties for sale in Canterbury are North Downs West at an average of £713,666, Little Stour & Ashstone at an average of £710,875 and Little Stour & Adisham at an average of £591,775.
What locations have the most affordable properties for sale in Canterbury?
The locations with the most affordable properties for sale in Canterbury are Northgate at an average of £241,144, Aylesham at an average of £254,739 and Aylesham, Eythorne & Shepherdswell at an average of £287,648.
Which train stations are available in or near Canterbury?
Some of the train stations available in or near Canterbury are Bekesbourne, Canterbury East and Canterbury West.
Property Price Paid in Canterbury by Year
The average sold property price by year was:
| Year | Average Sold Price | Price Change |
Sold Properties
|
|---|---|---|---|
| 2026 | £362,234 | -2% |
75 Properties |
| 2025 | £367,743 | -2% |
1,131 Properties |
| 2024 | £374,792 | -2% |
1,179 Properties |
| 2023 | £381,066 | -2% |
1,092 Properties |
| 2022 | £390,300 | 5% |
1,480 Properties |
| 2021 | £371,516 | 7% |
1,895 Properties |
| 2020 | £344,625 | 3% |
1,233 Properties |
| 2019 | £333,939 | 3% |
1,496 Properties |
| 2018 | £323,956 | 3% |
1,550 Properties |
| 2017 | £313,745 | 5% |
1,585 Properties |
Property Price per Property Type in Canterbury
Here you can find historic sold price data in order to help with your property search.
The average Property Paid Price for specific property types in the last three years are:
| Property Type | Average Sold Price | Sold Properties |
|---|---|---|
| Semi Detached House | £351,110.00 | 1,028 Semi Detached Houses |
| Terraced House | £310,371.00 | 1,045 Terraced Houses |
| Detached House | £620,119.00 | 766 Detached Houses |
| Flat | £220,687.00 | 638 Flats |
Transport in Canterbury
Please see below transportation links in this area:
