
Houses for sale & to rent in TN18 4HJ, Queens Road, Hawkhurst And Sandhurst, Cranbrook
House Prices in TN18 4HJ, Queens Road, Hawkhurst And Sandhurst
Properties in TN18 4HJ have no sales history available within the last 3 years. TN18 4HJ is a postcode in Queens Road located in Hawkhurst And Sandhurst, an area in Cranbrook, Kent, with 5 households².
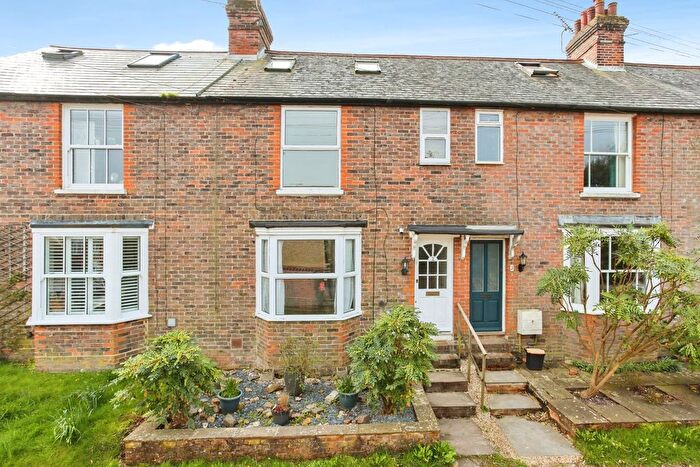
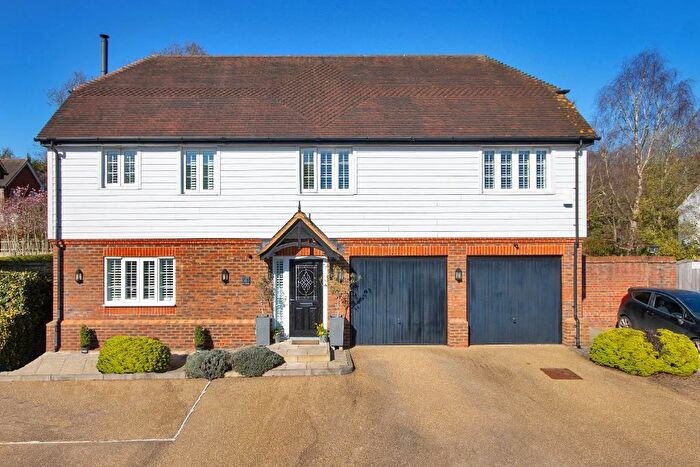
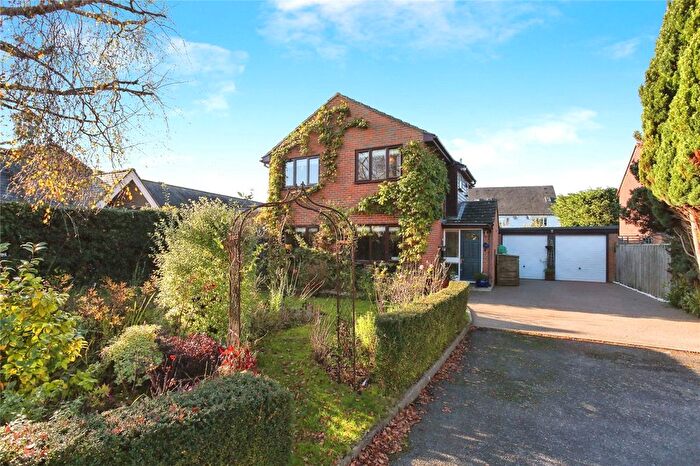
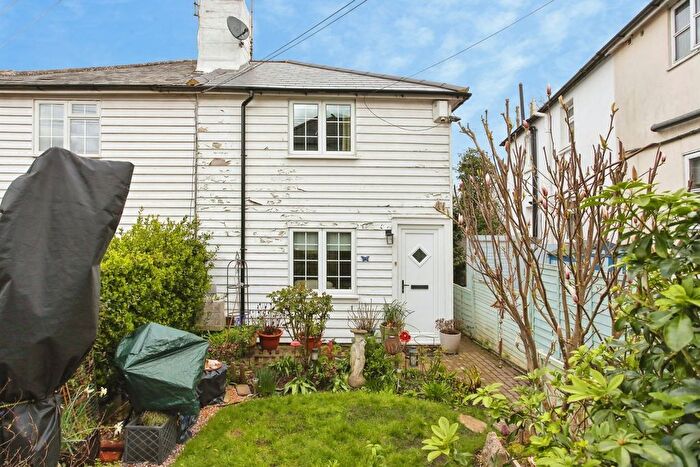
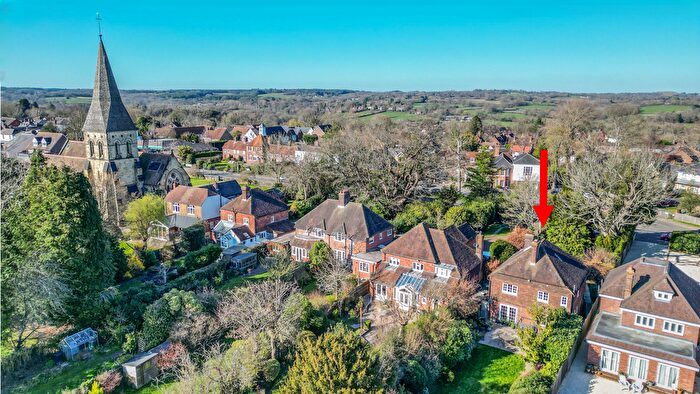
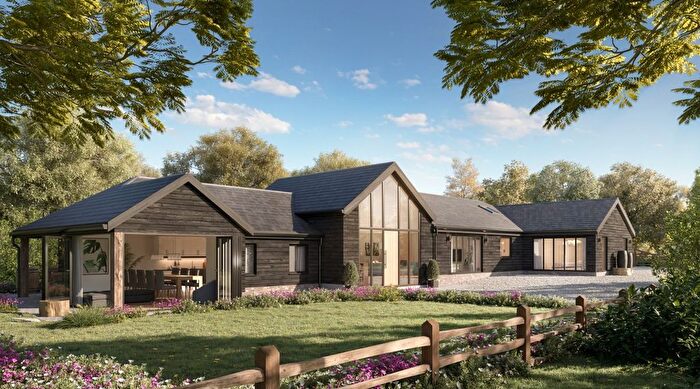
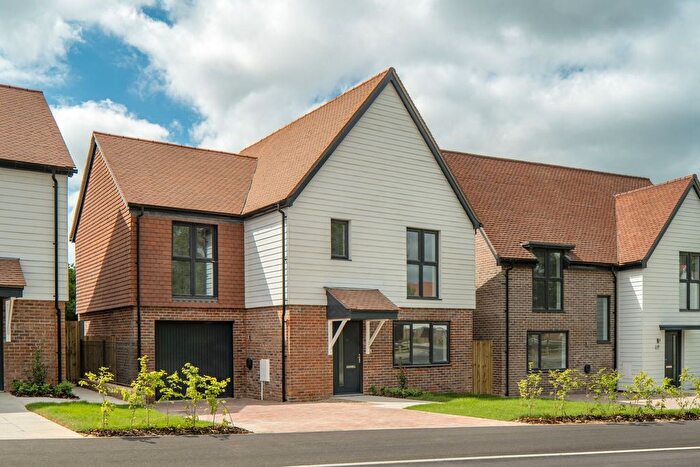
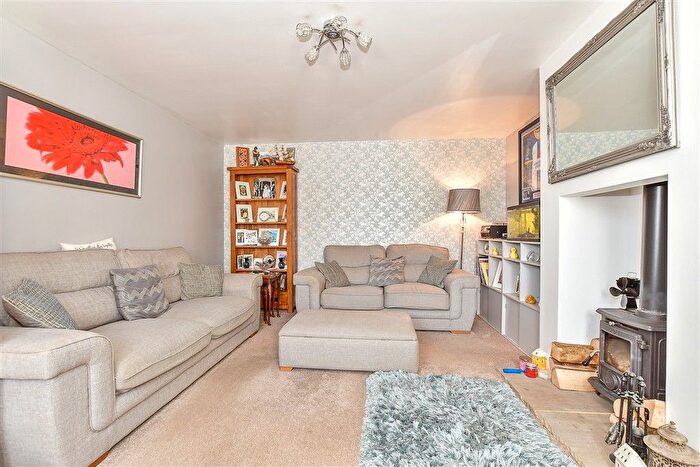
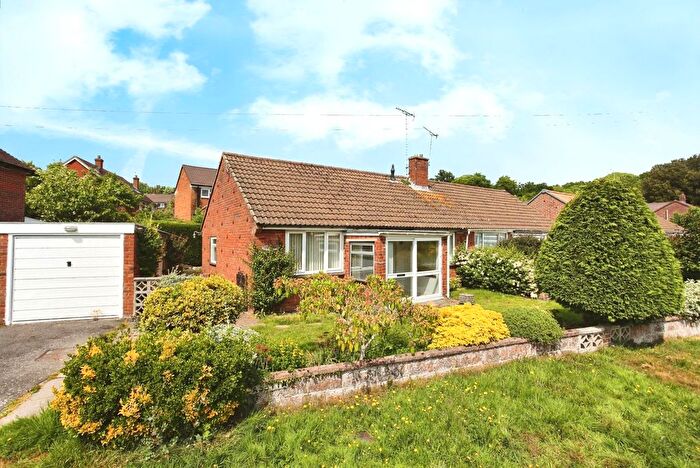
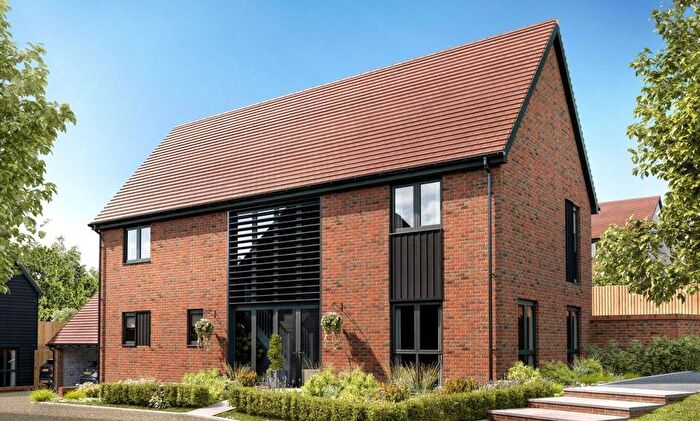
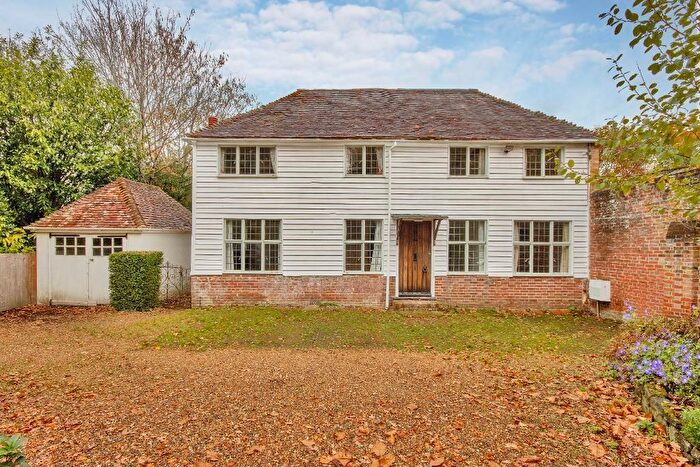
Properties for sale near TN18 4HJ, Queens Road
![]()
If you are looking to sell your house, let it out, or receive a property valuation, an expert can help you.
Click the button below to get started.
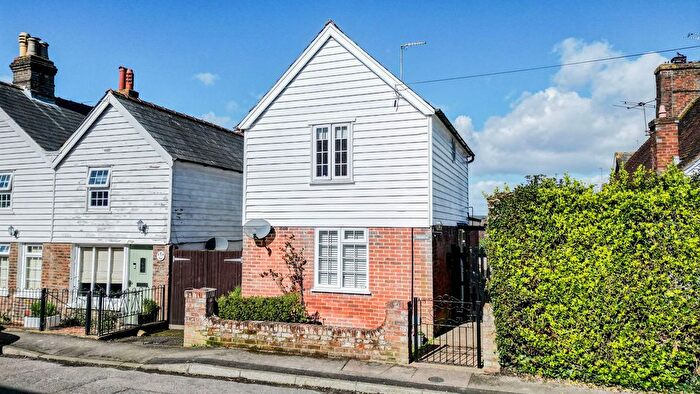
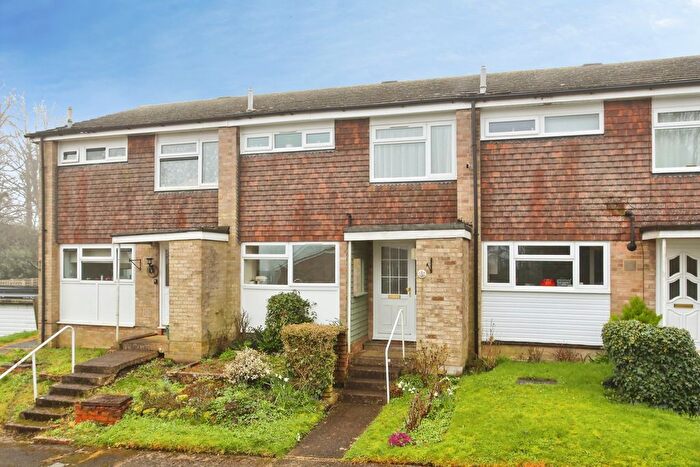
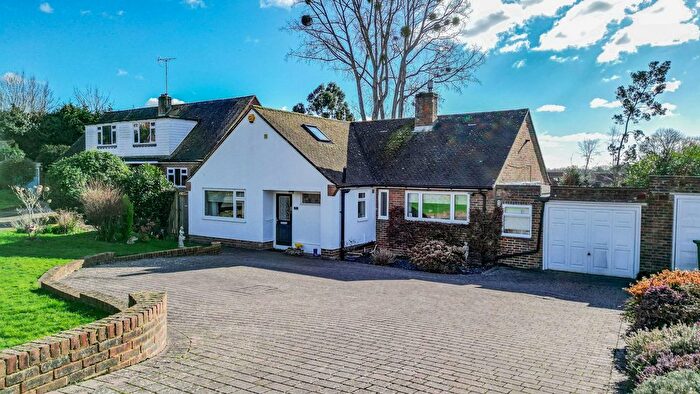
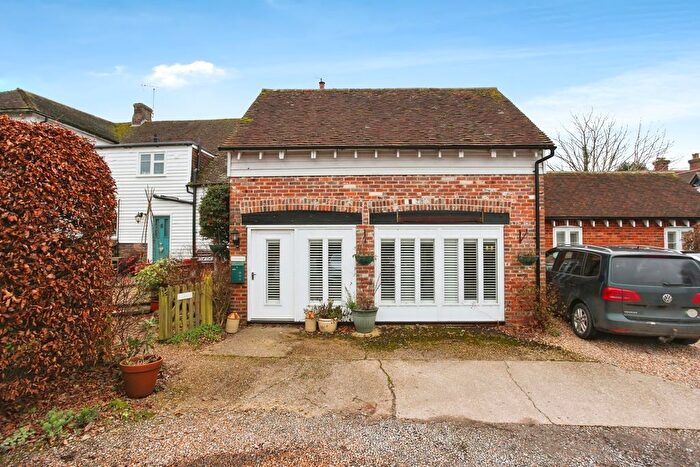
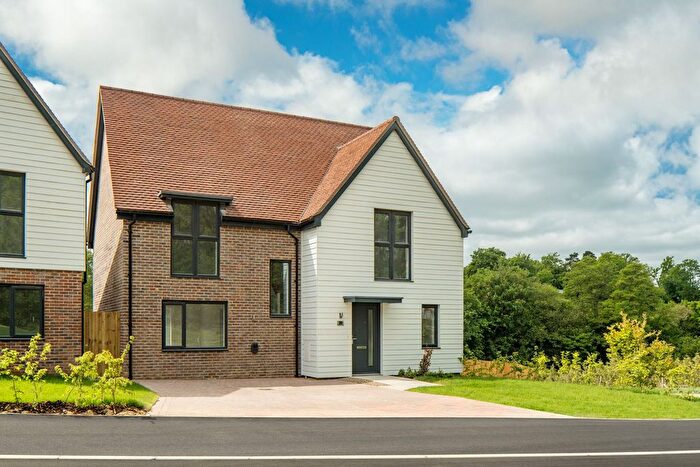
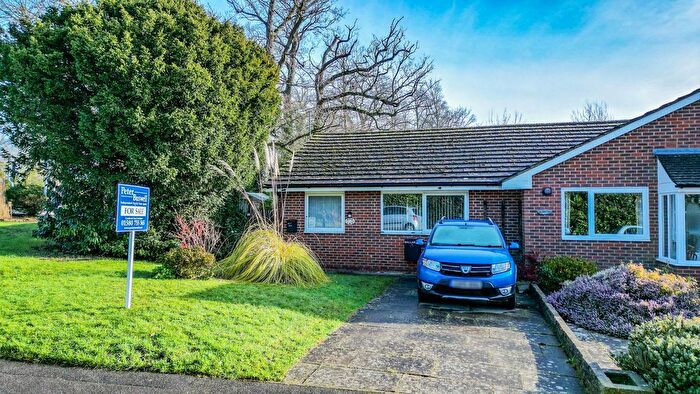
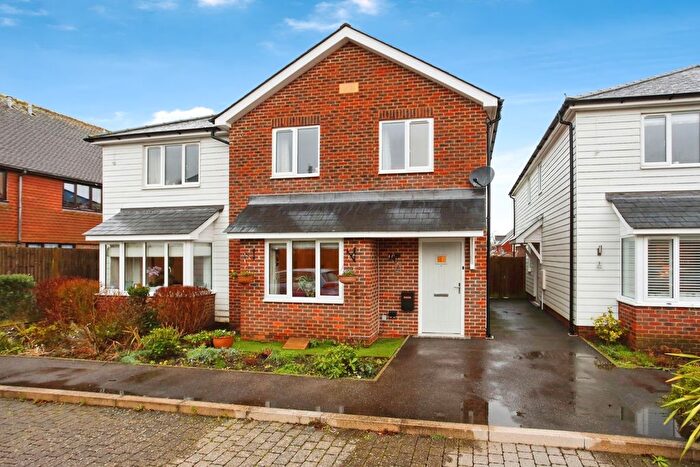
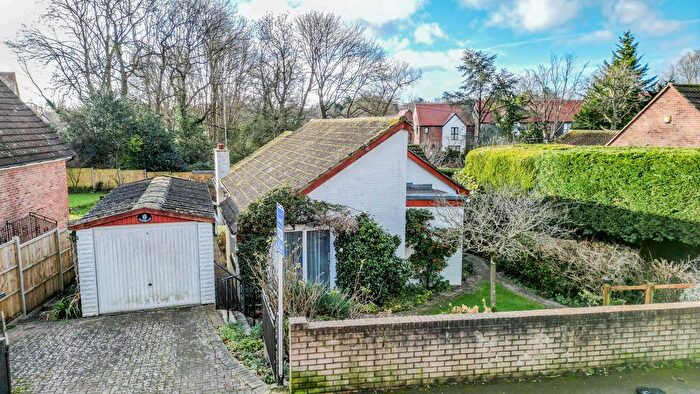
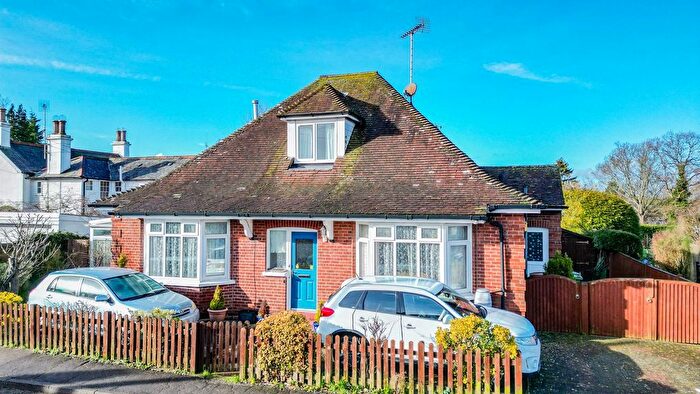
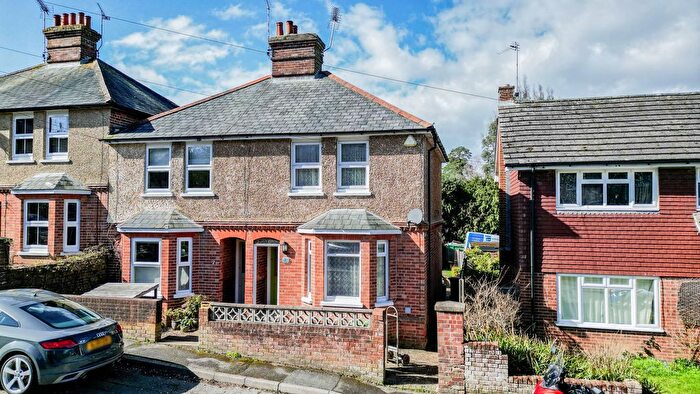
Previously listed properties near TN18 4HJ, Queens Road
Price Paid in Queens Road, TN18 4HJ, Hawkhurst And Sandhurst
4 Queens Road, TN18 4HJ, Hawkhurst And Sandhurst Cranbrook
Property 4 has been sold 3 times. The last time it was sold was in 26/11/2021 and the sold price was £340,000.00.
This terraced house, sold as a freehold on 26/11/2021, is a 81 sqm end-terrace house with an EPC rating of D.
| Date | Price | Property Type | Tenure | Classification |
|---|---|---|---|---|
| 26/11/2021 | £340,000.00 | Terraced House | freehold | Established Building |
| 13/11/2015 | £250,000.00 | Terraced House | freehold | Established Building |
| 25/02/2005 | £150,000.00 | Semi Detached House | freehold | Established Building |
3 Queens Road, TN18 4HJ, Hawkhurst And Sandhurst Cranbrook
Property 3 has been sold 1 time. The last time it was sold was in 26/11/1999 and the sold price was £88,500.00.
This is a Terraced House which was sold as a freehold in 26/11/1999
| Date | Price | Property Type | Tenure | Classification |
|---|---|---|---|---|
| 26/11/1999 | £88,500.00 | Terraced House | freehold | Established Building |
Postcodes in Queens Road, Hawkhurst And Sandhurst
Navigate through other locations in Queens Road, Hawkhurst And Sandhurst, Cranbrook to see more property listings for sale or to rent.
Transport near TN18 4HJ, Queens Road
-
 Etchingham Station
 -
Robertsbridge Station
-
Stonegate Station
-
Staplehurst Station
-
Marden Station
-
Wadhurst Station
-
Battle Station
-
Headcorn Station
-
Doleham Station
House price paid reports for TN18 4HJ, Queens Road
Click on the buttons below to see price paid reports by year or property price:
- Price Paid By Year
Property Price Paid in TN18 4HJ, Queens Road by Year
The average sold property price by year was:
| Year | Average Sold Price | Price Change |
Sold Properties
|
|---|---|---|---|
| 2021 | £340,000 | 26% |
1 Property |
| 2015 | £250,000 | 40% |
1 Property |
| 2005 | £150,000 | 41% |
1 Property |
| 1999 | £88,500 | - |
1 Property |