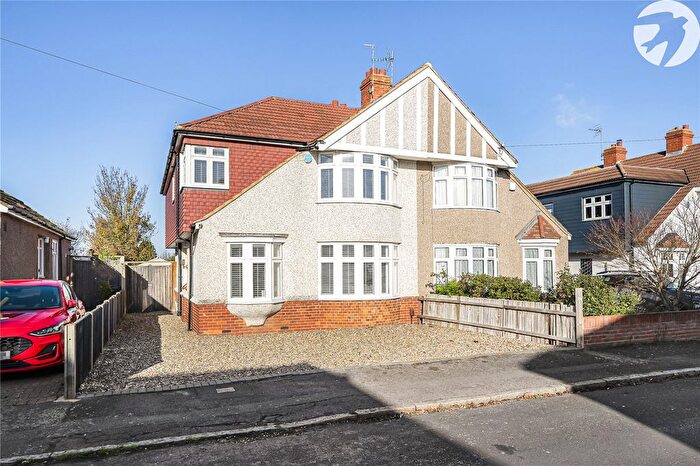
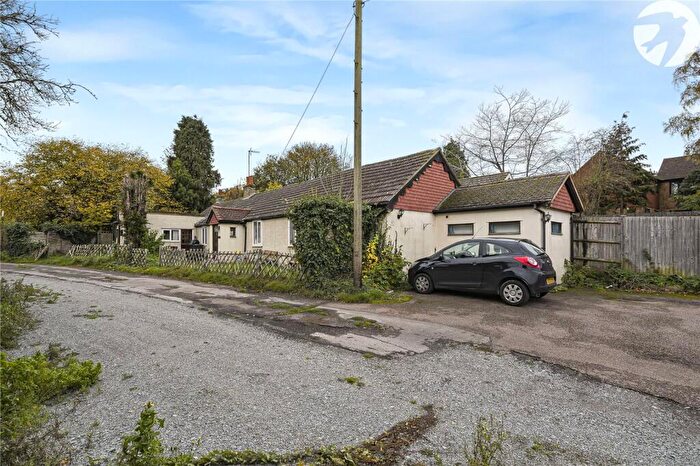
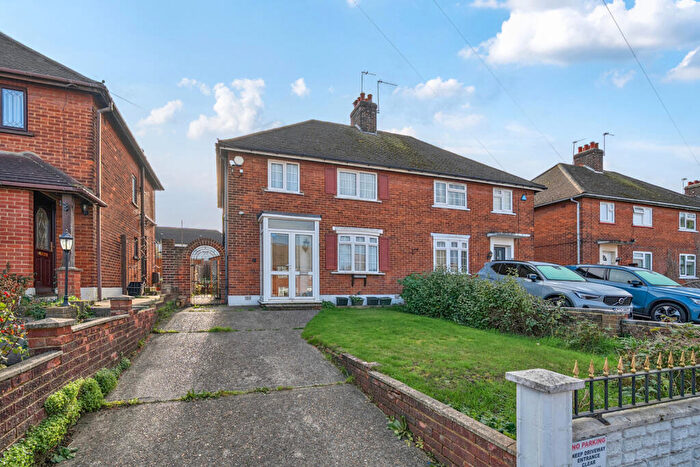
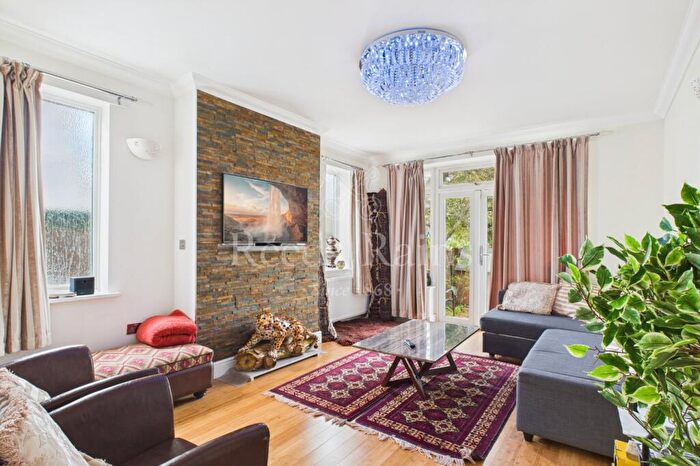
Houses for sale & to rent in Wilmington, Dartford
House Prices in Wilmington
Properties in Wilmington have an average house price of £471,337.00 and had 127 Property Transactions within the last 3 years¹.
Wilmington is an area in Dartford, Kent with 1,547 households², where the most expensive property was sold for £1,975,000.00.
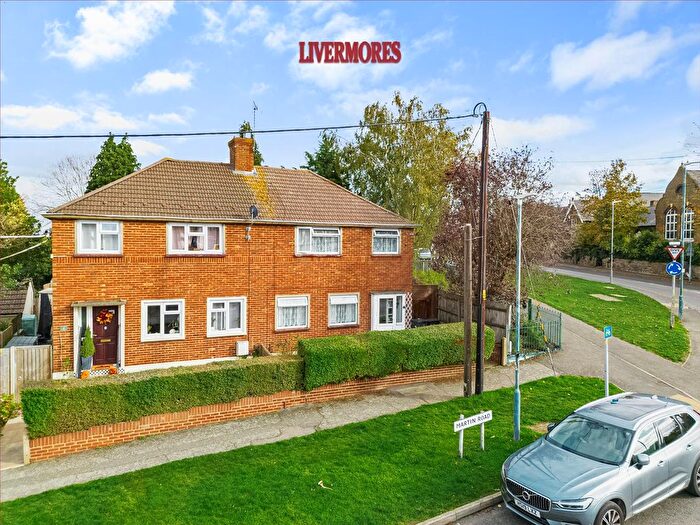
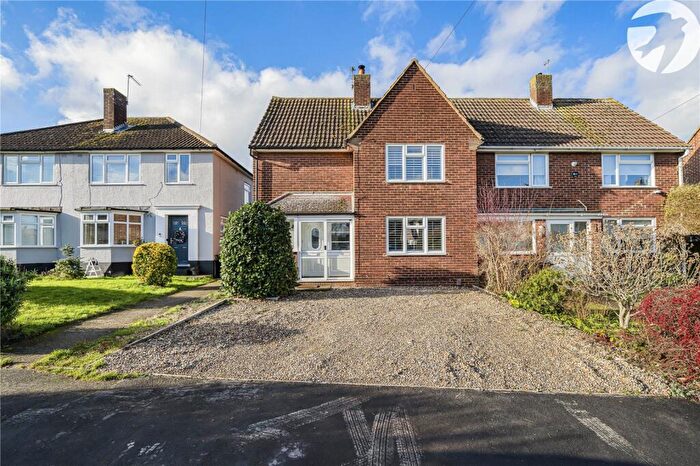
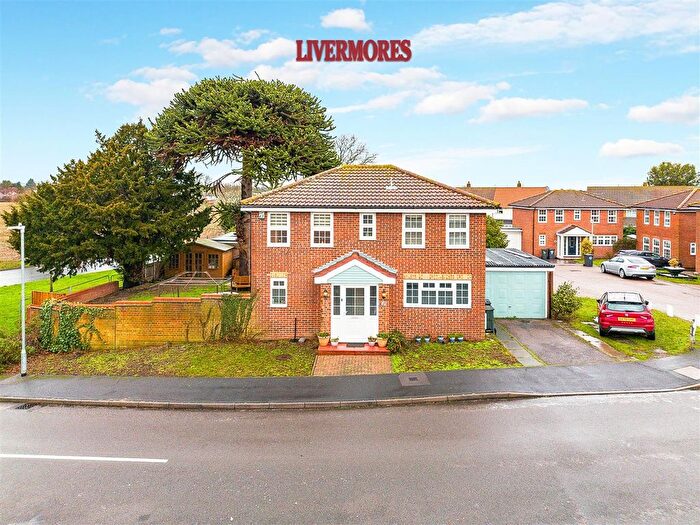
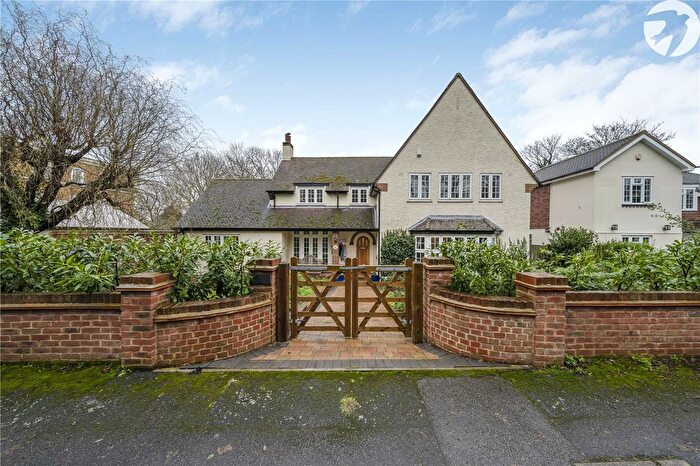
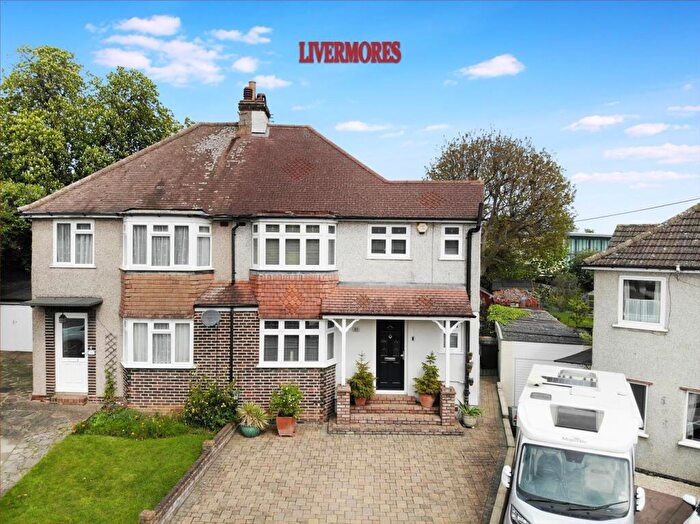
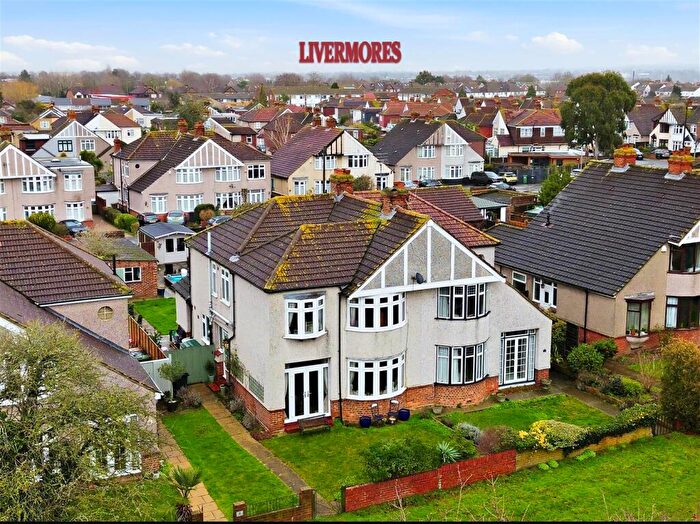
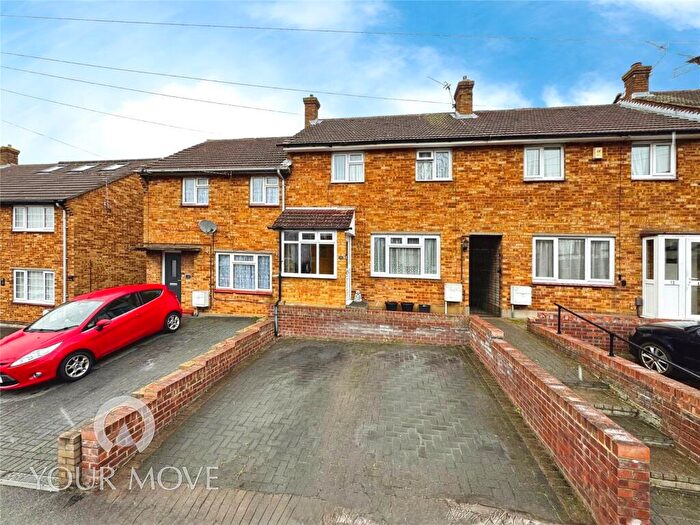
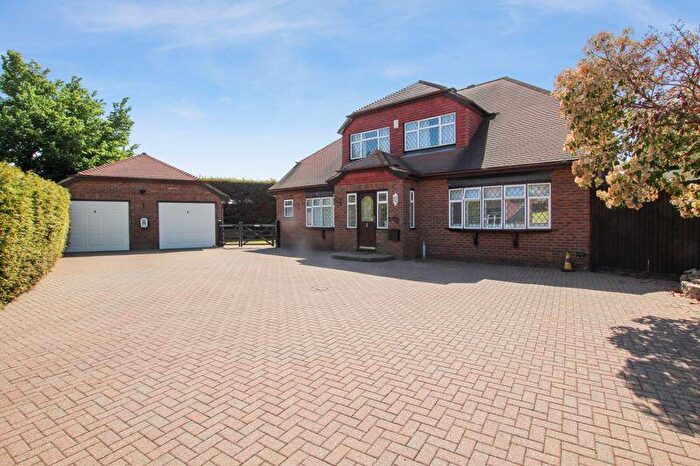
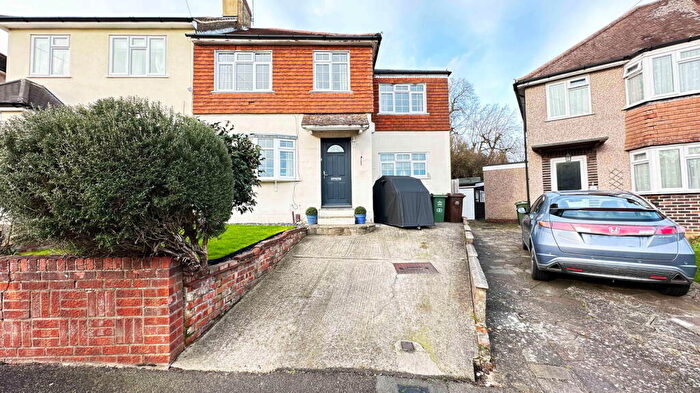
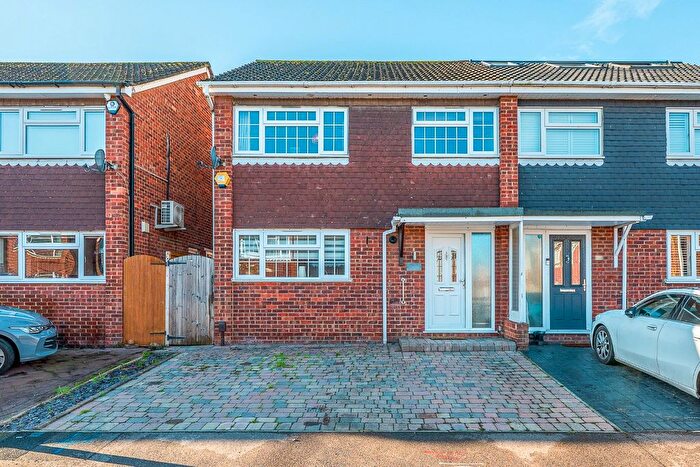
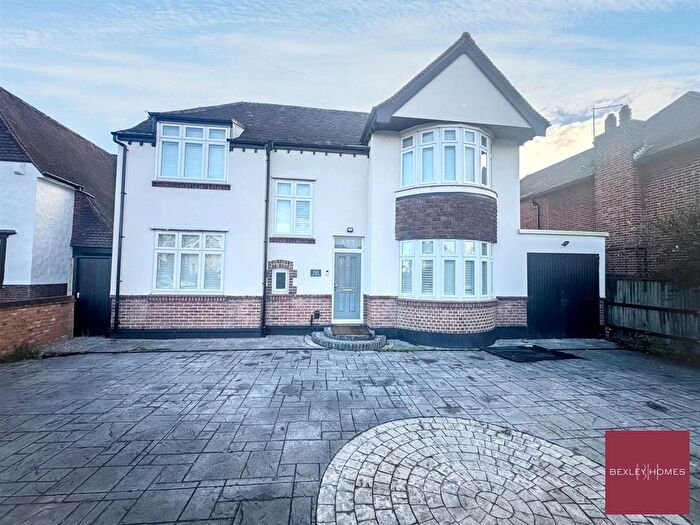
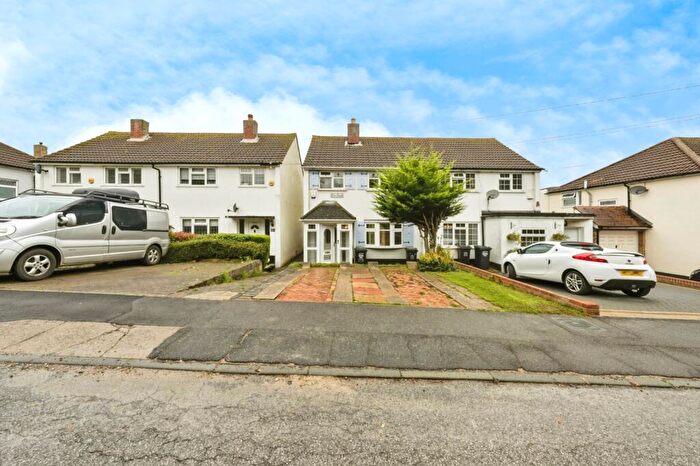
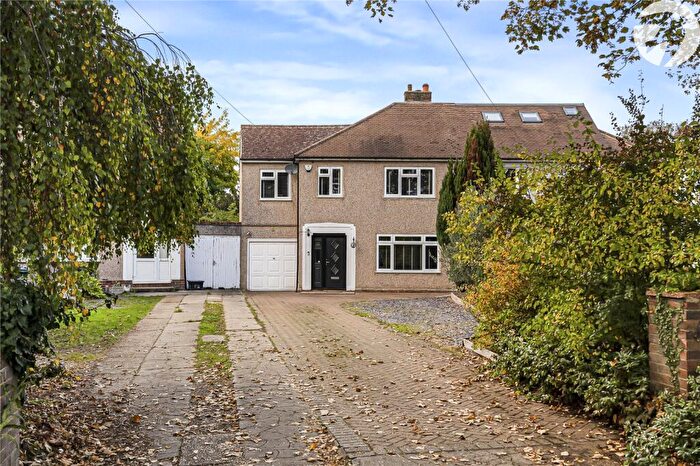
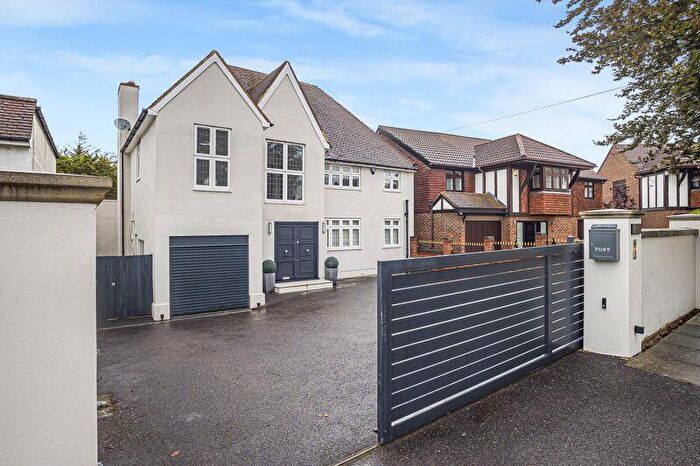
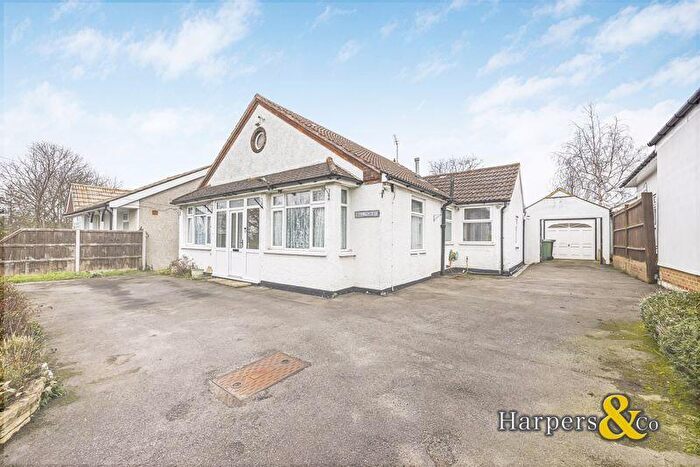
Properties for sale in Wilmington
Roads and Postcodes in Wilmington
Navigate through our locations to find the location of your next house in Wilmington, Dartford for sale or to rent.
| Streets | Postcodes |
|---|---|
| Albert Road | DA2 7DL |
| Appleton Drive | DA2 7EN |
| Barn End Cottages | DA2 7PZ |
| Barn End Drive | DA2 7BX |
| Barn End Lane | DA2 7PP DA2 7QA |
| Brewers Field | DA2 7PJ DA2 7PL |
| Broad Lane | DA2 7AG DA2 7AQ |
| Burr Bank Terrace | DA2 7PY |
| Capel Place | DA2 7PU |
| Chave Road | DA2 7ED |
| Cherry Tree Lane | DA2 7AE |
| Church Field | DA2 7EJ |
| Church Hill | DA2 7DY DA2 7EE DA2 7EH |
| Church Walk | DA2 7EL DA2 7EX |
| Clayton Croft Road | DA2 7AU |
| Common Lane | DA2 7AX DA2 7BD DA2 7DB DA2 7DE DA2 7DF |
| Curates Walk | DA2 7BJ |
| Edwin Road | DA2 7DD DA2 7DJ |
| Farm Cottages | DA2 7DQ |
| Garden Place | DA2 7EP |
| Gerdview Drive | DA2 7BS |
| Gothic Close | DA1 1PR |
| Hawley Road | DA1 1PT |
| High Road | DA2 7BN DA2 7BU DA2 7BW DA2 7DN DA2 7DP DA2 7DW DA2 7EG DA2 7EQ |
| Hook Green Lane | DA2 7AJ DA2 7AL |
| Hulsewood Close | DA2 7AD |
| Hurlfield | DA2 7BH |
| Knoll Cottages | DA2 7AH |
| Langworth Close | DA2 7ET |
| Leyton Cross Road | DA2 7AN DA2 7AP DA2 7AW |
| Manor Close | DA2 7AR |
| Manor Gate | DA2 7BA |
| Manor Gate Lane | DA2 7EW |
| Martin Road | DA2 7DH |
| Mayors Lane | DA2 7ST |
| Meadow Walk | DA2 7BP |
| Mitchell Close | DA1 1PJ |
| Monks Orchard | DA1 2TB |
| Oakfield Lane | DA1 2TE DA2 7AA DA2 7AB |
| Orchard Way | DA2 7ER |
| Parsons Lane | DA2 7BB |
| Red Cottages | DA2 7DG |
| Rowhill Road | DA2 7QG DA2 7QQ |
| Rowlatt Close | DA2 7BT |
| Rowlatt Road | DA2 7PS |
| Sackville Road | DA2 7EB |
| Shirehall Road | DA2 7SL |
| Southview Road | DA2 7BL |
| Stock Lane | DA2 7BY |
| Taylor Row | DA2 7DU DA2 7DX |
| The Close | DA2 7ES |
| Tredegar Road | DA2 7AS DA2 7AY DA2 7AZ |
| Wallis Close | DA2 7BE |
| Warren Road | DA1 1PH DA1 1PL DA1 1PP DA1 1PS |
| Whitehead Close | DA2 7PR |
| Wilmington Court Road | DA2 7AT |
Transport near Wilmington
-
Dartford Station
-
Crayford Station
-
Farningham Road Station
-
Bexley Station
-
Swanley Station
-
Slade Green Station
- FAQ
- Price Paid By Year
- Property Type Price
Frequently asked questions about Wilmington
What is the average price for a property for sale in Wilmington?
The average price for a property for sale in Wilmington is £471,337. This amount is 23% higher than the average price in Dartford. There are 534 property listings for sale in Wilmington.
What streets have the most expensive properties for sale in Wilmington?
The streets with the most expensive properties for sale in Wilmington are Rowhill Road at an average of £1,687,500, Manor Gate Lane at an average of £1,250,000 and Hook Green Lane at an average of £987,500.
What streets have the most affordable properties for sale in Wilmington?
The streets with the most affordable properties for sale in Wilmington are Southview Road at an average of £265,000, Mitchell Close at an average of £276,642 and Common Lane at an average of £336,050.
Which train stations are available in or near Wilmington?
Some of the train stations available in or near Wilmington are Dartford, Crayford and Farningham Road.
Property Price Paid in Wilmington by Year
The average sold property price by year was:
| Year | Average Sold Price | Price Change |
Sold Properties
|
|---|---|---|---|
| 2025 | £491,812 | 10% |
47 Properties |
| 2024 | £442,015 | -8% |
43 Properties |
| 2023 | £479,405 | -17% |
37 Properties |
| 2022 | £559,826 | 19% |
55 Properties |
| 2021 | £451,304 | 1% |
61 Properties |
| 2020 | £446,120 | 14% |
52 Properties |
| 2019 | £382,305 | -9% |
53 Properties |
| 2018 | £415,466 | 6% |
67 Properties |
| 2017 | £390,914 | -5% |
67 Properties |
| 2016 | £409,008 | 16% |
56 Properties |
| 2015 | £344,652 | 9% |
75 Properties |
| 2014 | £313,097 | 7% |
59 Properties |
| 2013 | £290,262 | -21% |
49 Properties |
| 2012 | £350,043 | 25% |
67 Properties |
| 2011 | £261,569 | -21% |
43 Properties |
| 2010 | £317,691 | 12% |
44 Properties |
| 2009 | £280,833 | 7% |
39 Properties |
| 2008 | £259,906 | -24% |
42 Properties |
| 2007 | £321,279 | 16% |
73 Properties |
| 2006 | £269,143 | 3% |
81 Properties |
| 2005 | £261,513 | 6% |
64 Properties |
| 2004 | £246,913 | 14% |
93 Properties |
| 2003 | £213,156 | 3% |
60 Properties |
| 2002 | £206,354 | 9% |
84 Properties |
| 2001 | £188,591 | 18% |
74 Properties |
| 2000 | £154,404 | 17% |
58 Properties |
| 1999 | £128,332 | -10% |
68 Properties |
| 1998 | £140,655 | 14% |
94 Properties |
| 1997 | £120,766 | 25% |
88 Properties |
| 1996 | £90,746 | -29% |
67 Properties |
| 1995 | £116,797 | - |
43 Properties |
Property Price per Property Type in Wilmington
Here you can find historic sold price data in order to help with your property search.
The average Property Paid Price for specific property types in the last three years are:
| Property Type | Average Sold Price | Sold Properties |
|---|---|---|
| Semi Detached House | £450,921.00 | 61 Semi Detached Houses |
| Detached House | £795,090.00 | 22 Detached Houses |
| Terraced House | £359,913.00 | 33 Terraced Houses |
| Flat | £271,318.00 | 11 Flats |

