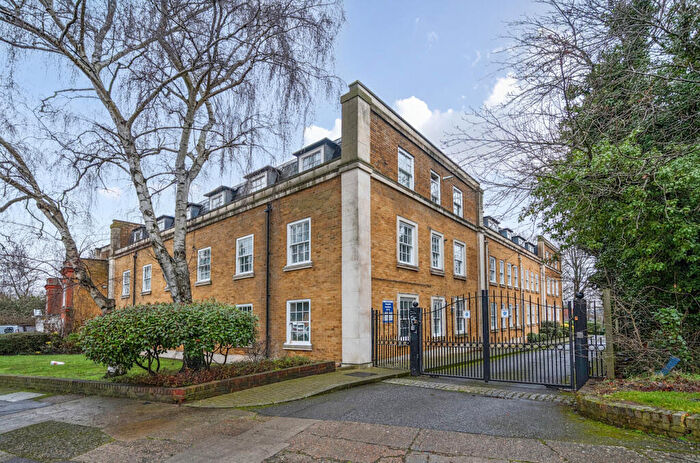
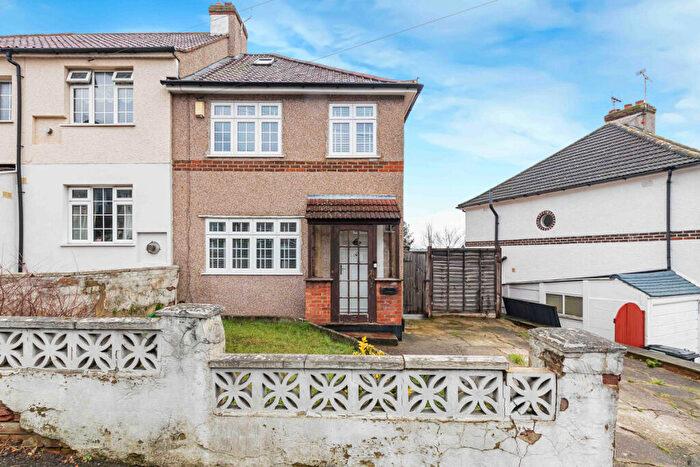
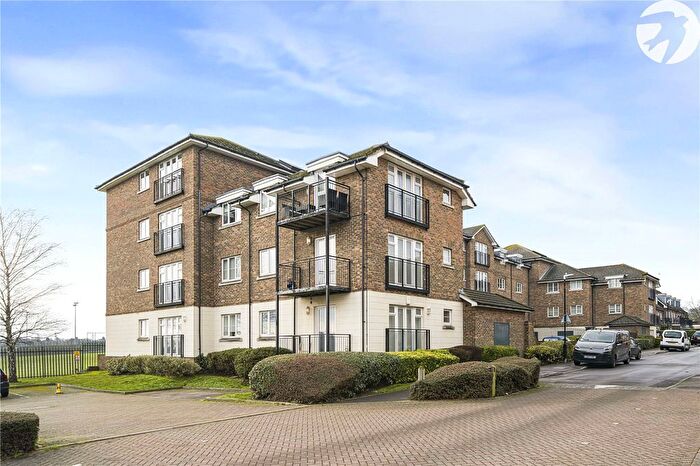
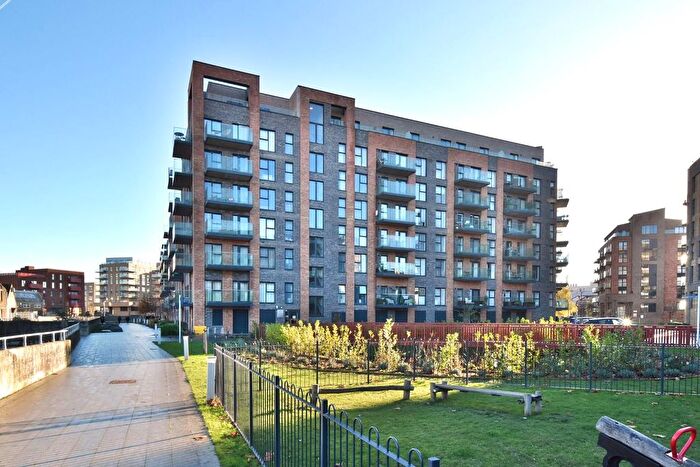
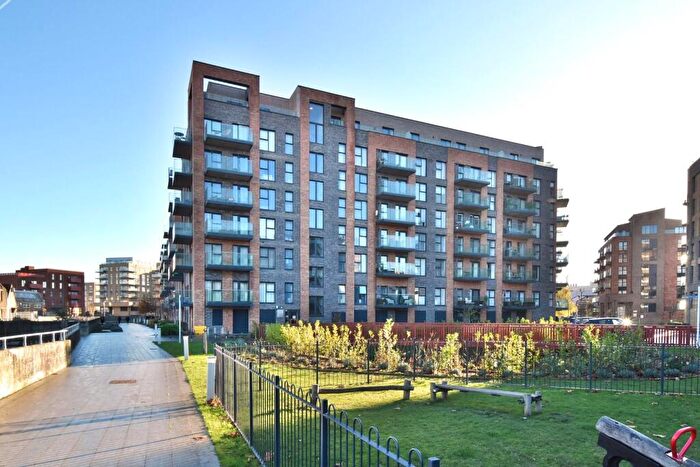
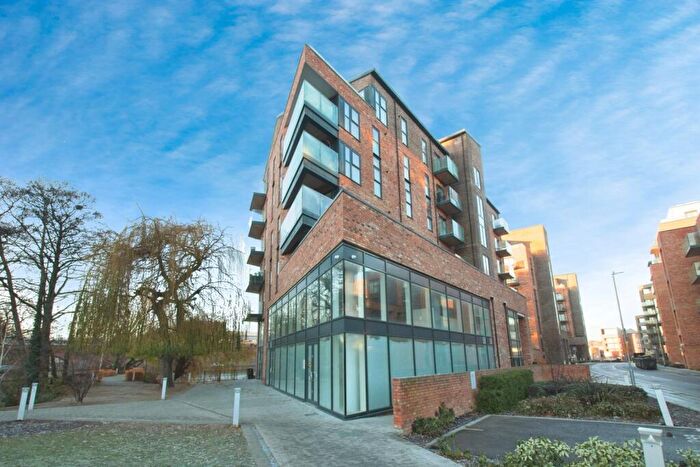
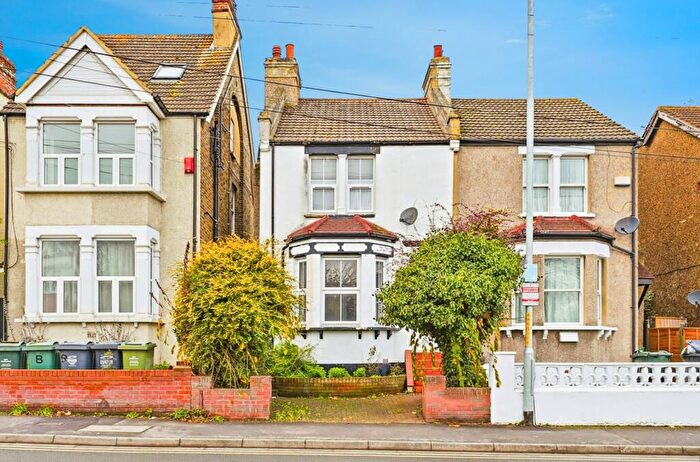
Houses for sale & to rent in Princes, Dartford
House Prices in Princes
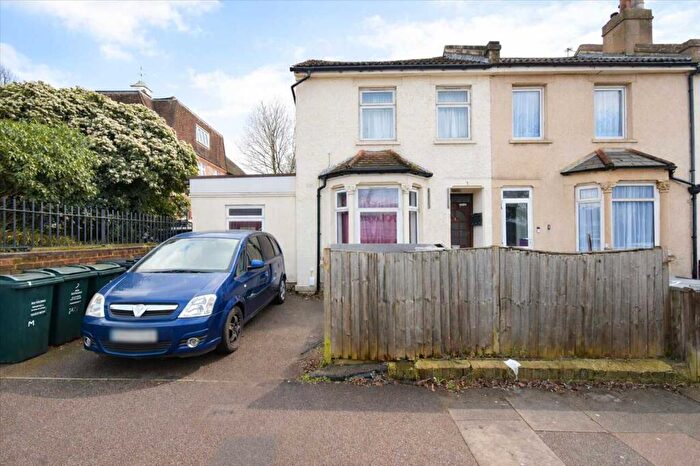
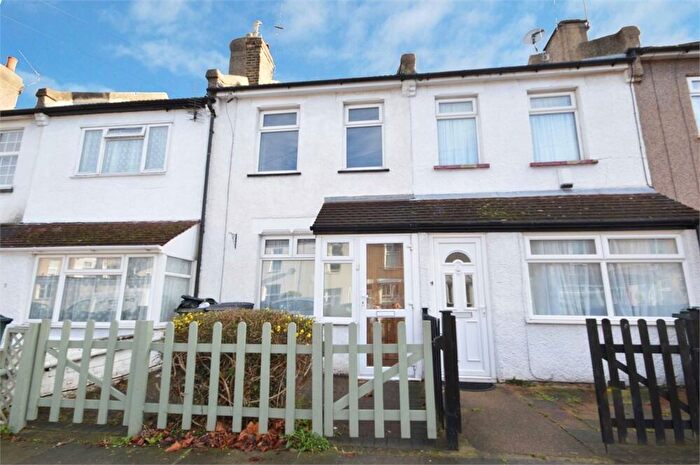
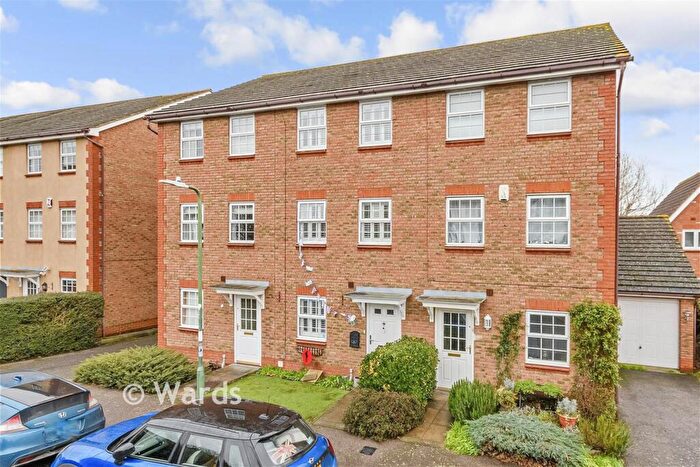
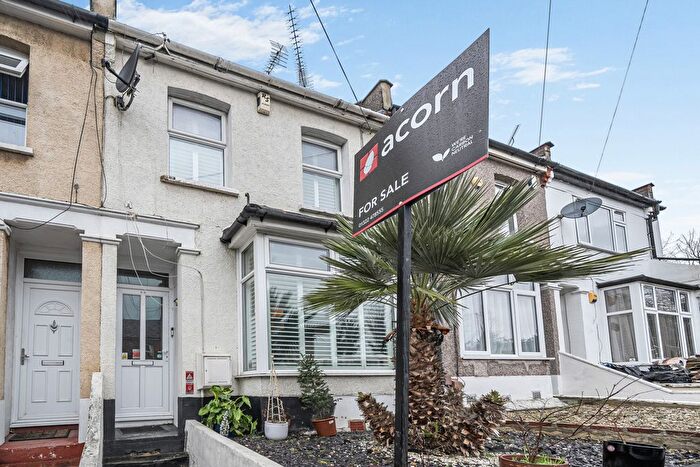
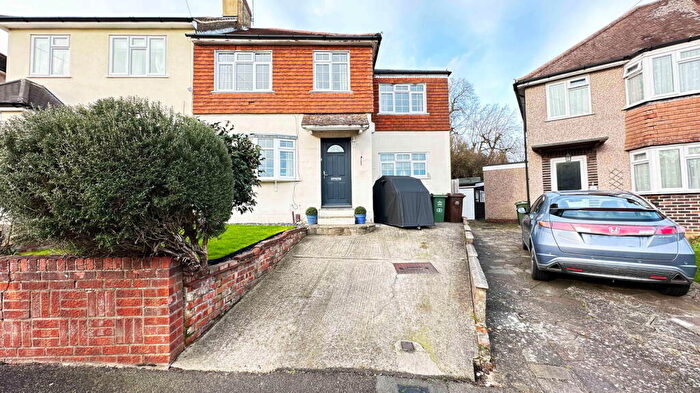
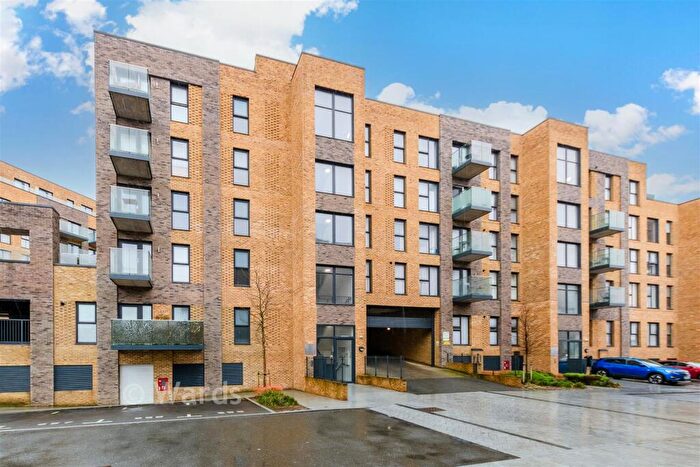
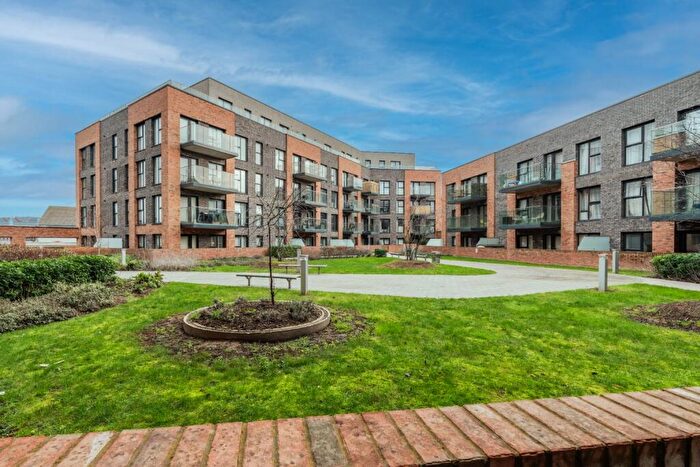
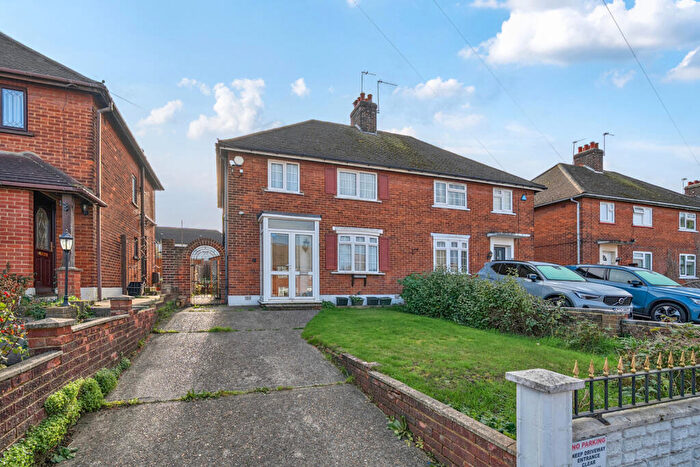
Properties in Princes have an average house price of £368,390.00 and had 146 Property Transactions within the last 3 years¹.
Princes is an area in Dartford, Kent with 2,555 households², where the most expensive property was sold for £1,080,000.00.
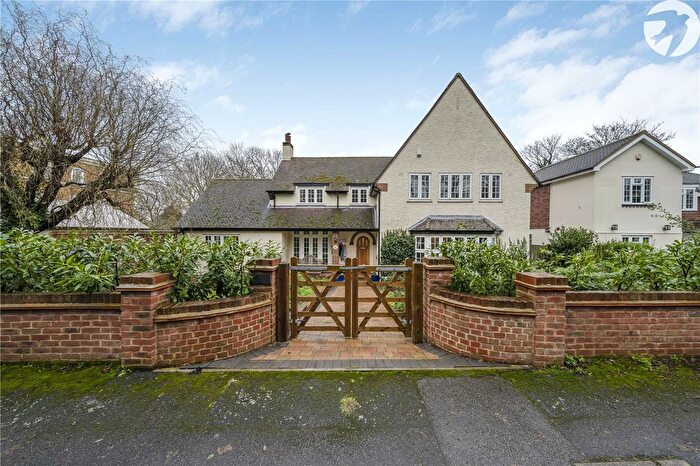
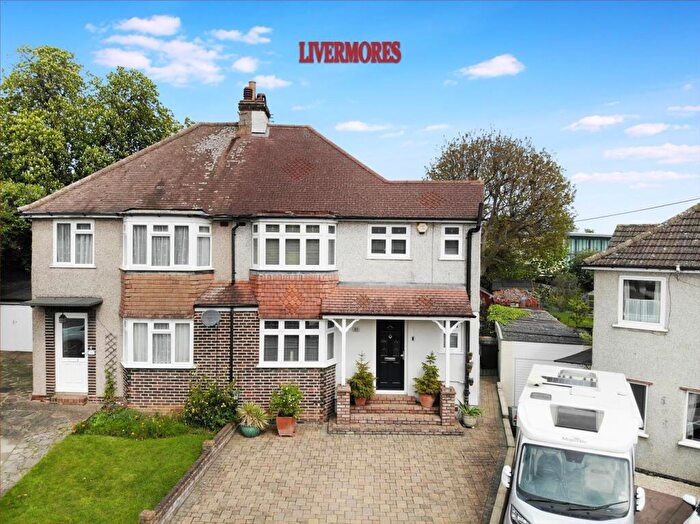
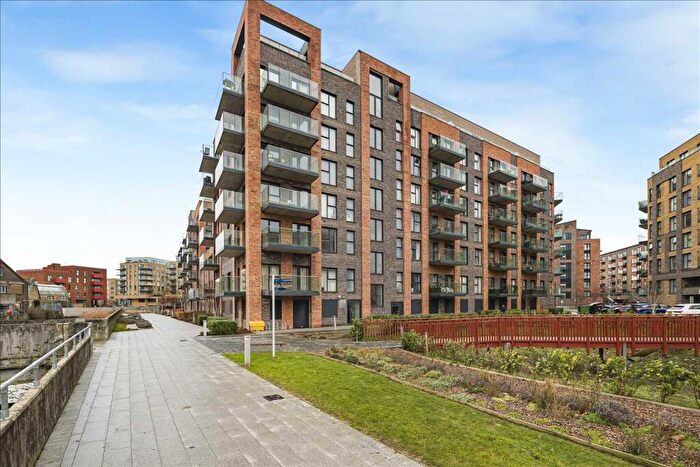
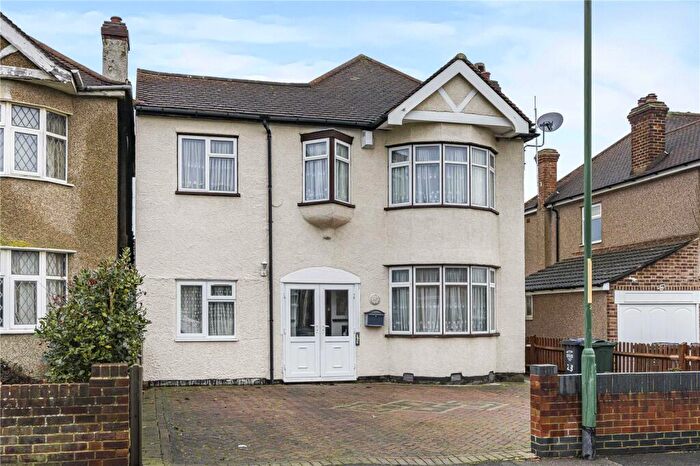
Properties for sale in Princes
Roads and Postcodes in Princes
Navigate through our locations to find the location of your next house in Princes, Dartford for sale or to rent.
| Streets | Postcodes |
|---|---|
| Acacia Road | DA1 2RU |
| Applegarth Drive | DA1 1JD |
| Ash Road | DA1 2RL |
| Avery Way | DA1 1JZ |
| Beech Road | DA1 2RG DA1 2RQ |
| Blackmans Close | DA1 2QJ |
| Butterly Avenue | DA1 1JG |
| Carsington Gardens | DA1 2SS |
| Cedar Road | DA1 2RS DA1 2SF |
| Chestnut Road | DA1 2LA DA1 2LB |
| Cranford Road | DA1 1JP |
| Dartford Heath Retail Park | DA1 2DS DA1 2QA |
| Ellis Way | DA1 1JX |
| Elm Close | DA1 2SA |
| Elm Road | DA1 2RF DA1 2RN DA1 2RT DA1 2RW DA1 2RX DA1 2SD |
| Fawkes Avenue | DA1 1JQ |
| Greenbanks | DA1 1NU |
| Hawley Road | DA1 1NP DA1 1NR DA1 1PA DA1 1PB DA1 1PG DA1 1PU DA1 1AU |
| Hawthorn Road | DA1 2SB |
| Hayward Drive | DA1 1JH DA1 1PE |
| Hazel Road | DA1 2SE |
| Heath Gardens | DA1 2PF |
| Heath Lane | DA1 2QE DA1 2QF DA1 2QH |
| Heath Street | DA1 2LD |
| Highfield Road | DA1 2JU DA1 2LH DA1 2JX |
| Hill Road | DA2 7EA |
| Holly Road | DA1 2QT |
| Ingram Road | DA1 1JL |
| Laburnum Avenue | DA1 2QN DA1 2QW |
| Larch Road | DA1 2LE DA1 2LF |
| Laurel Close | DA1 2QL |
| Linden Avenue | DA1 2RA |
| Lowfield Street | DA1 1JB DA1 1JE DA1 1JF DA1 1JJ DA1 1LB DA1 1LH DA1 1EE |
| Maple Road | DA1 2QY DA1 2QZ |
| Mead Crescent | DA1 2SH |
| Mead Road | DA1 2RH |
| Meadowside | DA1 2RZ DA1 2SJ DA1 2RB DA1 2RY |
| Myrtle Road | DA1 2RJ |
| Norman Road | DA1 1LE DA1 1LF |
| Oakfield Lane | DA1 2SN DA1 2SP DA1 2SU DA1 2SW DA1 2SY DA1 2TF DA1 2JT |
| Oakfield Park Road | DA1 2SR DA1 2ST |
| Oakfield Place | DA1 2SX |
| Olive Road | DA1 2QU |
| Pearson Way | DA1 1JN |
| Phoenix Place | DA1 2XA DA1 2XB DA1 2XD DA1 2XE DA1 2XF DA1 2XG DA1 2XQ |
| Powder Mill Lane | DA1 1NT DA1 1NW DA1 1EF DA1 1JA |
| Princes Road | DA1 1JT DA1 1LA DA1 1LN DA1 2RR |
| Rowan Crescent | DA1 2QX |
| Saunders Way | DA1 1JW |
| Shears Close | DA1 2TL |
| Sycamore Road | DA1 2QS |
| The Spires | DA1 2TA |
| Trafalgar Road | DA1 1NS |
| Villa Court | DA1 1LW |
| Walnut Tree Avenue | DA1 1LJ |
| Warwick Way | DA1 1NQ |
| Wilks Avenue | DA1 1JS |
| Willow Road | DA1 2QG DA1 2QP DA1 2QQ DA1 2QR |
| DA1 1LG |
Transport near Princes
-
Dartford Station
-
Crayford Station
-
Slade Green Station
-
Stone Crossing Station
-
Farningham Road Station
-
Bexley Station
- FAQ
- Price Paid By Year
- Property Type Price
Frequently asked questions about Princes
What is the average price for a property for sale in Princes?
The average price for a property for sale in Princes is £368,390. This amount is 4% lower than the average price in Dartford. There are 1,507 property listings for sale in Princes.
What streets have the most expensive properties for sale in Princes?
The streets with the most expensive properties for sale in Princes are Shears Close at an average of £1,080,000, Carsington Gardens at an average of £511,250 and Heath Lane at an average of £465,000.
What streets have the most affordable properties for sale in Princes?
The streets with the most affordable properties for sale in Princes are The Spires at an average of £230,000, Blackmans Close at an average of £254,050 and Oakfield Lane at an average of £278,750.
Which train stations are available in or near Princes?
Some of the train stations available in or near Princes are Dartford, Crayford and Slade Green.
Property Price Paid in Princes by Year
The average sold property price by year was:
| Year | Average Sold Price | Price Change |
Sold Properties
|
|---|---|---|---|
| 2025 | £369,318 | -2% |
53 Properties |
| 2024 | £377,955 | 8% |
60 Properties |
| 2023 | £349,507 | -1% |
33 Properties |
| 2022 | £354,184 | 10% |
84 Properties |
| 2021 | £317,950 | 1% |
97 Properties |
| 2020 | £313,752 | 5% |
74 Properties |
| 2019 | £297,453 | -3% |
69 Properties |
| 2018 | £307,239 | 3% |
91 Properties |
| 2017 | £296,742 | 8% |
82 Properties |
| 2016 | £273,932 | 15% |
77 Properties |
| 2015 | £233,778 | 11% |
71 Properties |
| 2014 | £208,360 | 3% |
77 Properties |
| 2013 | £201,881 | 3% |
59 Properties |
| 2012 | £194,955 | 12% |
56 Properties |
| 2011 | £171,838 | -13% |
50 Properties |
| 2010 | £195,008 | 19% |
56 Properties |
| 2009 | £158,872 | -21% |
47 Properties |
| 2008 | £192,841 | 5% |
49 Properties |
| 2007 | £183,126 | 9% |
110 Properties |
| 2006 | £166,056 | 5% |
111 Properties |
| 2005 | £158,271 | 2% |
90 Properties |
| 2004 | £155,325 | 5% |
105 Properties |
| 2003 | £147,250 | 22% |
100 Properties |
| 2002 | £115,160 | 3% |
137 Properties |
| 2001 | £111,486 | 22% |
100 Properties |
| 2000 | £86,880 | 18% |
85 Properties |
| 1999 | £71,435 | 12% |
71 Properties |
| 1998 | £62,863 | 9% |
101 Properties |
| 1997 | £57,268 | 3% |
96 Properties |
| 1996 | £55,589 | -1% |
73 Properties |
| 1995 | £55,890 | - |
55 Properties |
Property Price per Property Type in Princes
Here you can find historic sold price data in order to help with your property search.
The average Property Paid Price for specific property types in the last three years are:
| Property Type | Average Sold Price | Sold Properties |
|---|---|---|
| Semi Detached House | £403,257.00 | 34 Semi Detached Houses |
| Detached House | £675,416.00 | 6 Detached Houses |
| Terraced House | £354,444.00 | 95 Terraced Houses |
| Flat | £213,590.00 | 11 Flats |

