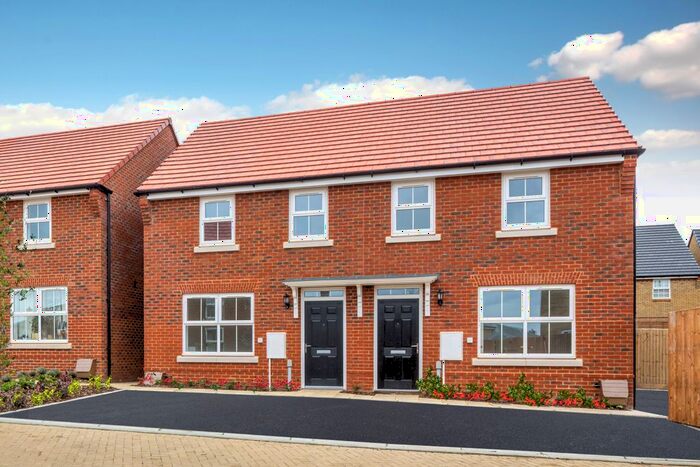
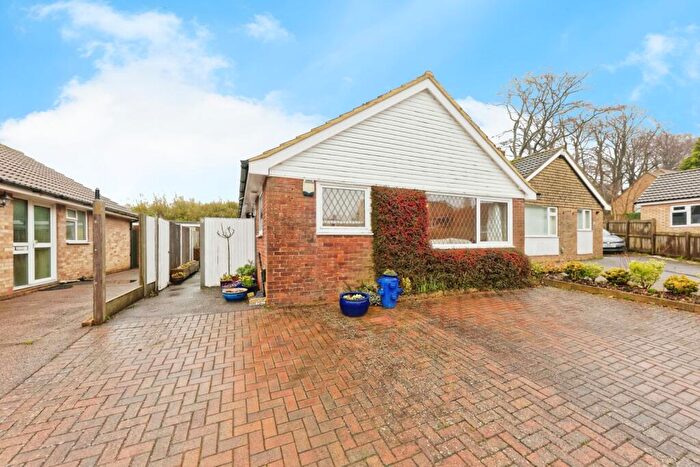
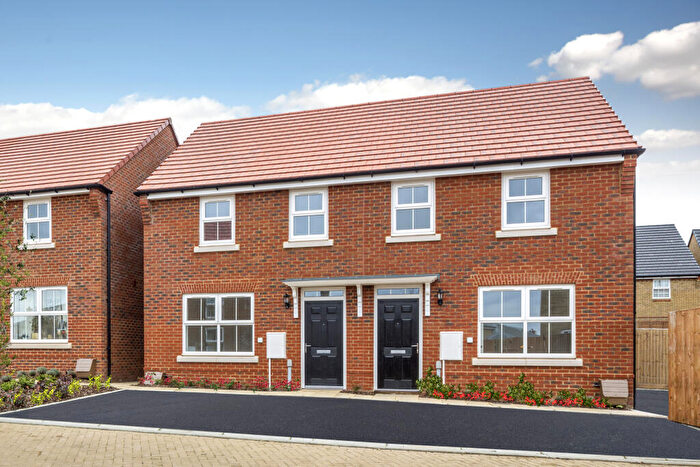
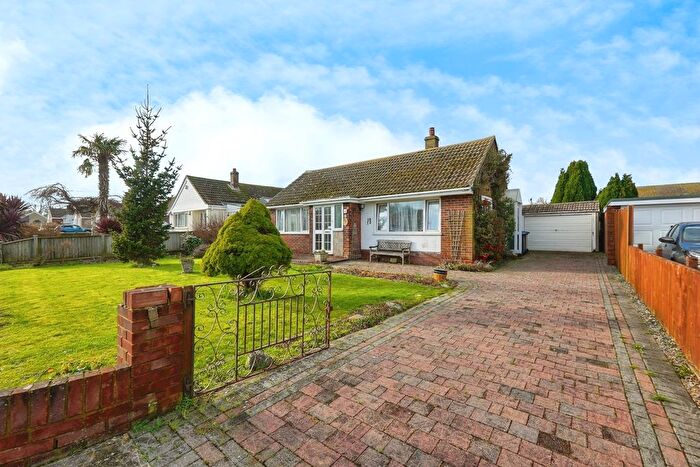
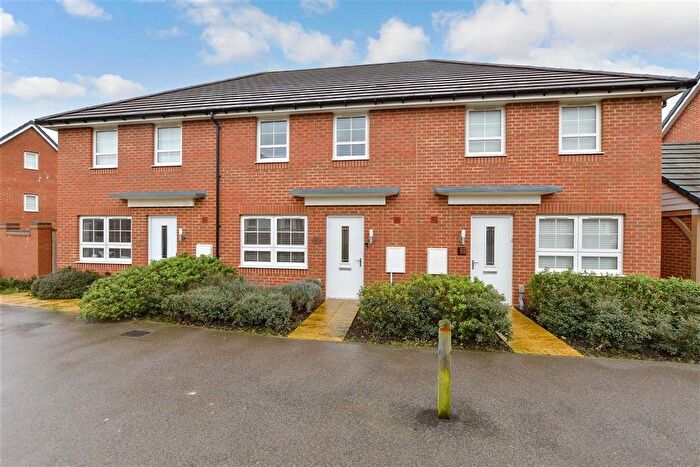
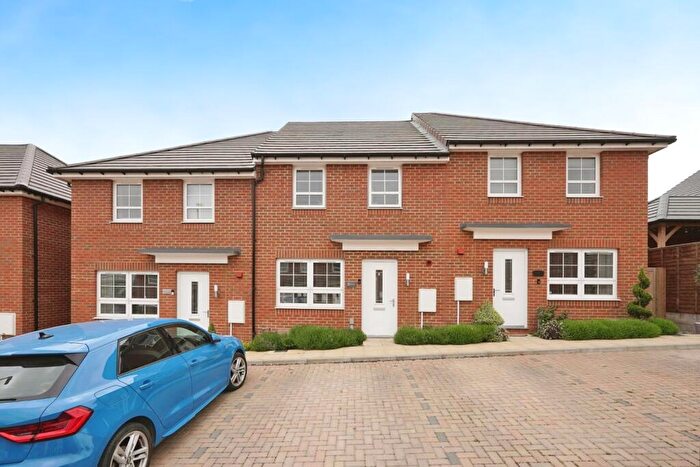
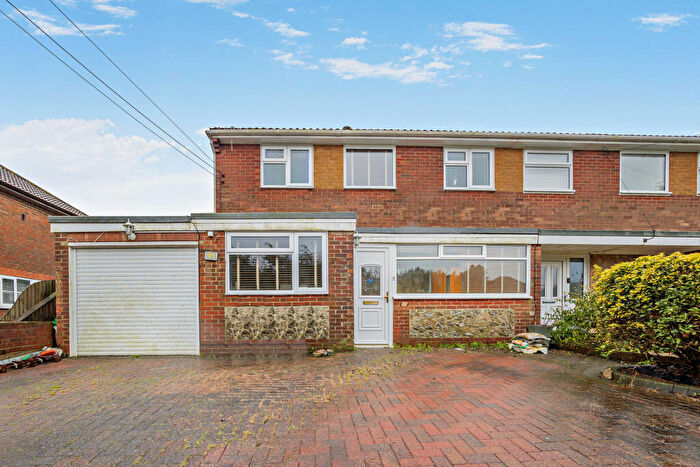
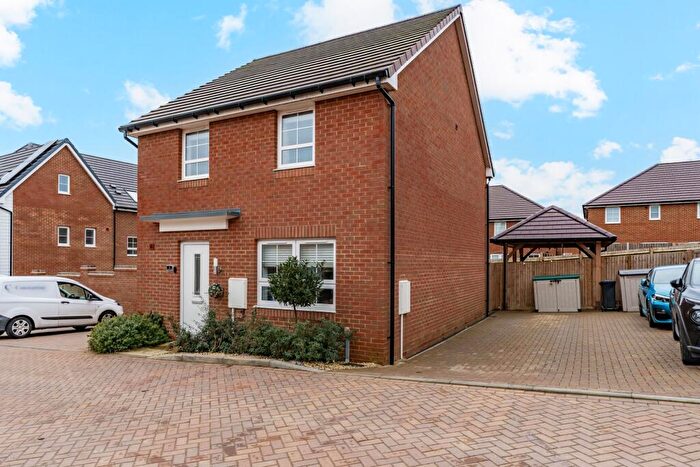
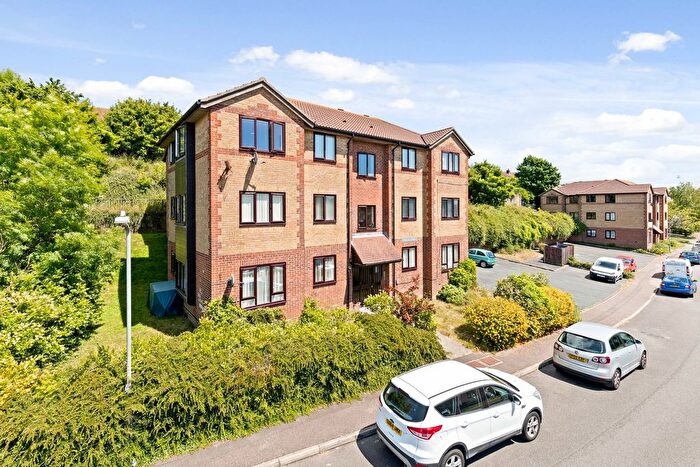
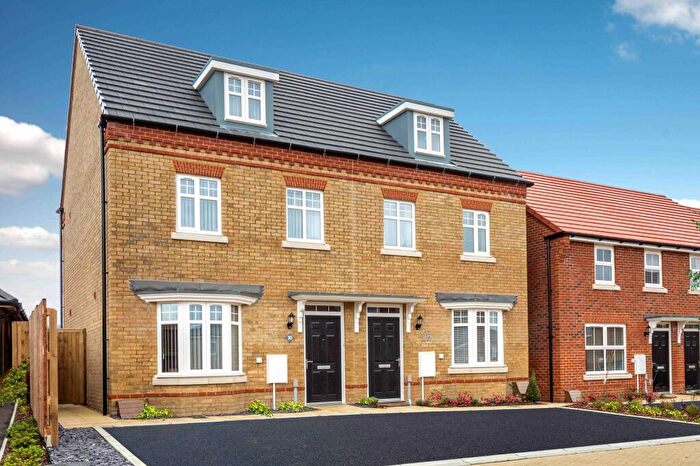
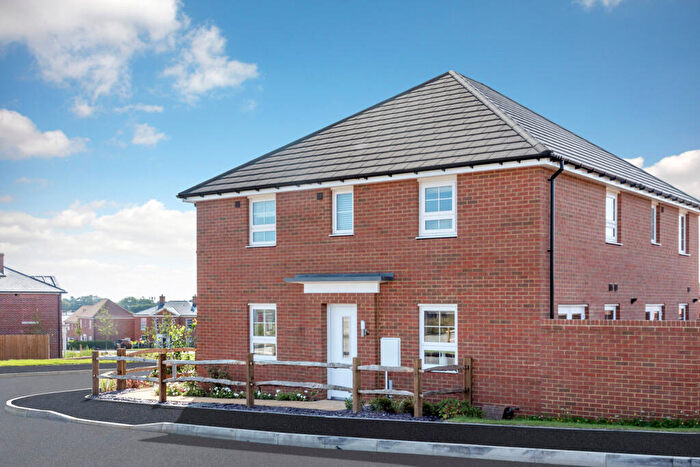
Houses for sale & to rent in Whitfield, Dover
House Prices in Whitfield
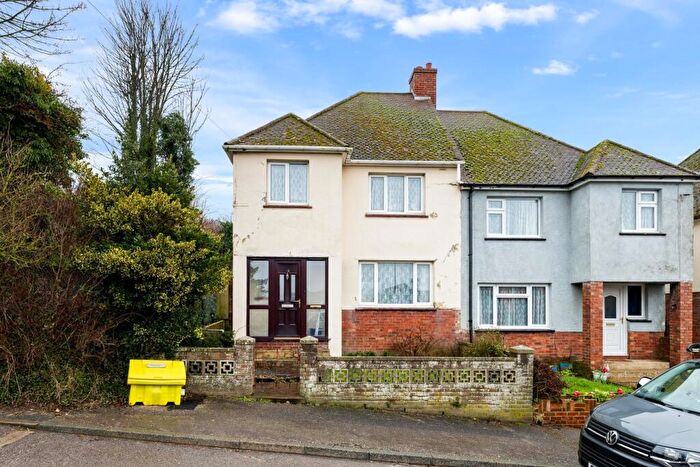
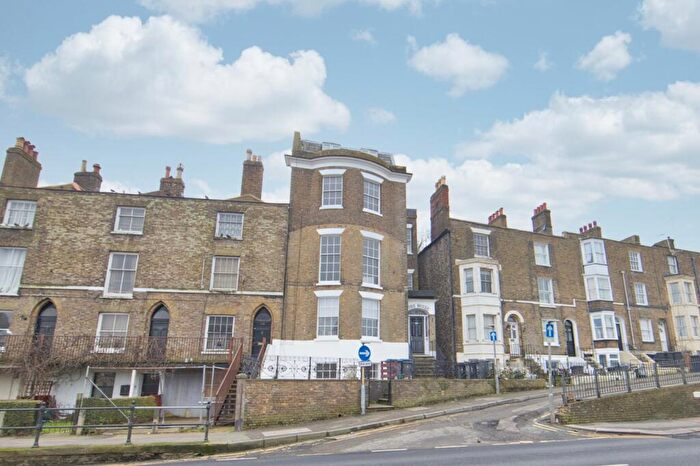
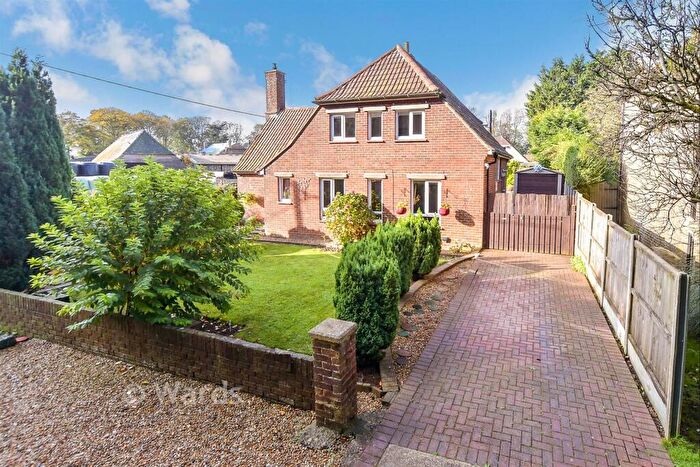
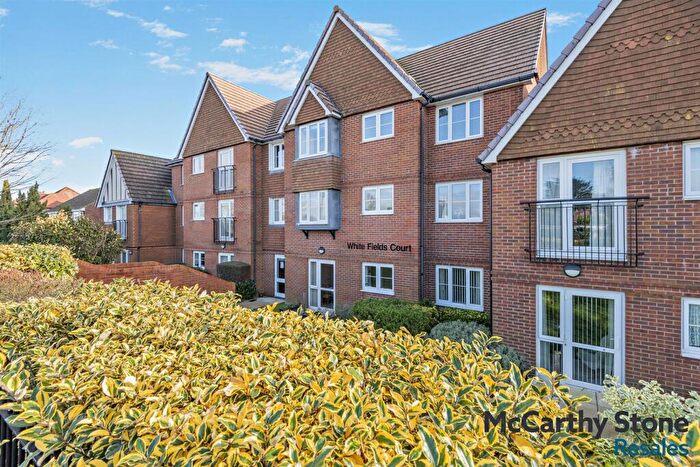
Properties in Whitfield have an average house price of £327,368.00 and had 286 Property Transactions within the last 3 years¹.
Whitfield is an area in Dover, Kent with 2,096 households², where the most expensive property was sold for £760,000.00.
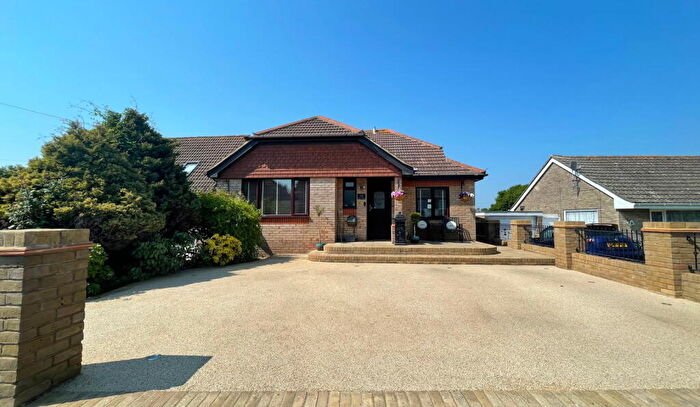
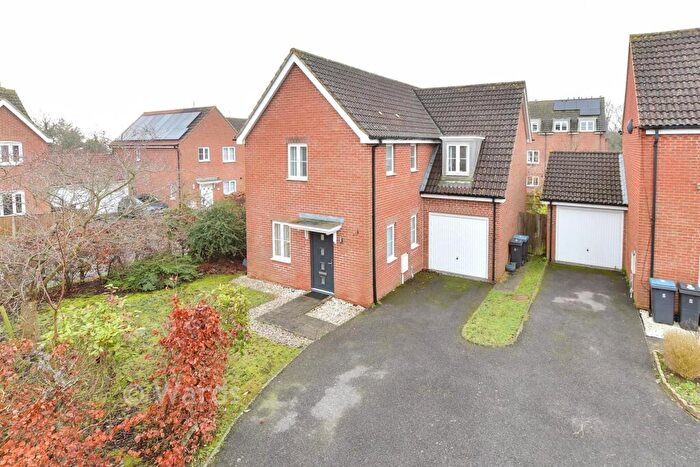
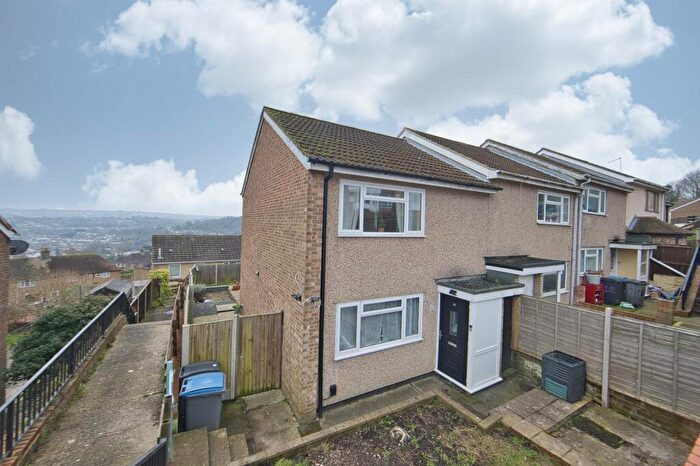
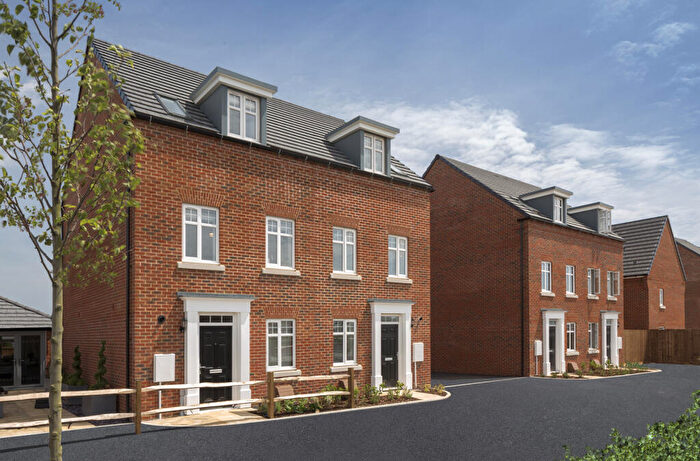
Properties for sale in Whitfield
Roads and Postcodes in Whitfield
Navigate through our locations to find the location of your next house in Whitfield, Dover for sale or to rent.
| Streets | Postcodes |
|---|---|
| Alison Close | CT16 3LW |
| Alison Crescent | CT16 3LN CT16 3LP |
| Antelope Close | CT16 2GN |
| Arable Drive | CT16 3FE |
| Archers Court Road | CT16 3HP CT16 3HS CT16 3HT CT16 3HU CT16 3HX |
| Ardent Road | CT16 2GH CT16 2GP |
| Aspen Drive | CT16 2EX |
| Barn Owl Way | CT16 3FW |
| Beauxfield | CT16 3JH CT16 3JQ CT16 3JW |
| Beechwood Close | CT16 3JZ |
| Bewsbury Crescent | CT16 3ET CT16 3EU |
| Bewsbury Cross Lane | CT16 3EY CT16 3EZ CT16 3HB |
| Bindon Blood Road | CT16 2HA CT16 2HB CT16 2HE |
| Bramley Gardens | CT16 3PL |
| Bridleway | CT16 3NH |
| Bunting Walk | CT16 3QD |
| Burgess Close | CT16 3NP |
| Buzzard Drive | CT16 3GX |
| Castle Drive | CT16 3EN |
| Chapel Road | CT16 3GT |
| Chestnut Close | CT16 3HE |
| Church Whitfield Road | CT16 3HY CT16 3HZ |
| Courtland Avenue | CT16 3HR |
| Cranleigh Drive | CT16 3NL CT16 3NN CT16 3NW CT16 3FG |
| Downside Road | CT16 3NS |
| Dubris Close | CT16 3FJ |
| Eagle Drive | CT16 3FU |
| Elysium Park Close | CT16 2FJ |
| Farncombe Way | CT16 3NT |
| Field View Road | CT16 3FB |
| Fitness Fields | CT16 3FZ |
| Forge Lane | CT16 3LA CT16 3LB CT16 3LE |
| Forge Path | CT16 3JS |
| France Road | CT16 2HD |
| Galahad Way | CT16 2GJ |
| Gannet Grove | CT16 3GY |
| Goldcrest Row | CT16 3QE |
| Gordon Road | CT16 2ES CT16 2ET CT16 3PN |
| Goshawk Lane | CT16 3FR |
| Grace Meadow | CT16 3HA |
| Green Close | CT16 2FD |
| Green Lane | CT16 3ER |
| Guilford Avenue | CT16 3HF CT16 3NG |
| Harvest Road | CT16 3FA |
| Hedge Row | CT16 3QU |
| Henniker Close | CT16 2QZ |
| Hobby Drive | CT16 3FX |
| Honeywood Close | CT16 3NY CT16 3PJ CT16 3PX CT16 9SA CT16 9SB CT16 9SD CT16 9SE CT16 9SF CT16 9SG CT16 9SH CT16 9SJ CT16 9SL CT16 9SN CT16 9SP CT16 9SQ CT16 9SR CT16 9SS CT16 9ST CT16 9SU CT16 9SW CT16 9SX CT16 9SY CT16 9SZ CT16 9TA CT16 9TB |
| Honeywood Parkway | CT16 3FF CT16 3FH CT16 3PS CT16 3PT CT16 3QX |
| Honeywood Road | CT16 3EH |
| Joyes Close | CT16 3LS |
| Joyes Road | CT16 3LR |
| Kedleston Road | CT16 3NX |
| Kestrel Grove | CT16 3FT |
| Keyes Close | CT16 2GZ |
| Khartoum Square | CT16 2EU |
| Kinson Way | CT16 2FB |
| Lenacre Avenue | CT16 3HH |
| Lenacre Lane | CT16 3HL CT16 3HQ |
| Loxwood Close | CT16 3NU |
| Lynwood Green | CT16 3PZ |
| Maize Lane | CT16 3GQ |
| Manley Close | CT16 3NA |
| Manor Gardens | CT16 3JN |
| Mansion Gardens | CT16 2HH |
| Mayfield Road | CT16 3LH CT16 3LJ CT16 3LL |
| Melbourne Avenue | CT16 2EF CT16 2EG |
| Menzies Road | CT16 2FG CT16 3NJ |
| Merlin Avenue | CT16 3FS |
| Mill Lane | CT16 3JE CT16 3JR |
| Napchester Road | CT16 3JA CT16 3JD |
| Newlands | CT16 3NB CT16 3ND CT16 3NE |
| Nursery Lane | CT16 3ES CT16 3EX CT16 3HD CT16 3HG |
| Oats Drive | CT16 3GS |
| Old Farm Road | CT16 3QT |
| Old Park | CT16 2HQ |
| Old Park Close | CT16 2HL |
| Old Park Hill | CT16 2GR |
| Orchard Close | CT16 3LD |
| Osprey Gardens | CT16 3FP |
| Palmerston Road | CT16 3NF |
| Peregrine Place | CT16 3JJ |
| Pineham Bottom Cottages | CT15 5HB |
| Red Kite Road | CT16 3FY |
| Redwing Grove | CT16 3QF |
| Richmond Way | CT16 3FL CT16 3FN CT16 3PW |
| Rye Lane | CT16 3GP |
| Sandwich Road | CT16 3JF CT16 3JP CT16 3JX CT16 3LF CT16 3LG CT16 3LT CT16 3LU CT16 3LX CT16 3LY CT16 3JG CT16 3JT CT16 3JU CT16 3JY |
| Singledge Avenue | CT16 3LQ |
| Singledge Lane | CT15 5AB CT16 3EJ CT16 3EL CT16 3EP CT15 5AA CT15 5AD CT15 5AE CT16 3EW |
| Skylark Lane | CT16 3QR |
| Sparrowhawk Way | CT16 3GZ |
| Stonechat Lane | CT16 3QB |
| The Acre | CT16 3HJ |
| The Drove | CT16 3JB |
| Tristram Way | CT16 2GL |
| Westfield Drive | CT16 3JL |
| Wheatsheaf Square | CT16 3GU CT16 3GW |
| Whinchat Rise | CT16 3QL |
| Whyte Close | CT16 2EZ |
| Willingdon Road | CT16 2JX |
| Witley Walk | CT16 3NR |
| CT15 5EZ CT15 5HA CT16 3GR |
Transport near Whitfield
- FAQ
- Price Paid By Year
- Property Type Price
Frequently asked questions about Whitfield
What is the average price for a property for sale in Whitfield?
The average price for a property for sale in Whitfield is £327,368. This amount is 18% higher than the average price in Dover. There are 3,014 property listings for sale in Whitfield.
What streets have the most expensive properties for sale in Whitfield?
The streets with the most expensive properties for sale in Whitfield are Pineham Bottom Cottages at an average of £715,000, Eagle Drive at an average of £512,500 and Lenacre Lane at an average of £492,500.
What streets have the most affordable properties for sale in Whitfield?
The streets with the most affordable properties for sale in Whitfield are Antelope Close at an average of £185,250, Manor Gardens at an average of £202,000 and Whyte Close at an average of £204,166.
Which train stations are available in or near Whitfield?
Some of the train stations available in or near Whitfield are Kearsney, Dover Priory and Martin Mill.
Property Price Paid in Whitfield by Year
The average sold property price by year was:
| Year | Average Sold Price | Price Change |
Sold Properties
|
|---|---|---|---|
| 2025 | £330,700 | -0,1% |
91 Properties |
| 2024 | £330,903 | 4% |
121 Properties |
| 2023 | £317,490 | -8% |
74 Properties |
| 2022 | £342,225 | 4% |
112 Properties |
| 2021 | £327,258 | 6% |
114 Properties |
| 2020 | £308,279 | 7% |
124 Properties |
| 2019 | £286,304 | 3% |
119 Properties |
| 2018 | £277,629 | 4% |
97 Properties |
| 2017 | £265,655 | 5% |
163 Properties |
| 2016 | £251,969 | 5% |
151 Properties |
| 2015 | £238,876 | 17% |
142 Properties |
| 2014 | £199,400 | 6% |
130 Properties |
| 2013 | £187,064 | -14% |
81 Properties |
| 2012 | £212,482 | 20% |
61 Properties |
| 2011 | £168,985 | 1% |
84 Properties |
| 2010 | £168,139 | 3% |
89 Properties |
| 2009 | £163,040 | -26% |
100 Properties |
| 2008 | £204,970 | 2% |
73 Properties |
| 2007 | £200,367 | 5% |
132 Properties |
| 2006 | £189,602 | -6% |
155 Properties |
| 2005 | £201,144 | 11% |
61 Properties |
| 2004 | £178,641 | 11% |
76 Properties |
| 2003 | £158,655 | 14% |
76 Properties |
| 2002 | £135,836 | 22% |
69 Properties |
| 2001 | £105,845 | 11% |
77 Properties |
| 2000 | £94,404 | 16% |
60 Properties |
| 1999 | £79,705 | 5% |
68 Properties |
| 1998 | £75,794 | 4% |
61 Properties |
| 1997 | £72,919 | 11% |
69 Properties |
| 1996 | £64,808 | 1% |
79 Properties |
| 1995 | £63,975 | - |
58 Properties |
Property Price per Property Type in Whitfield
Here you can find historic sold price data in order to help with your property search.
The average Property Paid Price for specific property types in the last three years are:
| Property Type | Average Sold Price | Sold Properties |
|---|---|---|
| Flat | £171,678.00 | 21 Flats |
| Semi Detached House | £310,380.00 | 110 Semi Detached Houses |
| Detached House | £411,842.00 | 95 Detached Houses |
| Terraced House | £279,254.00 | 60 Terraced Houses |

