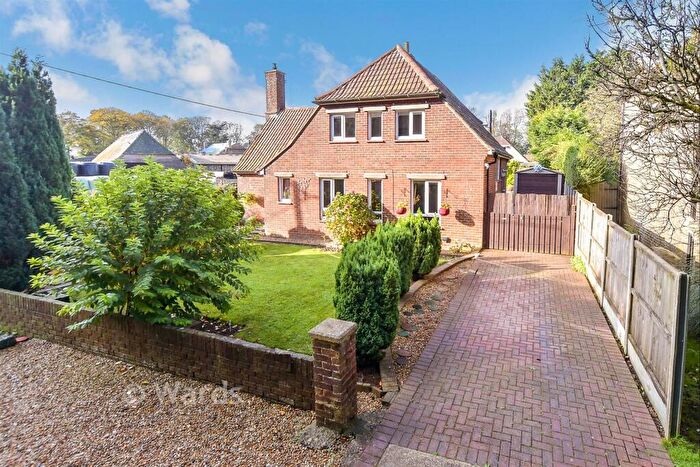
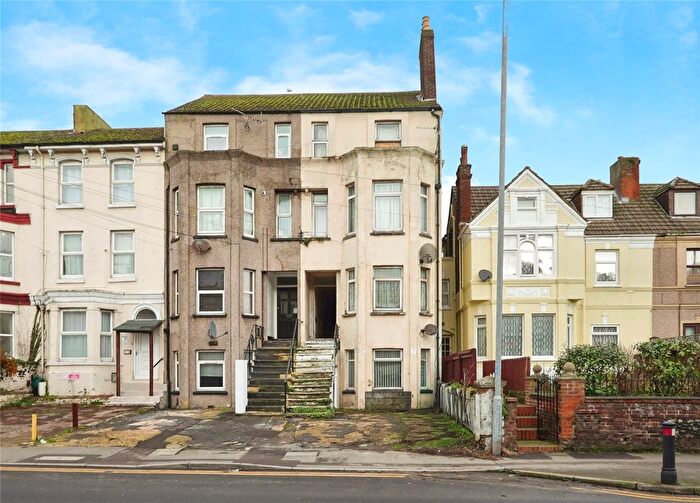
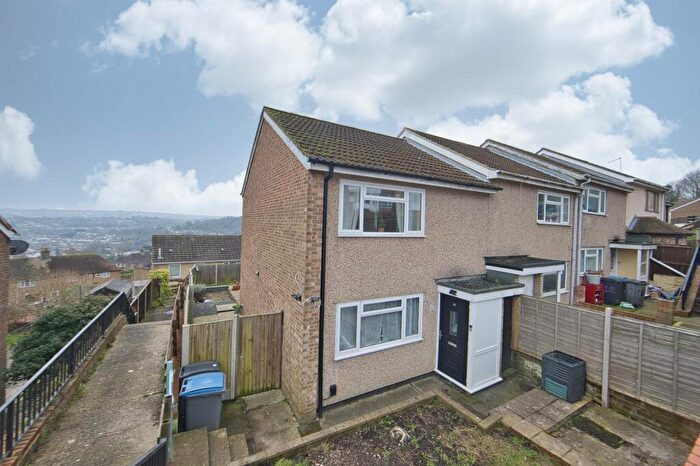
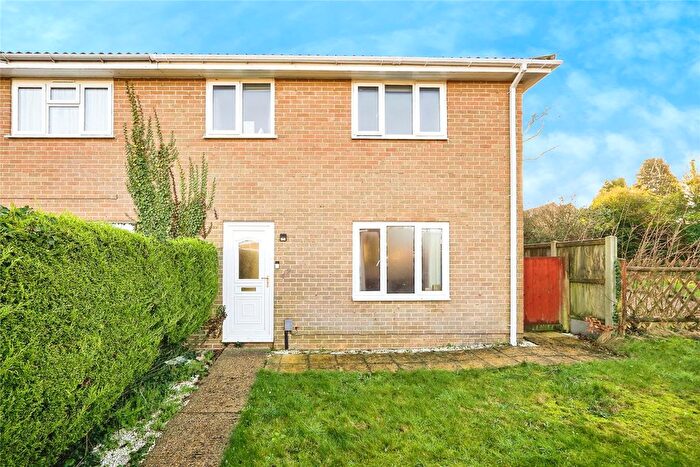
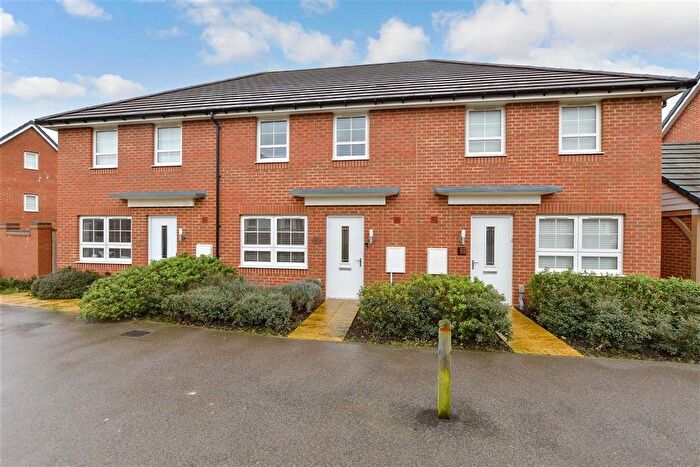
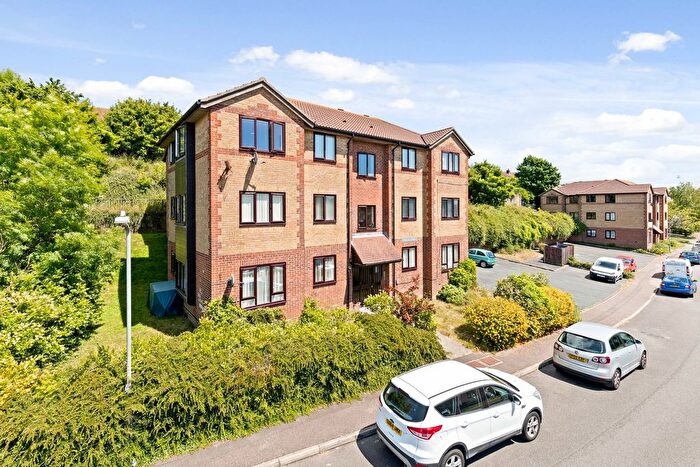
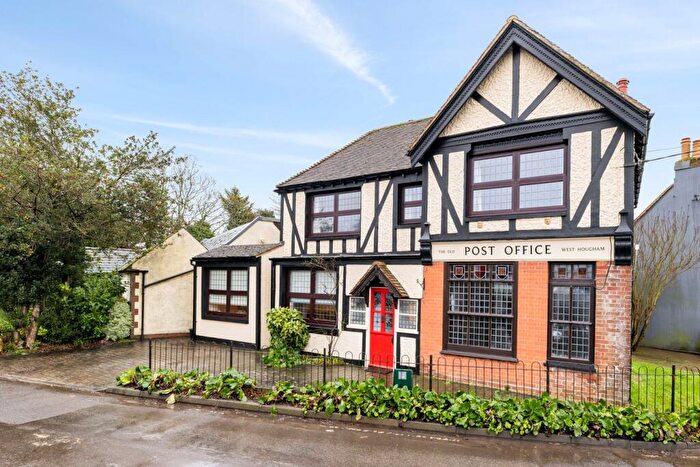
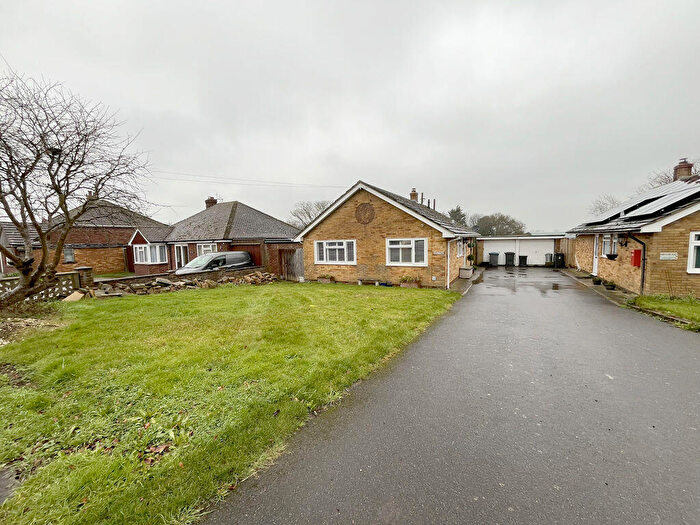
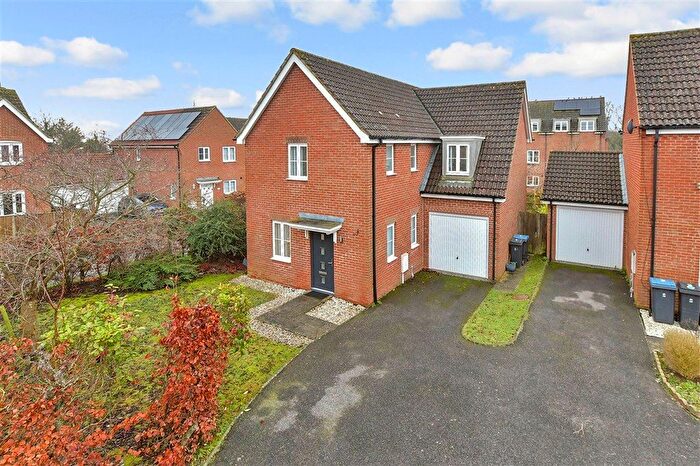
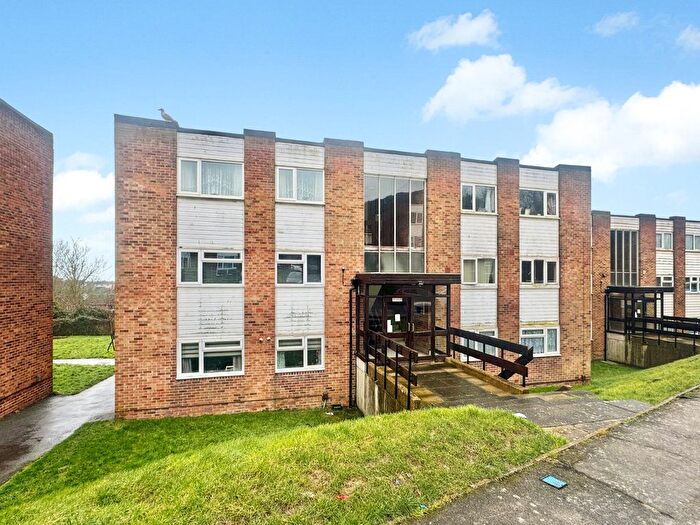
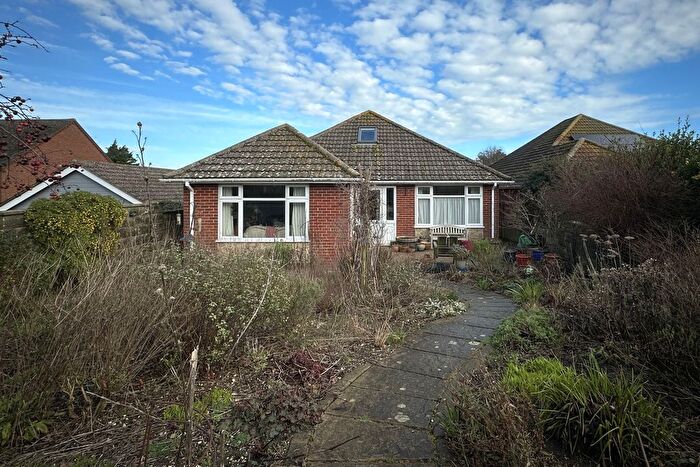
Houses for sale & to rent in Dover, Kent
House Prices in Dover
Properties in Dover have an average house price of £277,214.00 and had 2,069 Property Transactions within the last 3 years.¹
Dover is an area in Kent with 23,291 households², where the most expensive property was sold for £1,825,000.00.
Properties for sale in Dover
Neighbourhoods in Dover
Navigate through our locations to find the location of your next house in Dover, Kent for sale or to rent.
- Aylesham
- Buckland
- Capel-le-ferne
- Castle
- Eastry
- Eythorne And Shepherdswell
- Lydden And Temple Ewell
- Maxton, Elms Vale And Priory
- North Downs East
- River
- St Margarets-at-cliffe
- St Radigunds
- Tower Hamlets
- Town And Pier
- Whitfield
- Aylesham, Eythorne & Shepherdswell
- Eastry Rural
- Guston, Kingsdown & St Margaret's-at-Cliffe
- Maxton & Elms Vale
- Alkham & Capel-le-Ferne
- Dover Downs & River
- Town & Castle
Transport in Dover
Please see below transportation links in this area:
- FAQ
- Price Paid By Year
- Property Type Price
Frequently asked questions about Dover
What is the average price for a property for sale in Dover?
The average price for a property for sale in Dover is £277,214. This amount is 29% lower than the average price in Kent. There are more than 10,000 property listings for sale in Dover.
What locations have the most expensive properties for sale in Dover?
The locations with the most expensive properties for sale in Dover are Eastry Rural at an average of £753,750, Guston, Kingsdown & St Margaret's-at-Cliffe at an average of £750,625 and Dover Downs & River at an average of £655,100.
What locations have the most affordable properties for sale in Dover?
The locations with the most affordable properties for sale in Dover are St Radigunds at an average of £182,992, Tower Hamlets at an average of £187,584 and Town & Castle at an average of £196,714.
Which train stations are available in or near Dover?
Some of the train stations available in or near Dover are Kearsney, Dover Priory and Martin Mill.
Property Price Paid in Dover by Year
The average sold property price by year was:
| Year | Average Sold Price | Price Change |
Sold Properties
|
|---|---|---|---|
| 2025 | £279,525 | 2% |
627 Properties |
| 2024 | £274,679 | -1% |
794 Properties |
| 2023 | £278,084 | -5% |
648 Properties |
| 2022 | £292,823 | 9% |
897 Properties |
| 2021 | £266,772 | 5% |
1,165 Properties |
| 2020 | £253,057 | 7% |
775 Properties |
| 2019 | £235,078 | 3% |
894 Properties |
| 2018 | £228,292 | 3% |
921 Properties |
| 2017 | £220,601 | 7% |
1,054 Properties |
| 2016 | £205,377 | 6% |
1,132 Properties |
| 2015 | £193,481 | 6% |
1,083 Properties |
| 2014 | £181,487 | 9% |
972 Properties |
| 2013 | £164,637 | -2% |
721 Properties |
| 2012 | £167,612 | 4% |
689 Properties |
| 2011 | £161,114 | -7% |
627 Properties |
| 2010 | £172,640 | 10% |
586 Properties |
| 2009 | £154,515 | -11% |
563 Properties |
| 2008 | £172,173 | -1% |
580 Properties |
| 2007 | £174,374 | 11% |
1,208 Properties |
| 2006 | £154,780 | 2% |
1,419 Properties |
| 2005 | £151,728 | 5% |
988 Properties |
| 2004 | £143,956 | 16% |
1,078 Properties |
| 2003 | £120,703 | 17% |
1,207 Properties |
| 2002 | £100,725 | 15% |
1,275 Properties |
| 2001 | £85,566 | 12% |
1,015 Properties |
| 2000 | £75,143 | 6% |
940 Properties |
| 1999 | £70,480 | 6% |
1,026 Properties |
| 1998 | £66,576 | 9% |
774 Properties |
| 1997 | £60,904 | 12% |
927 Properties |
| 1996 | £53,550 | -1% |
810 Properties |
| 1995 | £54,281 | - |
717 Properties |
Property Price per Property Type in Dover
Here you can find historic sold price data in order to help with your property search.
The average Property Paid Price for specific property types in the last three years are:
| Property Type | Average Sold Price | Sold Properties |
|---|---|---|
| Semi Detached House | £297,868.00 | 520 Semi Detached Houses |
| Terraced House | £214,975.00 | 895 Terraced Houses |
| Detached House | £476,601.00 | 388 Detached Houses |
| Flat | £155,413.00 | 266 Flats |

